 RSS Feed
 by Calculated Risk on 5/31/2005 09:00:00 PM
Tuesday, May 31, 2005
UK: Retail Sales Continue Slide
UK's retailers suffered their third consecutive month of declining sales, according to the Independent.
'...the CBI said retailers suffered their third successive monthly fall in sales - making it the worst quarter since the early recession of the early Nineties.More from the Independent:
There was a further blow for retailers from a survey showing the Bank Holiday weekend provided a lacklustre kick-start to half-term holiday trading. John Butler, the UK economist at HSBC, said: "Households no longer intend to make a major purchase. The big-ticket durable boom is over along with the boom in mortgage equity withdrawal."'
'The CBI survey, which covered 226 companies representing four out of 10 shops across the UK, said the number reporting a fall in sales compared with a year ago outweighed those seeing a rise by 7 per cent. This was an improvement from the balance of minus 14 per cent in April but left the rolling three-monthly average at its lowest level sinc e August 1992.
FootFall said the number of visitors to Britain's major shopping centres over the three-day weekend was 1.3 per cent lower than a year ago, driven by a 7 per cent slump in footfall on Monday.'
For more on the UK retail slump:
Times: Retailers expect slowdown to stay for summer
Financial Express: ‘UK retail sales fell again in May’
"Broadly speaking, the categories of goods most closely correlated with housing transactions have fared worse than the average over the past year," said John Longworth, executive director of ASDA and chairman of the CBI's survey panel.Retail Week: Retail sales fall for the third month
Asda executive director and chairman of the CBI's DTS panel John Longworth said: “Sales volumes improved between April and May, but volumes remain a little lower than a year ago and prices are on a downward trend.”It is possible that the UK is leading the US into an economic slowdown. On Angry Bear I presented a chart showing that the US Fed rate increases are about 6 to 8 months behind the BoE. In the UK it started with a housing slowdown and has now moved to retail.
"Sales of groceries, books and stationery are up on a year ago, but those of big ticket items, furniture, carpets, DIY goods and clothing are down,” he added.
Monday, May 30, 2005
Housing and M3
by Calculated Risk on 5/30/2005 01:47:00 AM
My weekly post is up on Angry Bear: Housing, the Fed and M3
Earlier I linked to Federal Reserve Vice Chairman Ferguson's remarks on housing.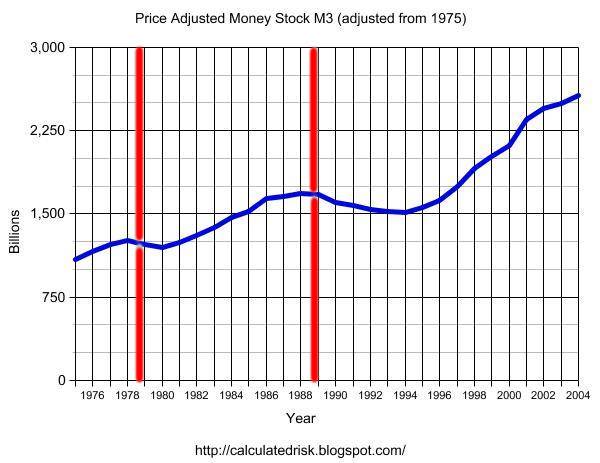
Click on graph for larger image.
Expanding on Dr. Ferguson's analysis, this graph shows price adjusted M3 since 1975. The vertical lines indicate when housing peaked in the previous cycles.
It is important to repeat Dr. Ferguson’s caution regarding not confusing correlation with causation, but it does appear that housing has peaked in the past when price adjusted M3 has peaked.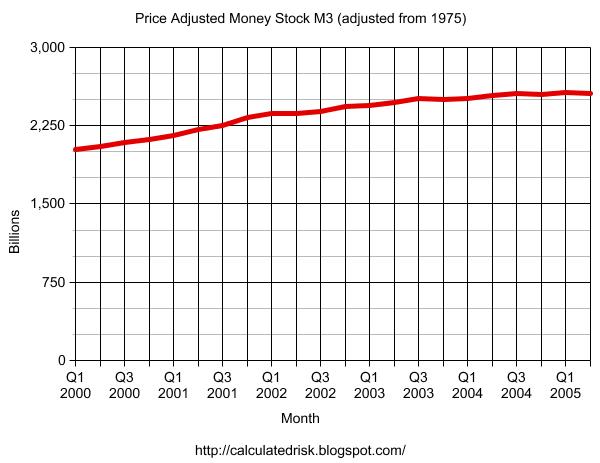
And the second graph shows price adjusted M3 since Q1 2000. It appears that M3 is peaking right now.
We will have to wait to see if housing is peaking. But one thing is certain, the number of articles on housing is setting new highs!
See my previous posts and Patrick's links for a list of recent articles.
Sunday, May 29, 2005
More Housing Articles
by Calculated Risk on 5/29/2005 02:20:00 AM
This weekend has seen a plethora of articles on housing. I posted some links earlier, and you can always check Patrick's site for housing related links.
UPDATE2: A Bane Amid The Housing Boom: Rising Foreclosures
"Philadelphia, its suburbs and indeed much of Pennsylvania have experienced a foreclosure epidemic as low-income homeowners take on mortgage debt they cannot afford. In 2000, the Philadelphia sheriff auctioned 300 to 400 foreclosed properties a month; now he handles more than 1,000 a month. Allegheny County, which includes Pittsburgh, had record auctions of foreclosed homes, and officials speak of a "Depression-era" problem."
UPDATE: See General Glut's comments on another NY Times housing article.
Here are four more:
University of Michigan: Back to the future
Home sales have again reached new peaks as consumers have seamlessly shifted from the irresistible enticement of record low mortgage rates to the equally irresistible temptation of purchasing in advance of rising mortgage rates and home prices. More consumers favored buying homes in advance of anticipated increases in mortgage rates and prices in the May survey than at any other time in the last decade. "Attitudes toward home buying conditions have recently displayed nearly all of the characteristics of earlier bouts of advance buying, a reaction that has typically generated an economic bust following an extended boom," Curtin said. The last time the survey recorded a comparable number of references to advance buying was in 1988-89, more than two years before home prices began to decline in some areas of the country.
LA Times: It's Not a Bubble Until It Bursts
The chief economist for the Mortgage Bankers Assn. is worried enough about the torrid housing market to get out of it.And more:
"I'm going to rent for a while," said Douglas Duncan, who expects "significant reversals" in regions that have enjoyed strong home price appreciation, including Washington, D.C., Florida and California. He plans to sell his suburban Washington home, which has tripled in value since he bought it a dozen years ago, and move into an apartment.
A widely followed University of Michigan consumer survey, released Friday, showed that 24% of respondents nationwide said it was a good time to buy a home because prices would rise. That was the highest percentage since 1988 — right before prices peaked in the previous real estate cycle.
"These are powerful engines creating a boom in home sales, and all booms end the same way," Richard Curtin, director of the survey, said in a statement.
WaPo: The Interest-Only Trap
There's another group of home buyers opting for interest-only loans -- people looking for the lowest mortgage payment possible who probably wouldn't qualify for the house they want with a loan payment that included the interest and principal.
It's that last group of people that worries me the most -- home buyers who are just barely squeezing into a house with an interest-only loan.
"I am not sure that any loan which enables someone to dig their financial grave is good, and I wish that underwriters would realize that," Armstrong said.
Boston Herald: Bank on a bust, not longer boom
The problem: The dynamic of "advance buying" - that rush to buy homes before spiking prices and interest rates make it too late.
It's a tell-tale sign of a coming collapse, Curtin (director of the University of Michigan's Survey of Consumers) says.
"Attitudes toward home-buying conditions have recently displayed nearly all the characteristics of earlier bouts of advance buying,'' Curtin said in a press release Friday, calling it a reaction that has ``typically generated an economic bust."
Saturday, May 28, 2005
NYTimes: Hear a Pop? Watch Out
by Calculated Risk on 5/28/2005 11:35:00 PM
Earlier, on Angry Bear, I tried to quantify the impacts of a housing slowdown on the general economy (See: After the Housing Boom: Impact on the Economy). This NYTimes article asks the same question:
"[W]ould a real estate crash really matter to the country as a whole?Then the article does an excellent job of discussing some of the impacts of declining prices: declining wealth effect, end of equity withdrawal, and much more ...
In a word, yes. To understand why, first look at how pervasive the effects of real estate are throughout the economy."
"But that's not all. The housing sector has even broader effects on the economy, by some estimates accounting for 25 percent of all activity. A decline in property values would most likely lead to declines in other industries, like construction, brokerage, banking and insurance. And these are important for future growth. Construction, for example, amounts to 4 percent to 5 percent of the economy, according to the Bureau of Economic Analysis.For these reasons I'm concerned about the impact of the coming housing bust on the general economy.
Then there's banking. Because of the leverage associated with real estate, a fall in values would affect banks and other lenders. It would probably lead to tightened credit standards, less lending and higher interest rates. If lenders begin to suffer steep losses, there is always the danger of financial contagion, in which problems at one institution ripple out to others it does business with.
And there's a new wild card for the economy. In 2004, adjustable-rate mortgages made up a third of new mortgage originations. No one knows what the effect of the widespread use of A.R.M.'s would be in a down market. A climb in interest rates, of course, would put downward pressure on real estate prices, but A.R.M. borrowers would feel the pinch rapidly. If those borrowers started to default, lenders would be hurt."
Friday, May 27, 2005
Fed's Ferguson: Housing Prices High
by Calculated Risk on 5/27/2005 07:03:00 PM
"In a scenario of collapse, the damage to balance sheets and private wealth could go as far as undermining the soundness of the financial system and threatening stability of the real economy." Federal Reserve Vice-Chairman Roger Ferguson, May 27, 2005
Federal Reserve Vice-Chairman Roger Ferguson made several comments on housing in prepared remarks to a conference sponsored by the Bundesbank in Berlin. A few excerpts:
"A particular phenomenon that touches on all these issues is the movement of asset prices, especially the prices of equities and residential real estate. Because these assets are the most widely held by the general public, price changes, even when not exceptional, can significantly affect the macroeconomy. Rising asset prices support household consumption, whereas falling asset prices damp consumption. In a scenario of collapse, the damage to balance sheets and private wealth could go as far as undermining the soundness of the financial system and threatening stability of the real economy." ...
"For housing, rent-to-price ratios and income-to-price ratios are commonly used measures to assess valuation. Over the past several years, both measures have decreased sharply in many countries, and they currently are well outside historical ranges in some countries. In 2004, U.S. home prices increased 11.2 percent, their fastest pace since 1979, and right now, housing prices in many markets in the United States are relatively high when judged by conventional valuation measures"See Speech for more.
And UPDATE: a few articles on the housing market:
Economists Wary of Interest-Only Loans
Is Your House Overvalued?
Is There a Bubble In Florida Waiting to Burst?
Is U.S. housing market a 'bubble' waiting to burst?
Thursday, May 26, 2005
WSJ: House of Cards?
by Calculated Risk on 5/26/2005 11:00:00 PM
UPDATE: Recommended reading: Running Out of Bubbles by Paul Krugman, NYTimes.
Original post:
The first paragraph is priceless:
Watching the housing market is sort of like a game of Clue before the murder. The victim is still alive and well, but we know he's going down. After the housing market is cold, it should be easy to finger the perpetrator. But for now, we're left to guess (Colonel Greenspan in the conservatory with the lead pipe?), and the perp might not be whom we expect.The last line is a reminder of the difficulty in calling a top:
The Wall Street Journal, March 6, 2000:
"... for now, the frothy buying conditions in some of the nation's biggest housing markets, especially for high-end-homes, worry economists, who remember how the housing market crashed in the late 1980s after some markets overheated."I wasn't concerned about housing in 2000; there was little or no speculation. I am concerned today.
Barclays: UK Bad Debt Soaring
by Calculated Risk on 5/26/2005 10:33:00 PM
The Telegraph reports that Barclays warned "of soaring bad debt on cards":
Barclays yesterday became the first major bank since the recession of the early 1990s to issue a warning that bad debts are growing sharply.Earlier I commented that the UK might be a leading indicator for the US. See also comments by Kash and General Glut.
As the biggest provider of credit cards in the country, with nine million Barclaycard customers, it told the City that provisions for bad debts "rose significantly" in the first quarter of the year.
The good news is that financial stress indicators are still low.
The number of people in serious financial difficulties is still low compared with the last recession. Personal insolvencies have jumped by a third in a year but that can be explained in part by a relaxation in the rules, allowing bankrupts to be discharged after one year instead of five.But it appears the writing is on the wall.
Analysts say that a better indicator of financial duress is the repossession of houses by mortgage lenders. Only 6,320 houses were repossessed last year, compared with 78,000 in 1991.
However, the number of people in arrears with their mortgages is rising for the first time since 1998. The latest figures show that nearly 54,000 households are three to six months in arrears, a rise of 5,000 on a year ago.
Wednesday, May 25, 2005
FED: "Some buyers, some builders, some lenders are going to get burned"
by Calculated Risk on 5/25/2005 09:53:00 PM
Atlanta Federal Reserve Bank President Jack Guynn hinted at more rate hikes in his speech today. In the Q&A he commented on housing:
"There are some local markets, especially in coastal Florida, where I've heard stories for more than a year about behavior that's got to be characterized as nothing other than speculation," Guynn said it response to questions after his speech.On rates, Guynn said:
"It makes me very uncomfortable," he added. "Some buyers, some builders, some lenders are going to get burned, could very likely get burned, in some of those local markets."
"Given the current outlook for the economy, my personal view is that we've not yet reached a neutral policy stance."UPDATE: Dr. Polley earlier posted the same excerpts with a link to Guynn's speech.
Social Security: Senate Democratic Policy Committee Hearing
by Calculated Risk on 5/25/2005 02:28:00 PM
On May 13, 2005 the Senate Democratic Policy Committee held a hearing on Social Security. "An Oversight Hearing on President Bush's Social Security Privatization Plan: Will You and Your Family Be Worse Off?"
There were statements from Senators and five witnesses:
Robert Shiller
Professor of Economics at Yale University
J. Bradford DeLong
Professor of Economics at the University of California-Berkeley
Derrick Max
Executive Director of the Alliance for Worker Retirement Security and the Coalition for the Modernization and Protection of America's Social Security
Peter Orszag
Senior Fellow in Economic Studies and Director of the Retirement Security Project at the Brookings Institution
Beth Kobliner
Personal Finance Columnist and Author of Get a Financial Life: Personal Finance in Your Twenties and Thirties
Many of us have read Dr. DeLong's testimony on his blog. Here is an excerpt from Dr. Shiller's testimony:
I conducted a study in March 2005 that simulates the long-term performance of personal accounts, and the paper, data and simulation program are available on my book website irrationalexuberance.com. The paper uses historical returns from 1871-2004 to assess the likely outcomes of the President’s proposal for various worker choices among the options. It does 91 different simulations for a worker born in 1990 assuming that he or she experiences the actual returns from 1871-1914, 1872-1915, 1873-1916, all the way through 1961-2004.
This sample has a U.S. historical average real stock market return of 6.8% annually, slightly above the 6.5% annual return assumed by the Social Security actuaries. My study also included “adjusted” stock market returns designed to match the median stock return in 15 countries from 1900-2000, 2.2 percentage points lower than the U.S. returns over the same time period. I believe that the international return figure is more realistic.
I found that using U.S. historical returns, a benchmark life-cycle portfolio loses money 32% of the time (i.e., 32% of the time the internal rate of return is less than the 3% real return required to break even in the proposal). The median rate of return is 3.4% annually. Using more realistic adjusted returns, the benchmark life-cycle portfolio loses money 71% of the time and has a median rate of return of 2.6%.
The conclusion is that the president’s personal accounts, even the life-cycle portfolio, would subject Americans to serious risks. The Ownership Society is a long-term and elusive goal, and we should not expose people to unnecessary risks in an overambitious attempt to attain that goal.
For those following the housing market, yes, the same Dr. Shiller.
Tuesday, May 24, 2005
April New Home Sales: 1.316 Million
by Calculated Risk on 5/24/2005 06:38:00 PM
According to a Census Bureau report, New Home Sales set a record in April to a seasonally adjusted annual rate of 1.316 million vs. market expectations of 1.35 million. March sales were revised down significantly to 1.313 Million.
Click on Graph for larger image.
NOTE: The graph starts at 700 thousand units per month to better show monthly variation.
Sales of new one-family houses in April 2005 were at a seasonally adjusted annual rate of 1,316,000, according to estimates released jointly today by the U.S. Census Bureau and the Department of Housing and Urban Development. This is 0.2 percent above the revised March rate of 1,313,000 and is 13.3 percent above the revised April 2004 estimate of 1,162,000.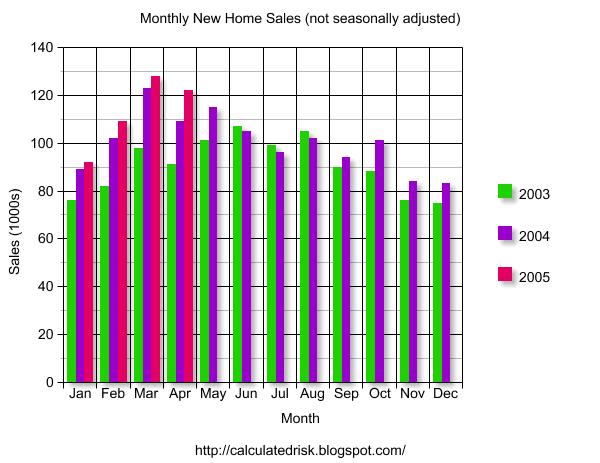
The Not Seasonally Adjusted monthly rate was 122,000 New Homes sold, down from a revised 128,000 in March.
The median sales price of new houses sold in April 2005 was $230,800; the average sales price was $283,500.
Both the median and average are in line with previous months.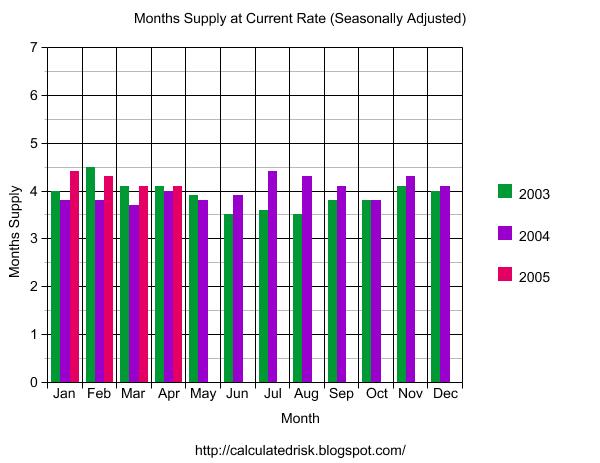
The seasonally adjusted estimate of new houses for sale at the end of April was 440,000. This represents a supply of 4.1 months at the current sales rate.
The seasonally adjusted supply of New Homes was 4.1 months, about normal for the last few years. The supply for March was also 4.1 months, revised from just 3.0 months.
The surprise was the significant downward revision in the March numbers.
Realtors' Economist: A Bubble
by Calculated Risk on 5/24/2005 03:28:00 PM
The head cheerleader for the housing market acknowledged the housing bubble today.
"Fifteen percent price appreciation is too much, even for me," David Lereah, chief economist at the National Association of Realtors, told CNBC's "Morning Call." "The real estate market is taking on a life of its own right now and we need to get a handle on it."Also, Equity loans alarm experts:
"If we return to prudent lending standards, that'll be the death of this housing market," says Keith Gumbinger of loan analysts HSH of Pompton Plains, N.J.I have nothing to add to those two statements!
Forecasting the Trade Deficit: Part II
by Calculated Risk on 5/24/2005 12:27:00 AM
The April trade balance will be reported on June 10th. I'm trying to develop a simple model to help predict the trade deficit. Last Thursday, I posted an oil import model (I need to add exports and Seasonal Adjustments). This post will address China. I'll post my methodology and hopefully others will offer suggestions and improvements.
My general approach is to divide the deficit into two components: petroleum energy related products and everything else. This is a mixed model, by "goods" for petroleum, by country or region for everything else.
CHINA
My approach to China is to assume trade follows the normal seasonal pattern and recent growth trends. The seasonal number will be adjusted according to container traffic at the Port of Long Beach. If anything unusual has happened (change in exchange rate, labor strike, new tariffs, etc.) I will try to factor that into the estimate. For April, the only "unusual" event was the soft patch in the US economy. This probably did not impact imports, so I will assume nothing unusual for April.
US IMPORTS
First, here are the monthly imports from China for the last 6 years.
Click on graph for larger image.
Imports from China have increased every year, except in 2001 when imports were relatively flat (during the US recession). A couple of features stand out: There is a consistent seasonal pattern to imports; low early in the year, building towards the Holiday season and then dropping off at the end of the year. 
The low for the year is usually in February, but it occasionally occurs in March like this year.
The second graph shows the last three years plotted against the best fit trend line. This clearly shows the seasonal pattern to imports.
Comment on Seasonal Adjustment: The seasonal adjustment is intended to remove the seasonal fluctuations from the data. This type of data is usually adjusted with a multiplicative approach: A = C x S x I where:
A = Observed Series (Not Seasonally Adjusted or NSA)
C = Trend Cycle
S = Seasonal Component
I = Irregular Component (weather, strikes, etc.)
Looking at the above graph, if the actual line is typical below the trend line for a given month, the observed numbers are adjusted upwards and if the line is usually above the trend, the oberved number is adjusted down. For April, the typical pattern shows about 4% below the trend line, so the observed number (NSA) will be adjusted upwards (SA). Errors occur if the trend changes. Also, the steeper the trend line, the more error prone the adjustment.
After reviewing the data, it appears that imports from China track inbound container shipments at the port of Long Beach. Of course this is comparing dollars to volume, so the mix of products has to remain relatively stable. The Port of Los Angeles also tracks imports relatively well, but there was a labor shortage last year and LB fit the data better.
This brings me to the first prediction for April: The trend for NSA imports for China is $17.8 Billion. Inbound container traffic was up 29% at both LB and LA ports (more than the usual March increase), so I'm going to adjust NSA upwards to $18.5 Billion.
US EXPORTS
The next step is to estimate the US exports to China. I'm going to use the same approach as for imports.
Exports to China do not show any seasonal pattern. There has been a steady increase with a slight jump in exports in 2003.
Since there is no seasonal pattern, the initial estimate is based on the trend line and the Port of Long Beach data. LB reported a 3% increase in loaded outbound containers, so the estimate will be the 3% higher than March or $3.4 Billion for April.
The final graph shows the relationship between containers and exports from LB. The bad news is the correlation is not as strong as for imports from China.
The good news is exports to China are relatively small compared to imports from China, so any error will have a minimal impact on the overall estimate.
The final step is to convert the NSA numbers to SA. Since there is little or no seasonal trend to US exports, $3.4 Billion is also the SA export number. For imports, the $18.5 Billion number is adjusted up by to $19.3 Billion.
The following table presents the actual for February and March (with estimate of the SA numbers) and the estimates for April.
CHINA TRADE BALANCE: Table numbers in Billions $
NOT SEASONALLY ADJUSTED
| MONTH | NSA Balance | NSA Exports | NSA Imports |
| February | -$13.9 | $3.08 | $16.95 |
| March | -$12.9 | $3.3 | $16.21 |
| April | -$15.1(est) | $3.4(est) | $18.5(est) |
SEASONALLY ADJUSTED (all estimates)
| MONTH | SA Balance | SA Exports | SA Imports |
| February | -$18.1 | $3.08 | $21.19 |
| March | -$15.1 | $3.3 | $18.42 |
| April | -$15.9(est) | $3.4(est) | $19.3(est) |
Note that February (usually a weak month for imports) was relatively strong and the SA number was probably over $21 Billion for imports from China, contributing to the record reported SA trade deficit.
Monday, May 23, 2005
Krugman, Housing, etc.
by Calculated Risk on 5/23/2005 12:51:00 AM
My most recent post is up on Angry Bear: Housing Update.
UPDATE: Mark Szlazak sent me a link (audio) to an interesting housing debate. Fast forward about 10 minutes. Very interesting comments.
UPDATE2: Click on graph for larger image.
Courtesy of WSJ.
The WSJ has a front page article on housing. See The Big Picture for excerpts.
Also, see Dr. Duy's Fed Watch: The FED and the Housing Bubble.
In a recent speech in Bangkok, Dr. Paul Krugman expressed concern about the housing market and the US economy:
Prof Krugman cautioned that the adjustment to the present global financial imbalance could be a "messy" and "deeply troubled" one.Further, in Krugman's Op-Ed today expressed even more concern:
"The US current deficit, at close to 6% of gross domestic product, would be in a danger zone by any standard of a crisis. Most developing countries have no alarms ringing, but the US looks serious."
The US housing market, he said, was also showing signs of a bubble, marked by high prices and speculative demand.
"Macro indicators suggest that the market is speculative mania. Day trading cannot be sustainable. There is a real bubble mentality in the US housing market," Prof Krugman said, adding that prices of US housing were 250% of their real values.
A fall in the housing market and investment would spur a US recession and lead to capital outflows. "There would be a difficult contraction in the US economy. It
would be a very difficult contraction for monetary policy to deal with. I think there is 50% chance for a major break in the situation in the US next year."
"So where will change come from?Although Dr. Krugman is not predicting a depression, I hope he isn't as prescient as FDR in this 1924 letter.
Everyone loves historical analogies. Here's my thought: maybe 2004 was 1928. During the 1920's, the national government followed doctrinaire conservative policies, but reformist policies that presaged the New Deal were already bubbling up in the states, especially in New York.
In 1928 Al Smith, the governor of New York, was defeated in an ugly presidential campaign in which Protestant preachers warned their flocks that a vote for the Catholic Smith was a vote for the devil. But four years later F.D.R. took office, and the New Deal began.
Of course, the coming of the New Deal was hastened by a severe national depression. Strange to say, we may be working on that, too."
"I remarked to a number of friends that I did not think the nation would elect a Democrat again until the Republicans had led us into a serious period of depression and unemployment",FDR, Dec 9, 1924
Friday, May 20, 2005
West Coast Ports: April Traffic Surges
by Calculated Risk on 5/20/2005 04:35:00 PM
Import traffic surged in April for both the Port of Los Angeles and Port of Long Beach. Thanks to Dr. Setser's site for these links.
For Los Angeles, the number of loaded inbound containers for April was 329 thousand, up 29% from March. Outbound traffic was flat (down 0.3%).
For Long Beach, the number of loaded inbound containers for April was 271 thousand, also up 29% from March. Outbound traffic was up 3%.
And in a related story, the West Coast ports will expand their hours to accommodate the expected surge in imports later this year:
Clogged with cargo and bracing for the onslaught of holiday-season imports, the largest U.S. seaport complex will begin this summer to charge a fee on peak-hours trade to encourage port usage on nights and weekends.
Operators of the Southern California seaports of Los Angeles and Long Beach will collect an estimated $160 million per year in fees on cargo delivered or departing during daytime hours, to pay for additional capacity during off-peak times.
The program is the first of its kind in the United States and is being closely watched by other U.S. port operators, said Bruce Wargo, the general manager of PierPASS, the not-for-profit group set up by port operators to administer the program.
Los Angeles and Long Beach form the country's primary trading gateway with Asia and handle more than $200 billion of cargo each year. The ports' top trading partners are China, Japan, South Korea, Thailand and Taiwan.
Greenspan: Only Recent Home Buyers to Have Problems
by Calculated Risk on 5/20/2005 03:57:00 PM
"... only those who have purchased very recently, purchased just before prices actually literally go down, are going to have problems."
Fed Chairman Alan Greenspan, May 20, 2005
Chairman Greenspan gave a speech on energy today, but in the Q&A he answered some questions on the housing market. Here are a few excerpts from Bloomberg:
Some regions of the U.S. housing market are showing signs of unsustainable ``speculation'' and ``froth'' based on fast turnover of existing homes, Federal Reserve Chairman Alan Greenspan said. The price surge may ``simmer down'' as housing becomes less affordable, he said.
``It's pretty clear that it's an unsustainable underlying pattern,'' Greenspan said in response to a question after a speech on markets to the New York Economic Club. ``People are reaching to be able to pay the prices to be able to move into a home.''
``There are a few things that suggest, at a minimum, there's a little froth in this market,'' Greenspan said. While ``we don't perceive that there is a national bubble,'' he said that ``it's hard not to see that there are a lot of local bubbles.''
And from CNN:
Eventually, home prices will decline because the underlying pattern is unsustainable, Greenspan said.My emphasis added. Very comforting for recent homebuyers.
"Without calling the overall national issue a bubble, it's pretty clear that it's an unsustainable underlying pattern. What we see are a number of forces, which are, as far as I can judge, not infinitely projectable," he said.
But when home prices slow, only those who purchased homes just as the prices begin to drop will be impacted by the decline, Greenspan said.
"The number of occasions in which an average level of prices in the United States have actually gone down are very rare," he said.
"Even if there are declines in prices, the significant run-up to date has so increased equity in homes that only those who have purchased very recently, purchased just before prices actually literally go down, are going to have problems," he said.
Forecasting the Trade Deficit: Part I
by Calculated Risk on 5/20/2005 01:01:00 AM
UPDATE: Error correction (thanks to fatbear), I wrote millions instead of billions in several places.
The April trade balance will be reported on June 10th. Over the next couple of weeks, I'm going to try to develop a simple model to predict the trade deficit. I'll post my methodology and hopefully others will offer suggestions and improvements. Of course, it takes more than one month's data to make a trend and these predictions are just for fun.
My general approach will be to divide the deficit into two components: petroleum energy related products and everything else. This is a mixed model, by "goods" for petroleum, by country or region for everything else. We have to be careful: there can be overlap between a country approach and petroleum approach: Canada and Mexico are good examples.
Part I: Energy-Related Petroleum Products (ERPP).
Each month, on exhibit 17, the Census Bureau and the Bureau of Economic Analysis present the imports for ERPP. These numbers are not seasonally adjusted (NSA).
To forecast the Petroleum number we need:
1) Price per barrel of crude oil.
2) Quantity of crude oil imported.
3) Price per barrel of "Other" ERPP
4) Quantity of "Other" ERPP.
Total NSA ERPP ($) = P (crude) * Q (crude) + P (other) * Q (other).
CRUDE OIL
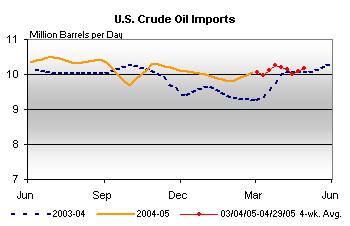
To estimate the Crude price and quantity, I'm going to use the reported numbers from the DOE. On sheet "2-TWIP Crude World & US Prices", the DOE provides the weekly contract price back to 1997. On sheet "5-TWIP Crude Imports" the DOE provides the average daily imports, not including SPR. NOTE: Sheet 2 is contract prices, even though it is labeled "spot" prices "United States Spot Price FOB Weighted by Estimated Import Volume (Dollars per Barrel)".
It appears that the contract lengths vary over time, but an 8 week volume weighted average, provides a close approximation of the price. Using this data since Jan '97, this approach usually (2/3 of the time) comes within +/-2% of the Census reported price, although there were two months were it missed by 5%. Still the correlation is very good. Here is the DOE data since Feb 1:
| Week | Contract Price ($/BBL) | BBL (1000s/day) |
| Feb 04, 2005 | 37.915 | 9914 |
| Feb 11, 2005 | 36.575 | 10434 |
| Feb 18, 2005 | 38.076 | 9643 |
| Feb 25, 2005 | 40.567 | 10065 |
| Mar 04, 2005 | 43.377 | 10099 |
| Mar 11, 2005 | 45.463 | 10041 |
| Mar 18, 2005 | 46.42 | 10270 |
| Mar 25, 2005 | 46.969 | 10568 |
| Apr 01, 2005 | 45.324 | 9890 |
| Apr 08, 2005 | 47.688 | 9863 |
| Apr 15, 2005 | 44.23 | 9718 |
| Apr 22, 2005 | 43.957 | 10863 |
| Apr 29, 2005 | 45.902 | 10259 |
NOTE: I didn't try to adjust the week end to match the month end.
Using this approach, the predicted average March price per BBL/crude would be $41.20. This is almost 2% more than the reported price of $41.14. Pretty close. For April, the predicted P(crude) is $45.70.
For the quantity of crude, I used a 4 week average of the DOE's average daily crude imports. Since '97, using this method has resulted in a fairly consistent prediction that is about 4% low per month (a systemic error). So I adjust this number accordingly (divide by .96). The March prediction of Q (crude) would be: 330,812 BBLs. The actual number was 325,979 or about 1.5% less.
For March, the estimate of NSA crude = 330,812 * $41.20/BBL = $13.63 Billion compared to the actual of $13.41 Billion.
For April, the NSA prediction for Crude is: 328,592 * $45.70 = $15.0 Billion.
OTHER ERPP
According to the Census Bureau, Other ERPP includes "the following SITC commodity groupings; crude oil, petroleum preparations, and liquefied propane and butane gas". Since I'm not sure how to build up a price from all these products, I compared the price for Other ERPP to the price for crude (the 8 week moving volume weighted average). Although the relationship varies, using the following is relatively close: P (Other) = P (crude) * 1.15 (or 15% more). Most months fall within a +/- 5% of this price estimate. It probably depends on the mix of products and I couldn't determine any seasonal pattern to the price.
For Q (Other) I plotted the quantity of "other" since Jan '97. There has been a slight steady increase with a seasonal pattern. The best estimate for Other ERRP Quantity is probably the same month for the previous year. Sometimes this lead to a substantial error (20%), and I welcome a better approach.
For March, estimated Q (Other) would have been 100,000. Actual was 94,281. The estimated NSA Other was $41.20 * 1.15 * 100,000 BBL = $4.7 Billion. Actual was $4.5 Billion. The good news is that the larger percentage errors for "Other" are not very important for the overall ERPP.
For April, the NSA Other estimate = $45.70 * 1.15 * 82,000 BBL = $4.3 Billion.
NSA vs. SA
I haven't worked up a Seasonally Adjusted (SA) number yet for April ERPP. However, here are the numbers for Feb and Mar (see Exhibit 9 for SA numbers). It is interesting that NSA for March was $3 Billion more (or 20% more) than February, but SA March was only $0.75 Billion more (4% more) than February.
NOTE: These are IMPORTS only of ERPP. The US also exports ERPP that will have to evaluated too to estimate the total number.
Table numbers in Billions $
| MONTH | NSA | Seasonally Adjusted |
| February | $14.947 | $18.163 |
| March | $17.955 | $18.913 |
| April | $19.300(est) | To Come |
Here is the NSA estimate for April imports:
TOTAL NSA ERPP APRIL IMPORTS = $15.0 Billion (Crude) + $4.3 Billion (Other) = $19.3 Billion
SA to come. Part II will be about China.
Thursday, May 19, 2005
Fortune: Real Estate Gold Rush
by Calculated Risk on 5/19/2005 05:16:00 PM
The May edition of Fortune has the following cover "Real Estate Gold Rush":
UPDATE: Better photo from The Big Picture. The lead article is "Real Estate Frenzy: Riding the Boom".
(a pay article, but the lead paragraphs are free).
Speculation is the key to recognizing any financial bubble. Although the housing market remains incredibly strong, speculation is reaching a fevered pace. Articles (and covers) like this frequently appear at or near the top.
Hat tip to my friend Mish for the cover!
Wednesday, May 18, 2005
D.C. Real Estate Roulette
by Calculated Risk on 5/18/2005 11:16:00 PM
Here is a great local story on housing in the D.C. area. From "Real Estate Roulette" by Hillary Howard:
"It's expensive to buy a house. Around the Beltway it's not just expensive -- it's hard. Buyers are routinely offering 10 to 15 percent over the seller’s asking price and they're still not getting the deal. Many buyers are even putting escalation clauses in their offers. And, some of those escalation clauses promise to outbid the highest offer. This is what it's come down to."Check out some of the audios too - in "How Many Contracts Come In?" one house had 41 contracts!
Part 1: How Hot Is The Market?
Part 2: How Competitive Is It For Buyers?
Part 3: How Many Contracts Come In?
There are six more segments at the WTOPNews site.
Fed News: Gramlich Resigns, Greenspan Might Stay Longer
by Calculated Risk on 5/18/2005 12:10:00 PM
Edward M. Gramlich resigned today from the Federal Reserve Board of Governors according to a FED press release this morning.
Edward M. Gramlich submitted his resignation Wednesday as a member of the Board of Governors of the Federal Reserve System, effective August 31, 2005. Gramlich, who has been a member of the Board since November 5, 1997, submitted his letter of resignation to President Bush. In view of his impending departure and in keeping with Federal Open Market Committee practice, he will not attend the August 9 meeting of the FOMC.Meanwhile, the WaPo is reporting that "Administration Considers Delaying Fed Chief's Exit".
"Ned has contributed powerfully to the work of the Board and of the FOMC for nearly eight years," said Federal Reserve Board Chairman Alan Greenspan. "Our deliberations have been enriched by his keen insights, his good humor and his lively mind."
Bush administration officials are mulling whether to encourage Greenspan, 79, to continue as Fed chairman for at least a few months beyond the Jan. 31 expiration of his term, according to sources told of the possibility."More time to broaden the search"? The White House wasn't aware that Greenspan was retiring in January?
That would give the White House more time to broaden the search for possible successors, looking beyond the academic and policy worlds to the corporate world, as they have been urged to do by some financial analysts.
UPDATE: New MUST READ Fed Watch by Dr. Tim Duy: Steady as She Goes – In More Ways Than One
Tuesday, May 17, 2005
Luskin's Apology
by Calculated Risk on 5/17/2005 08:32:00 PM
Here is Mr. Luskin's apology:
I apologize for not properly crediting the original error. Unlike DeLong, I will make an honest correction acknowledging this error. Since you posted to DeLong’s comments board pseudonymously, I had no idea how to find your blog. I Googled the quote and got the one I got. It happens.
Assuming that your post as currently formatted is the same as it was originally, and has not itself been corrected without annotation, then DeLong’s misconstrual of what is Buffett and what is you is all the more egregious. The indentation makes it terribly obvious, and your apologies on DeLong’s message boards seem out of order. It is he who should apologize to you for some combination of misquotation and plagiarism.
-=-=-=-=-
Donald L. Luskin
Chief Investment Officer
Trend Macrolytics
First, give Mr. Luskin credit, he did apologize. Of course, I was only upset at his assertion that "... [CalculatedRisk] added to Buffett's quote, himself making it seem that the words were Buffett's, not his own". I did no such thing, and my immediate attempts to correct Dr. DeLong's blog are evidence of my intention. (NOTE: Luskin got the wrong blogger, I've inserted my blog name)
I appreciate Luskin's caveat concerning whether I changed the format; I didn't. But I can understand how Dr. DeLong misread the post (see it for yourself here) and I intend to change the formatting soon to make a better distinction between quotes and my text.
I left Dr. DeLong two messages (here) See Comment #2. (DeLong sometimes get swamped with comments, so I can understand how he overlooked this one):
Edit: Buffett's comments ended with "I mean the idea that this terrible specter looms over us 20 years out which is a small fraction of the deficit we happily run now seems kind of interesting to me."And here (comment #4):
The next sentence was my comment. I didn't mean to imply that was from Warren Buffett.
Best Regards!
Posted by: CalculatedRisk | May 6, 2005 07:43 PM
Error correction: Dr. DeLong, a portion of the quote you attribute to Buffett is actually from me.I don't see anything "out of order" with these attempts at correcting an error. Maybe I'm overly polite at times, but maybe others should be more polite and treat simple errors as, well, simple errors.
The Buffett quote should read: "Well, it's an interesting idea that a deficit of $100 billion a year, something, 20 years out, seems to terrify the administration. But the $400 plus billion dollars deficit currently does nothing but draw yawns. I mean the idea that this terrible specter looms over us 20 years out which is a small fraction of the deficit we happily run now seems kind of interesting to me."
SOURCE: http://transcripts.cnn.com/TRANSCRIPTS/0505/04/ldt.01.html
The following sentences were my commentary. I am sorry that my blog wasn't clear.
Excellent letter!
Best Regards.
Posted by: CalculatedRisk | May 12, 2005 10:30 AM
I disagree with Mr. Luskin's final sentence: "It is he who should apologize to you for some combination of misquotation and plagiarism." First, Luskin made errors in his post; an incorrect link that somehow goes to EBay, and referencing the wrong blogger are two errors. In his apology he states "It happens." I agree - no problem. And the same goes for Dr. DeLong. These are simple mistakes.
If Luskin hadn't claimed I was attempting to pass off my own words as Buffett's, I wouldn't have even asked for an apology.
Further, DeLong didn't misquote me, he accidentally misquoted Buffett after reading my blog. And Luskin's plagiarism comment is absurd: DeLong did not try to pass off my text as his own (the criteria for plagiarism), he accidentally misquoted Buffett.
This is a true tempest in a teapot.
UPDATE: Here is my email response to Mr. Luskin:
Mr. Luskin,
I've posted your response (as promised in my previous post). I appreciate your taking the time to respond.
The errors in your posts didn't bother me. I was only concerned with this comment: "... [CalculatedRisk] added to Buffett's quote, himself making it seem that the words were Buffett's, not his own". (I've corrected the blogger name)
I had no intention of passing off my commentary as Buffett's, and that is why I tried to correct Dr. DeLong's posts. I understand your concern that my formatting might have changed - it hasn't.
Even more important, as a lifelong Republican I'm baffled that our party has abandoned fiscal prudence. Senator Hagel said it well in a 2003 Op-Ed: "I gave my first speech on the Senate floor in February 1997 in support of the balanced-budget amendment. Republicans used to believe in balanced budgets. Republicans used to believe in fiscal responsibility, limited international entanglements and limited government. We have lost our way."
Clearly the General Fund deficit dwarfs any problem with Social Security. Why don't you join with me and help redirect our party to this more serious issue?
Good luck to you.
CR
Housing: A Little Humor
by Calculated Risk on 5/17/2005 07:17:00 PM
Chris directed me to this site for FDIC owned real estate.
Bargain Properties
--------------------------------------------------------------------------------
There are no sales announcements at this time. Please check back soon.
I wonder what they mean by "soon"?
Correcting Luskin
by Calculated Risk on 5/17/2005 05:08:00 PM
I usually don't read Luskin, but pgl at Angry Bear refers me to these two posts by Don Luskin:
These people are so classy
Democrats misquote each other for fellow Democrats
Here is what actually happened:
1) I wrote a post titled Buffet and FDR on May 4th. I quoted Buffett from his appearance on CNN's Lou Dobbs.
2) On May 6th, Dr. DeLong quoted my blog. However, if you compare my post and Dr. DeLong's, you can see that he missed the delination between Buffett's comments and mine. I left Dr. Delong a comment, but he apparently missed it (see 2nd comment).
3) On May 12, Dr. DeLong blogged his Statement on Social Security Reform. Once again I noted the same error (see comment 4).
Obviously this is just a simple mistake that has been corrected.
But look how Luskin engages in name calling and makes several errors:
1) Luskin attributes the quote to '"musenla" on the De Profundis blog'. Wrong. I am the author.
2) Luskin asserts that "musenla" added the extra text trying to make "it seem that the words were Buffett's, not his own". Not true. The Buffett quote was indented, my comments were not. I did not "intend" to make it appear that those were Buffett's comments. I tried to correct DeLong immediately when I discovered he had misread my post.
Luskin owes me an apology. I will print Luskin's apology when he emails it to me.
3) I am a lifelong Republican and former youth delegate to the RNC. I am getting the feeling that moderate Republicans aren't welcome in the GOP anymore.
Monday, May 16, 2005
Kohn: Fed likely to keep raising rates
by Calculated Risk on 5/16/2005 11:04:00 PM
Speaking to the Australian Business Economists in Sydney tonight (via videoconferencing), Federal Reserve Governor Donald Kohn made several remarks concerning US interest rates:
"We have not yet finished this task," [Kohn] said.Hat tip to The Housing Bubble's Ben Jones for the article.
"The federal funds rate appears still to be below the level that we would expect to be consistent with the maintenance of stable inflation and full employment over the medium run.
"And if growth is sustained and inflation remains contained, we are likely to raise rates further at a measured pace."
Further Fed changes to interest rates should induce an increase in the personal savings rate, by increasing a return to saving and dampening the upward momentum in housing prices, Dr Kohn said.
Higher rates would thereby lessen one of the significant spending imbalances in the US economy.
Dr Kohn said there were a number of spending imbalances in the US economy, but that at the most aggregated level there were a large and growing discrepancy between what the US spent and what it produced, as measured by the current account deficit.
"The growing current account deficit has been associated with a pronounced decline in the savings proclivities of the private and public sectors over the last year," he said.
"Households have saved only about one per cent of their after-tax income, and that compares to about eight per cent on average from 1950 to 2000."
Agencies Take Aim on Housing Bubble
by Calculated Risk on 5/16/2005 04:32:00 PM
Today, the Office of the Comptroller of the Currency, the FED, the FDIC and other agencies issued a new credit risk management guidance for home equity lending.
UPDATE: See MarketWatch's Rex Nutting: "Lenders warned of home equity risks"
UPDATE2: WaPo: U.S. Warns Lenders To Elevate Standards
In the late '90s, the FED was criticized for not using higher margin requirements as a tool to prick the stock market bubble. Economist Simon Kwan of the San Francisco Federal Reserve Bank argued that using margin requirements as a policy tool would not be effective, because "Investors can use financial derivatives to obtain exposure to equities without owning stocks, and they also can substitute margin credit with other types of credit."
These arguments do not apply to the housing bubble: investors cannot use derivatives to invest in homes, and rarely are other sources of credit sufficient for a home purchase. Today the various agencies have acted and tightened lending requirements, primarily to protect lending institutions, but indirectly to prick the housing bubble.
In the guidance, the agencies point to several "product, risk management, and underwriting risk factors and trends that have attracted scrutiny":
· Interest-only features that require no amortization of principal for a protracted period;All of these areas of concern are addressed with tighter lending requirements in the various provisions of the new guideline. These include tighter controls to detect mortgage fraud, better controls on third party originations, more stringent appraisal guidelines and more.
· Limited or no documentation of a borrower’s assets, employment, and income (known as "low doc" or "no doc" lending);
· Higher loan-to-value (LTV) and debt-to- income (DTI) ratios;
· Lower credit risk scores for underwriting home equity loans;
· Greater use of automated valuation models (AVMs) and other collateral evaluation tools for the development of appraisals and evaluations; and
· An increase in the number of transactions generated through a loan broker or other third party.
Probably the two most important provisions concern HELOCs (home equity lines of credit) and HLTV (High Loan to Value) loans. With the HLTV loans, the agencies remarked that "in recent examinations, supervisory staff has noted several instances of noncompliance with the supervisory loan-to-value limits ..." In addition to more controls to address this noncompliance, they added a new requirement:
"Loans in excess of the supervisory LTV limits should be identified in the institution's records. The aggregate of high LTV one- to four-family residential loans should not exceed 100 percent of the institution's total capital. Within that limit, high LTV loans for properties other than one- to four-family residential properties should not exceed 30 percent of capital."Lending institutions that are over or close to the limit of allowable HLTV loans must stop making these types of loans.
For HELOCs, lenders are now advised to consider the borrowers ability to pay over the life of the loan. This is a key difference in lending standards; previously lenders only considers the current interest rate and the borrower's income. Here is the key passage:
"... underwriting standards for interest-only and variable rate HELOCs should include an assessment of the borrower's ability to amortize the fully drawn line over the loan term and to absorb potential increases in interest rates."The agencies must be very concerned when they caution lending institutions as follows:
"... prudently underwritten home equity loans should include an evaluation of a borrower's capacity to adequately service the debt."Altogether, this is a clear warning shot across the bow of the housing bubble.
Federal Reserve issues Guidance for Home Equity Lending
by Calculated Risk on 5/16/2005 03:52:00 PM
From the Federal Reserve today:
Agencies Issue Credit Risk Management Guidance for Home Equity Lending
PDF File: CREDIT RISK MANAGEMENT GUIDANCE FOR HOME EQUITY LENDING
Press Release:
The federal bank, thrift, and credit union regulatory agencies today issued guidance that promotes sound risk management practices for home equity lines of credit and loans. The agencies have found that in some cases credit risk management practices for home equity lending have not kept pace with the product's rapid growth and eased underwriting standards.
The rise in home values, coupled with low interest rates and favorable tax treatment, have made home equity lines of credit and loans attractive to consumers. To date, delinquency and loss rates for home equity portfolios have been low, due at least in part to the modest repayment requirements and relaxed structures of this lending. However, the agencies have identified risk factors that, along with vulnerability to interest rate increases, have attracted scrutiny, including:
Interest-only features that require no amortization of principal for a protracted period;
Limited or no documentation of a borrower's assets, employment and income;
Higher loan-to-value (LTV) and debt-to-income ratios;
Lower credit risk scores for underwriting home equity loans;
Greater use of automated valuation models and other collateral evaluation tools for the development of appraisals and evaluations; and
An increased number of transactions generated through a loan broker or other third party.
The agencies note that active portfolio management is especially important for financial institutions that project or have already experienced significant growth or concentrations in higher risk products, such as high LTV, limited documentation and no documentation interest-only, and third-party generated loans.
Like most other lending activity, home equity lending can be conducted in a safe and sound manner with appropriate risk management systems. This guidance outlines the agencies' expectations for sound underwriting standards and effective credit risk management practices for a financial institution's home equity lending activity.
The Undefined GWOT
by Calculated Risk on 5/16/2005 12:19:00 AM
My most recent post is up on Angry Bear: "1,346 Days".
I ask a simple question:
It took 1,346 days to win WWII. 1,346 days after 9/11, what have we accomplished?In addition to the ongoing human tragedy, I am concerned about the economic impact of the poorly defined "war on terror".
Also, I just read Paul Krugman's NYTimes piece "Staying What Course?". It is excellent.
Best Regards to all.
Friday, May 13, 2005
Bank of America: UK Collapsing house price 'nightmare' a real risk
by Calculated Risk on 5/13/2005 01:51:00 PM
As a follow up to my earlier posts this week on the UK housing market (here on Angry Bear and here), the Bank of America has issued a report warning of potentially serious consequences from the housing bust in Britain. I've argued that Britian might be a little ahead of America in this cycle, and that America might see similar problems in the near future.
A few excerpts from the Telegraph article:
"Bank of America warned yesterday that Britain could face a "nightmare scenario" as collapsing house prices combined with the pain of tighter fiscal policy."Stephen Robinett once wrote: "Speculative bubbles go on longer and end quicker than most people expect." When the bubble ends, it will probably happen very quickly. Most likely prices will first stablize and then deflate slowly, but transaction volumes will drop precipitously.
"...the debt financed spending spree of consumers is petering out while the almost unprecedented surge in government spending looks increasingly unsustainable"
"Skyrocketing house prices" had enabled consumers to draw down "staggering" levels of mortgage equity for spending. But the "multiplying" effect of the boom was running out under the delayed impact of earlier rate rises.
"We cannot rule out a nightmare scenario in which a decline in consumption caused by a sudden correction in house prices would lead to an explosive rise in the fiscal deficit that would have to be addressed by a tighter fiscal policy,"
Rubin: Deficit Disorder
by Calculated Risk on 5/13/2005 02:43:00 AM
Former Treasury Secretary Robert Rubin writes in the NYTimes about the fiscal challenges facing America:
"Most pressing is the 10-year federal deficit, which most independent analysts project at $4.5 trillion to $5 trillion ... "The General Fund deficit is clearly the largest and most immediate fiscal problem facing America. Any good business manager or political leader would insist that the most pressing problem be fixed first. Rubin proposes:
"...if the tax cuts for those earning above $200,000 were repealed and the inheritance tax as reformed were continued rather than eliminated, the 10-year projected deficit would be reduced by roughly $1.1 trillion, or almost 25 percent, and the 75-year fiscal reduction would be roughly $3.9 trillion, or approximately equal to the Social Security shortfall. This course of action would be similar to the income tax increases that were combined with spending cuts in the 1993 deficit reduction program, which some predicted would lead to recession but which, instead, was followed by the longest economic expansion in our nation's history."Unfortunately tax increases appear ideologically unacceptable to this administration. Instead they are relying on what Warren Buffett refers to as "wishful thinking and its usual companion, thumb sucking". Rubin concludes:
Of course, we can continue to close our eyes and hope for the best. There's no way to predict whether that will work for another few months or for many more years. But the odds are extremely low that our fiscal imbalances will solve themselves, and we place ourselves at great peril by not facing these realities. Conversely, if we do address these challenges, then with our flexible labor and capital markets, and our historic embrace of change and willingness to take risks, our prospects over time should be very favorable.I agree with Rubin. I believe if we acknowledge our problems and address them in a rational manner, we can fix them. But all I see from the Bush Administration is denial and wishful thinking. With the Bush Administration's course of non-action, it is difficult to remain optimistic.
New Feature at Economist's View
by Calculated Risk on 5/13/2005 12:57:00 AM
Dr. Mark Thoma has convinced his colleague, Dr. Tim Duy to write a regular piece on the Fed at Economist's View. Before going to the University of Oregon, Tim was an International Economist at Treasury and a Fed Watcher for The G7 Group, a private consulting firm.
Dr. Duy's first piece is up "The Art and Practice of Fed Watching" and offers some great advice, like:
The secret to remember is that Fed Watching is not about your interpretation of the economy or what you would do if you were a Board member. That approach will lead you down a bad road. The secret is to interpret the data as the Fed sees it, and remain agnostic about whether the policy is wrong or right.And about the housing bubble:
... there may in an asset bubble in the housing market, but don’t expect the Fed to react to that, at least not before it bursts.A very valuable addition to the econ blogosphere.
Thursday, May 12, 2005
NAR: The Housing Boom Expands
by Calculated Risk on 5/12/2005 12:43:00 PM
From CNN, the National Association of Realtors reports:
U.S. residential real estate markets lost no steam in the first quarter of 2005, according to statistics released Thursday by the National Association of Realtors.In a separate news release, NAR report that "First Quarter State Existing-Home Sales in Record Territory".
The NAR's quarterly report covers 136 metro areas. A record 66 of these have experienced double-digit jumps in home prices over the past year.
The previous record was 62 in the last quarter of 2004. Only six areas showed a fall in prices and those declines were fairly modest.
Total existing-home sales, which include single-family and condos, were at the third-highest pace on record in the first quarter. In addition, 44 states and the District of Columbia showed higher sales in comparison with a year earlier, according to the National Association of Realtors.CNN also provides a list of the price changes by metro area. The usual suspects are at the top of the list (mostly Florida), but many surprising cities reported double digit price gains:
NAR’s latest report on total existing-home sales shows that nationwide the seasonally adjusted annual rate was 6.84 million units in the first quarter, up 8.3 percent from a 6.32 million-unit level in the first quarter of 2004. The record was a pace of 6.90 million units in the second quarter of 2004, followed by 6.88 million in the fourth quarter of last year.
| Charleston WV | 13.0% | $112,500 |
| Champaign/Urbana/Rantoul IL | 12.9% | $120,700 |
| Biloxi/Gulfport MS | 12.8% | $121,100 |
| Wichita KS | 11.7% | $105,100 |
| Portland ME | 11.5% | $243,100 |
| Nashville TN | 11.3% | $152,100 |
| Albuquerque NM | 11.1% | $149,700 |
| Aurora/Elgin IL | 11.0% | $229,300 |
| New Orleans LA | 10.9% | $141,200 |
| Birmingham AL | 10.9% | $152,100 |
| South Bend/Mishawaka IN | 10.7% | $91,100 |
| Amarillo TX | 10.7% | $102,600 |
| Springfield IL | 10.4% | $92,700 |
| Green Bay WI | 10.3% | $152,800 |
The boom is close to Nationwide.
Retail Sales Strong, WalMart Warns
by Calculated Risk on 5/12/2005 09:51:00 AM
The Census Bureaus released the retail sales report for April.
The U.S. Census Bureau announced today that advance estimates of U.S. retail and food services sales for April, adjusted for seasonal variation and holiday and trading-day differences, but not for price changes, were $344.9 billion, an increase of 1.4 percent (±0.7%) from the previous month and up 8.6 percent (±0.8%) from April 2004. Total sales for the February through April 2005 period were up 7.5 percent (±0.5%) from the same period a year ago. The February to March 2005 percent change was revised from +0.3 percent (±0.7%)* to +0.4 percent (±0.3%).Meanwhile, WalMart warned:
Retail trade sales were up 1.4 percent (±0.7%) from March and were 8.7 percent (±1.0%) above last year. Gasoline station sales were up 19.8 percent (±3.1%) from April 2004 and sales of nonstore retailers were up 12.4 percent (±3.5%) from last year.
Wal-Mart Stores Inc. reported a 14 percent increase in first-quarter earnings Thursday, but the results missed Wall Street estimates. The world's largest retailer also warned that second-quarter results would likely be lower than expected as unseasonably cool weather and higher gasoline prices continue to hurt business.What is wrong with this picture?
France’s manufacturing output tumbles, Japan sluggish
by Calculated Risk on 5/12/2005 02:24:00 AM
The Financial Times is reporting that "France's manufacturing industry may be in recession after unexpectedly weak industrial production figures on Wednesday"
Manufacturing output tumbled by 0.3 per cent in the first three months of 2005, and by 0.9 per cent in March compared with February, according to Insee, the French statistics office. France has been one of the eurozone's best performing economies but the latest data point to a marked deterioration.Meanwhile, the International Herald Tribune is reporting "Japan's index of leading economic indicators was below 50 percent in March for a second month, suggesting that the country's economic growth may stall, the Cabinet Office said Wednesday."
Confidence indicators suggest French manufacturing has also remained weak in the current quarter. A second successive quarterly fall would mark a technical recession in manufacturing although the strength of the rest of the economy means France is still some way from overall recession.
"The slump of the Japanese economy will continue, though the risk that it will fall back into recession is fading," said Hiroaki Muto, a senior economist at Sumitomo Mitsui Asset Management in Tokyo. "We can't expect corporate profits to expand this year as they did last year."The global imbalance story continues ...
Industrial production fell 0.3 percent in March from February, the government said on April 28. Spending by households headed by a salaried worker slid 1.1 percent in the same month, the second month of decline, the government said on the same day.
The Japanese economy probably expanded at an annual 2.5 percent pace in the first quarter, according to a Bloomberg News survey.
Wednesday, May 11, 2005
Housing: "More and more Alarms Bells"
by Calculated Risk on 5/11/2005 09:57:00 PM
Danielle DiMartino continues her series on housing with "More than real estate in danger".
How widespread will the fallout be when housing's no longer driving the train?I tried to quantify these same impacts in "After the Housing Boom: Impact on the Economy" on Angry Bear.
Mark Zandi, chief economist at Economy.com, was one of the first to identify the broad economic implications of a potentially overheated housing market.
Mr. Zandi breaks the sector's impact into three areas:
•Direct effects – home building, home improvement and professions directly tied to home sales.
•Indirect effects – the cash the American home is generating via cash-out refinancings, home-equity borrowing and capital gained from home sales.
•Spillover effect – the impact housing is having on non-household balance sheets.
"More and more alarm bells are going off every day," Mr. Zandi said, "and speculation is infecting a growing number of communities across the country."I hope Zandi is wrong, but I'm afraid he is right.
US Trade Deficit: $55 Billion for March
by Calculated Risk on 5/11/2005 08:30:00 AM
The U.S. Census Bureau and the U.S. Bureau of Economic Analysis released the monthly trade balance report today for March:
"... total March exports of $102.2 billion and imports of $157.2 billion resulted in a goods and services deficit of $55.0 billion, $5.6 billion less than the $60.6 billion in February, revised.Note: all numbers are seasonally adjusted.
March exports were $1.5 billion more than February exports of $100.7 billion.
March imports were $4.1 billion less than February imports of $161.2 billion."
UPDATE: See also:
Kash, Angry Bear: US Imports: What and from Where?
Brad Setser: Good News. Trade deficit falls to $55 billion
Macroblog: The U.S. Current Account Deficit: How Big Is Sustainable?
UPDATE2: More from Kash: The US's Comparative Advantage
And pgl responds to the paper by Kouparitsas(recommended by macroblog): Pleasant Current Account Arithmetic (or was it fuzzy math)

Click on graph for larger image.
This graph shows the monthly trade balances for 2003, 2004 and 2005 and depicts the worsening year over year trade imbalance. The March trade deficit improved from February as exports increased $1.5 Billion and imports decreased $4.1 Billion.
The recent increase in oil prices had an impact on the March trade deficit. The average contract price for oil jumped from $36.85 in February to $41.14 in March. This is below the DOE estimate for the contract price and below the record for the import contract price of $41.79 in October.

This graph shows total petroleum imports per month for 2003, 2004 and the first three months of 2005. Petroleum imports were about 30% of the trade deficit or about 1.5% of GDP. Even without petroleum imports, the trade deficit would be close to 4% of GDP - a serious problem.
This is an unexpected improvement in the trade deficit and reminds us that this number is difficult to predict.
"A Real Estate Concentric Economy"
by Calculated Risk on 5/11/2005 01:29:00 AM
Danielle DiMartino has been writing a series on the Real Estate bubble. In "A delicate question of policy" she writes:
If it really is dangerous to have all your eggs in one basket, we might be fried.DiMartino asks: "Just how widespread will the fallout be? More on that tomorrow."
The Bank Credit Analyst research firm published three statistics on the housing industry this week that show how heavily the economy is leaning on the housing market.
•Real estate lending represents a record 53 percent of bank loans.
•Housing accounts for a record 29 percent of household assets.
•Residential real estate has captured 35 percent of private investment – the highest in 35 years.
"Housing has assumed a worryingly large role in the U.S. economy and financial system," the report concluded, "and it will be traumatic when the bubble bursts."
Doug Kass, the astute hedge fund manager of Seabreeze Partners, echoed the report: "There's no doubt we're in a real estate concentric economy."
...
"There is tremendous interest rate risk right now because of the abusive use of interest-only and adjustable-rate mortgages in the last few years," Mr. Kass said. "If we have to reset those mortgages at higher rates, it presents a huge risk to households' balance sheets."
His conclusion: "It's an accident waiting to happen."
I'll be waiting.
Tuesday, May 10, 2005
NAHB: Housing to Stay Healthy
by Calculated Risk on 5/10/2005 04:36:00 PM
According to the National Association of Home Builders: "Housing To Stay Healthy As It Recedes From Its Peak".
"... economists appearing at a forecasting conference held by the National Association of Home Builders (NAHB) last week said housing should remain healthy through next year even as it recedes from peak levels. Driven by ongoing population growth and household formations, an expanding market for second homes and the need to replace aging units, demand for housing should hold up well in the foreseeable future, said panelists."There was some concern expressed about "speculative investment activity" in some of the hotter housing markets: California, Las Vegas, South Florida, Washington, D.C. and the New York-Boston corridor, but the panelists expect to see a slowdown in the rate of price appreciation rather than a decline in prices.
J.P. Morgan’s Glassman discounted fears of reduced house-price appreciation taking a toll on the economy. With the exception of a few boom markets, he said, higher prices largely reflect the real estate market catching up with the lagging prices of the 1990s. “Worry if you want to,” he told audience members. “But I think I would take most of the worries with a grain of salt and just get back to business.”Whew! I guess I've been wrong: "After the Housing Boom: Impact on the Economy". That is a relief.
Monday, May 09, 2005
Update on UK Housing
by Calculated Risk on 5/09/2005 09:36:00 PM
Forbes reported today that UK housing prices are up " 0.31 pct from the previous quarter". That is a slight decline in real terms. However the "volume of sales decreased by 34.77 pct". That is exactly how a housing bust usually works:
"Housing "bubbles" typically do not "pop”, rather prices tend to deflate slowly in real terms, over several years. Historically real estate prices display strong persistence and are sticky downward. Sellers want a price close to recent sales in their neighborhood, and buyers, sensing prices are declining, will wait for even lower prices. This means real estate markets do not clear immediately, and what we usually observe is a drop in transaction volumes."It is the drop in transaction volumes that causes general economic problems (slower retail sales, lower employment, etc.).
UPDATE: In the comments, David Bennett recommends General Glut's comments. Globblog is an excellent site!
See this morning's post on Angry Bear concerning UK housing: When will Housing Slowdown?
March Trade Deficit (Due Wednesday)
by Calculated Risk on 5/09/2005 02:50:00 PM
The current projection for the March trade deficit is $61.2 Billion (briefing.com) to $61.7 Billion (NYTimes). My feeling is this projection is on the low side.
In the comments to a previous post, Brad Setser excerpted some of Morgan's view ($61.2 Billion forecast) on oil:
On the imports side, a sharp rise in oil prices should more than offset some moderation in volumes and lead to another sizable increase in petroleum products.First, according to the Census Bureau, the contract price for imported crude in Feb was $36.85. According to the DOE, the contract price for Mar was close to $46. Also there was no "moderation in volumes" according to the DOE:
Click on graph for larger image.
Source: Dept of Energy
The cost for imported energy related petroleum products was $14.9 Billion in February. The cost for imported petroleum in March will be approximately $20 Billion.
The uncertainty in this report is from the impact of slowing US demand in March (the "soft patch") and the impact of the slowing economies in Europe. (See Ken's comments too) Trade with China is the largest contributor to the trade deficit, and it appears that China's economy was still going strong in March (about 25% of the total goods deficit in February was to China).
Finally, Morgan concludes with:
"Note that our forecast trade deficit is about the same as the Bureau of Economic Analysisassumed in preparing the advance estimate of Q1 GDP."If Morgan is underestimating the trade deficit, then there will also be a significant reduction in Q1 GDP.
Sunday, May 08, 2005
More on housing and the UK
by Calculated Risk on 5/08/2005 11:49:00 PM
My most recent post is up at Angry Bear: When will Housing Slowdown?
There is more bad news from the UK and I think the UK might be leading the US by 6 to 8 months with a housing slowdown.
UPDATE: U.K. Manufacturing Output Slumps
U.K. manufacturing had its biggest drop in almost three years in March, pushing industry closer to recession and damping expectations of higher interest rates after the Bank of England left its benchmark rate unchanged today.
Factory production, which accounts for 16 percent of the economy, dropped 1.6 percent from February, the National Statistics office said in London today. The median forecast in a Bloomberg survey of 26 economists was for a 0.1 percent increase.
The decline in manufacturing comes on top of signs of a slowdown in consumer spending in the U.K.'s 1.1 trillion-pound ($2.1 trillion) economy.
Best to all.
Friday, May 06, 2005
Not Seasonally Adjusted Non-Farm Payroll
by Calculated Risk on 5/06/2005 07:16:00 PM
In the previous post I cautioned about the difference between seasonally adjusted data and not seasonally adjusted data. The reason was some commentators were misusing the birth / death model that is not seasonally adjusted.
Click on graph for larger image.
This illustrates why the BLS reports seasonally adjust job growth. There is a very distinct pattern to hiring / firing. As an example, every January all of the temporary retail help is let go.
For the current month, 1.179 million new "not seaonally adjusted" jobs were created according to the payroll report. The BLS reported 274 thousand new jobs. They seasonally adjust each category, so it is very difficult to determine the actual factors.
For those that want to check these numbers, go here. Just check the boxes for both "Not seasonally adjusted" and "Seasonally Adjusted" Total nonfarm employment. Then click on Retrieve Data.
Two charts will appear. For seasonally adjusted: If you subtract the March number from April you will get the headline number of 274K. For not seasonally adjusted: If you do the same subtraction (March from April) you will get the 1.179 Million number.
CAUTION: Don't use the "Not Seasonally Adjusted" for anything except these exercises. Take a look at January - we lost 2.692 Million jobs! (but seasonally adjusted we gained 124K). We lose a ton of jobs every January and July for seasonal reasons ... this is a series that really needs seasonal adjustment.
The BLS Employment Birth / Death Model
by Calculated Risk on 5/06/2005 12:10:00 PM
In some net discussions, there appears to be some confusion over a component of the jobs report. Today's very good report had a headline number of 274 thousand jobs created in April.
Several places on the internet have pointed out that the birth / death model added 257 thousand jobs to the payroll report. Then they argue that 257K of the 274K were from estimated jobs created by new business. This is incorrect and is a lesson in mixing seasonally adjusted numbers with "not seasonally" adjusted numbers.
The headline seasonally adjusted number for April is 274K jobs. The not seasonally adjusted birth /death model (jobs generated by new business formations) was 257K.
The actual BLS reported jobs created in April was 1.179 Million (before seasonal adjustment). Of these 1.179 million jobs, 257K came from the birth/death model (or about 22%).
If you follow the link to the birth/death model you will see:
"Note that the the net birth/death figures are not seasonally adjusted, and are applied to not seasonally adjusted monthly employment links to determine the final estimate."Finally, when the 1.179 Million jobs is seasonally adjusted you get 274 Thousand headline number.
Also note the BLS caveat:
"The most significant potential drawback to this or any model-based approach is that time series modeling assumes a predictable continuation of historical patterns and relationships and therefore is likely to have some difficulty producing reliable estimates at economic turning points or during periods when there are sudden changes in trend. BLS will continue researching alternative model-based techniques for the net birth/death component; it is likely to remain as the most problematic part of the estimation process."
Thursday, May 05, 2005
Buffett and FDR
by Calculated Risk on 5/05/2005 02:11:00 AM
Warren Buffett was on CNN's Lou Dobbs Tonight on Wednesday. Here is an excerpt:
DOBBS: Are you surprised when you focus on the two deficits we just talked about, the trade deficit, and the budget deficit? The budget deficit is 3.6 percent of our GDP. The trade deficit is reaching just almost 6 percent of GDP. And the president is talking about reforming Social Security. Does that surprise you?There is no question that the Bush Administration is ignoring the most serious economic problems facing America and that they are more interested in ideological driven issues. The most serious fiscal issues are: the General Fund deficit, the current account / trade deficit, and health care. Why are we talking about Social Security?
BUFFETT: Well, it's an interesting idea that a deficit of $100 billion a year, something, 20 years out, seems to terrify the administration. But the $400 plus billion dollars deficit currently does nothing but draw yawns. I mean the idea that this terrible specter looms over us 20 years out which is a small fraction of the deficit we happily run now seems kind of interesting to me.
 I'm reminded of this letter that FDR wrote in 1924 to Delaware attorney Willard Saulsbury.
"I remarked to a number of friends that I did not think the nation would elect a Democrat again until the Republicans had led us into a serious period of depression and unemployment", FDR, Dec 9, 1924
Buffett might find the denial of our serious problems "interesting", but I'm worried that FDR's prediction might ring true again.
I hope not. I remain an optimist; I believe if we acknowledge our problems and address them in a rational manner, we can fix them.
But all I see from the Bush Administration is denial and wishful thinking.
Wednesday, May 04, 2005
Slight Deficit Improvement
by Calculated Risk on 5/04/2005 11:48:00 PM
Here is the current Year over Year deficit number (May 1, 2004 to May 1, 2005 - closest non-weekend dates used). As of May 2, 2005 our National Debt is:
$7,754,579,738,148.68 (Almost $7.8 Trillion)
As of May 3, 2004, our National Debt was:
$7,105,796,969,042.55
So the General Fund has run a deficit of $648.8 Billion over the last 12 months. SOURCE: US Treasury
Of course the Washington Post exaggerates the improvement "Tax Receipts Exceed Treasury Predictions." First, they report the Enron style budget ... , uh, Unified budget. Second, they are wrong about the size of the improvement in the deficit. They are correct when they report that "... the positive turn is likely to be short-lived".
Click on graph for larger image.
For comparison:
For Fiscal 2004 (End Sept 30, 2004): $596 Billion
For Jan 1, 2004 to Jan 1, 2005: $609.8 Billion
For Feb 1, 2004 to Feb 1, 2005: $618.6 Billion
For Mar 1, 2004 to Mar 1, 2005: $635.9 Billion
For Apr 1, 2004 to Apr 1, 2005: $660.9 Billion
For May 1, 2004 to May 1, 2005: $648.8 Billion
A slight improvement.
NOTE: I use the increase in National Debt as a substitute for the General Fund deficit. For technical reasons this is not exact, but it is close. Besides I think this is a solid measure of our indebtedness; it is how much we owe!
BBC: Britain braced for credit crunch
by Calculated Risk on 5/04/2005 09:51:00 PM
Is this the future for the US? A housing slowdown with declining consumer spending. And now the BBC reports that Britain is bracing for rising foreclosures and bankruptcies:
"Not since the mid-1990s, as the last economic recession claimed its final victims, has so much debt pain been felt by so many people.
Debt charities and credit industry bodies have told BBC News that they have seen a surge in the numbers of people unable to pay their bills.
At the same time, according to official figures nearly 26,000 property repossession orders were granted in the first three months of 2005, the highest number since 1995.
And on Friday, it is widely expected that the Department for Trade and Industry (DTI) will reveal a sharp rise in the number of people going bankrupt.
In short, the UK's trillion pound debt hangover finally seems to be kicking in."
Senatorial Sciolism
by Calculated Risk on 5/04/2005 12:39:00 AM
Ignorance is curable. It just takes experience and education. But what can we do when the Chairman of the Senate Budget Committee ignorantly proclaims that "we are tackling the problem of federal spending"? Laugh? Cry?
Today Senator Judd Gregg (R-NH) made that outrageous and specious claim. In a commentary in the New Hampshire Union Leader, Gregg claimed "For the first time in nearly a decade, the budget forces meaningful savings in mandatory government programs, which are driving out-of-control, long-term deficits."
Nonsense. What is driving out-of-control structural deficits is the significant drop-off in tax revenue from the Bush tax shifts.
UPDATE: Correct Y axis on Graph.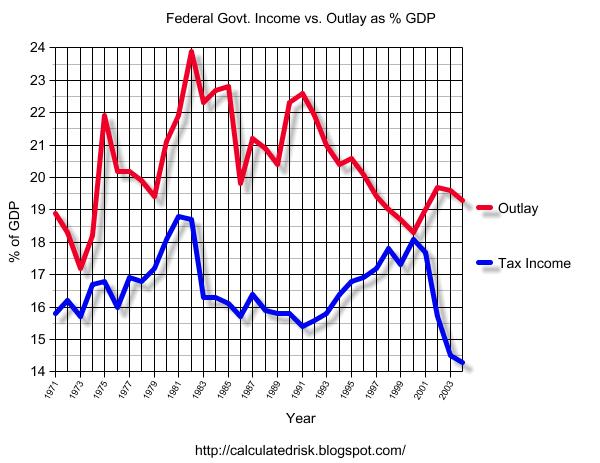
Click on graph for larger image.
The chart depicts Federal Government income and outlays as a % of GDP. "Income" does not include the surpluses for the various trust funds. A steady combination of spending restraint and tax increases brought the budget into balance at the end of the ‘90s. The primary cause of the current budget deficits is the significant decrease in tax revenues, as a % of GDP, due to the Bush tax shifts.
Gregg seems to believe that the fiscal 2006 budget will reduce the deficit. That is also not true. The $106 billion in additional tax cuts for high income earners exceeded the cuts in programs for the poor, meaning the fiscal 2006 budget deficit will set another dubious record.
Mr. Gregg continues: "First, we must tackle the short-term deficit, ..." Although Gregg predictably misunderstands the causes of the deficits, I agree the short term deficit is the top fiscal issue facing America. Not Social Security. But this budget does nothing about the deficit ...
And finally Gregg wrote:
[The budget] maintains job-creating tax policy that has resulted in the fastest-growing economy since 1999 ...
Absolute nonsense. The tax policy was not targeted at job creation. In fact, despite Gregg's implication, this recovery has seen the weakest job creation of any recovery since the Great Depression.
If Gregg was a writer for NRO, I would just chuckle. But he is the Chairman of the Senate Budget Committee. Ignorance and power are a poor combination.


