 RSS Feed
 by Calculated Risk on 3/24/2025 07:34:00 PM
Monday, March 24, 2025
Tuesday: Case-Shiller House Prices, New Home Sales
 From Matthew Graham at Mortgage News Daily: Mortgage Rates Slightly Higher to Start New Week
The average mortgage lender raised rates modestly on Monday morning--a logical move considering the weakness in the bond market over the weekend. Rates are based directly on bonds. Bond "weakness" means investors are paying less for bonds which, in turn, means that yields (aka "rates") are effectively higher.Tuesday:
...
In the bigger picture, all of this analysis is much ado about nothing. Mortgage rates continue a very flat, narrow orbit around 6.75% for top tier conventional 30yr fixed scenarios. A bigger departure from this range will require a bigger shift in several key economic reports (specifically, inflation reports and the big jobs report that typically comes out on the first Friday of the month). [30 year fixed 6.77%]
emphasis added
• At 9:00 AM ET, S&P/Case-Shiller House Price Index for January. The consensus is for a 4.6% year-over-year increase in the 20-city index for January, up from 4.5% YoY in December.
• Also at 9:00 AM, FHFA House Price Index for January. This was originally a GSE only repeat sales, however there is also an expanded index.
• At 10:00 AM, New Home Sales for February from the Census Bureau. The consensus is for 680 thousand SAAR, up from 657 thousand in January.
• Also at 10:00 AM, Richmond Fed Survey of Manufacturing Activity for March.
TSA: Airline Travel up 3% YoY
by Calculated Risk on 3/24/2025 02:51:00 PM
This is something to watch with less international travel.
Here are the daily travel numbers from the TSA.
This data is as of March 23, 2025.
 Click on graph for larger image.
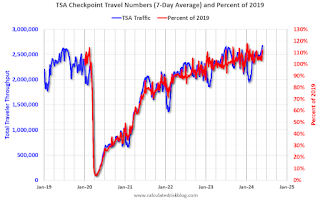
This data shows the 7-day average of daily total traveler throughput from the TSA (Blue).
This data is as of March 23, 2025.
 Click on graph for larger image.
This data shows the 7-day average of daily total traveler throughput from the TSA (Blue).
Air travel is up about 2.6% YoY.
The red line is the percent of 2019 for the seven-day average. Air travel - as a percent of 2019 - is up about 9% from pre-pandemic levels.
The red line is the percent of 2019 for the seven-day average. Air travel - as a percent of 2019 - is up about 9% from pre-pandemic levels.
Policy and 2025 Housing Outlook
by Calculated Risk on 3/24/2025 11:18:00 AM
Today, in the CalculatedRisk Real Estate Newsletter: Policy and 2025 Housing Outlook
Excerpt:
I started the year taking Fed Chair Jerome Powell’s approach to the impact of policy: I’d wait to see what was implemented before changing my outlook.
Now we know a little more. Although there is still significant uncertainty, it appears that tariffs will stay (and likely increase in early April). Deportations will likely pickup. And net legal immigration will slow sharply.
...
Altos Research put out an updated inventory projection last week showing that inventory might end the year at 2019 levels!
If inventory is close to 2019 levels by the end of 2025, and sales remain sluggish, months-of-supply will move up sharply. Sales could pick up if mortgage rates decline, however, if the decline is related to a weaker economy, the increase in unemployment might outweigh any boost from lower mortgage rates.
Note: The pickup in existing home sales in February surprised many analysts (but not readers of this newsletter!). The sales increase in February doesn’t mean sales are recovering, just that analysts underestimated the seasonal adjustment for February, especially this year since there was one fewer working day in February 2025 compared to February 2024. In fact, sales were down YoY.

Housing March 24th Weekly Update: Inventory up 1.9% Week-over-week, Up 30.3% Year-over-year
by Calculated Risk on 3/24/2025 08:11:00 AM
Altos reports that active single-family inventory was up 1.9% week-over-week.
Inventory is now up 7.0% from the seasonal bottom in January and is increasing seasonally.
The first graph shows the seasonal pattern for active single-family inventory since 2015.
 Click on graph for larger image.
The red line is for 2025. The black line is for 2019.
Inventory was up 30.3% compared to the same week in 2024 (last week it was up 29.3%), and down 19.5% compared to the same week in 2019 (last week it was down 20.5%).
The gap to more normal inventory levels has closed significantly!
 This second inventory graph is courtesy of Altos Research.
As of March 21st, inventory was at 668 thousand (7-day average), compared to 656 thousand the prior week.
Mike Simonsen discusses this data regularly on Youtube
Sunday, March 23, 2025
Sunday Night Futures
by Calculated Risk on 3/23/2025 06:51:00 PM
Weekend:
• Schedule for Week of March 23, 2025
Monday:
• At 8:30 AM ET, Chicago Fed National Activity Index for February. This is a composite index of other data.
From CNBC: Pre-Market Data and Bloomberg futures S&P 500 are up 25 and DOW futures are up 160 (fair value).
Oil prices were up over the last week with WTI futures at $68.28 per barrel and Brent at $72.16 per barrel. A year ago, WTI was at $81, and Brent was at $85 - so WTI oil prices are down about 15% year-over-year.
Here is a graph from Gasbuddy.com for nationwide gasoline prices. Nationally prices are at $3.10 per gallon. A year ago, prices were at $3.50 per gallon, so gasoline prices are down $0.40 year-over-year.
The Normal Seasonal Pattern for Median House Prices
by Calculated Risk on 3/23/2025 10:05:00 AM
Last week, in the CalculatedRisk Real Estate Newsletter on March existing home sales, NAR: Existing-Home Sales Increased to 4.26 million SAAR in February; Down 1.2% YoY, I noted:
On a month-over-month basis, median prices increased 1.3% from January and are now down 6.7% from the June 2024 peak. This is about the normal seasonal increase in the median price. Typically, the NAR median price increases in the Spring, and tends to peak seasonally in the June report.Seasonally, median prices typically peak in June (closed sales are mostly for contracts signed in April and May).
And seasonally, prices usually bottom the following January (contracts signed in November and December).
Here is a table of the seasonal percentage increases from January to February, and from January to June (the usual seasonal peak), over the last several years.
The last row shows the seasonal decline from June to January of the following year.
In 2020, prices continued to increase in the 2nd half of the year and didn't peak seasonally until October. And prices only declined slightly in the 2nd half of 2021.
| 2018 | 2019 | 2020 | 2021 | 2022 | 2023 | 2024 | 2025 | |
|---|---|---|---|---|---|---|---|---|
| Jan to Feb | 0.0% | 0.3% | 1.5% | 2.3% | 2.7% | 0.8% | 1.4% | 1.3% |
| Jan to Jun | 13.7% | 14.4% | 10.6% | 20.8% | 16.8% | 13.7% | 12.8% | NA |
| Jun to Jan | -8.9% | -6.7% | 3.1% | -3.4% | -12.8% | -7.7% | -7.8% | NA |
The 2025 increase in median prices from January to February was about the normal seasonal increase.
Normally we'd expect median prices to increase 10% to 12% over the next four months, before declining in the 2nd half of the year. With more inventory, the seasonal pattern will be interesting this year.
Saturday, March 22, 2025
Real Estate Newsletter Articles this Week: Existing-Home Sales Increased to 4.26 million SAAR
by Calculated Risk on 3/22/2025 02:11:00 PM
At the Calculated Risk Real Estate Newsletter this week:
 Click on graph for larger image.
• NAR: Existing-Home Sales Increased to 4.26 million SAAR in February; Down 1.2% YoY
• Housing Starts Increased to 1.501 million Annual Rate in February
• Lennar: "Didn't see typical seasonal pickup after February"
• Lawler: Early Read on Existing Home Sales in February
• California Home Sales Up 2.6% YoY in February; 4th Look at Local Housing Markets
• 3rd Look at Local Housing Markets in February
This is usually published 4 to 6 times a week and provides more in-depth analysis of the housing market.
Schedule for Week of March 23, 2025
by Calculated Risk on 3/22/2025 08:11:00 AM
The key reports scheduled for this week include February New Home sales, the 3rd estimate of Q4 GDP, February Personal Income & Outlays, and January Case-Shiller house prices.
For manufacturing, the March Richmond and Kansas City Fed surveys will be released.
8:30 AM ET: Chicago Fed National Activity Index for February. This is a composite index of other data.
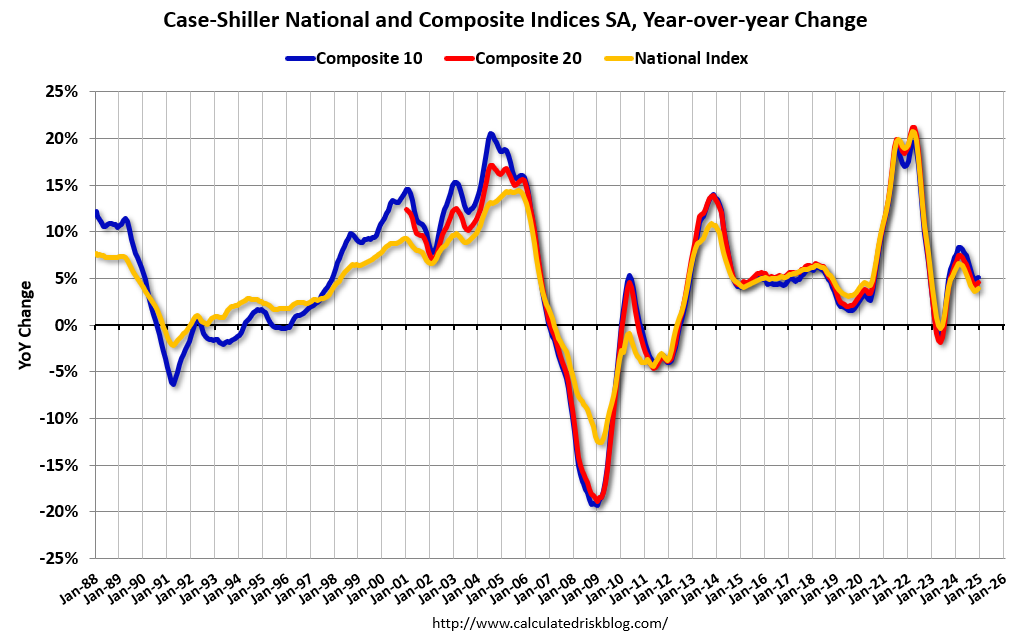 9:00 AM: S&P/Case-Shiller House Price Index for January.
This graph shows the year-over-year change for the Case-Shiller National, Composite 10 and Composite 20 indexes, through the most recent report (the Composite 20 was started in January 2000).
The consensus is for a 4.6% year-over-year increase in the 20-city index for January, up from 4.5% YoY in December.
9:00 AM: FHFA House Price Index for January. This was originally a GSE only repeat sales, however there is also an expanded index.
 10:00 AM: New Home Sales for February from the Census Bureau.
 This graph shows New Home Sales since 1963. The dashed line is the sales rate for last month.
The consensus is for 680 thousand SAAR, up from 657 thousand in January.
10:00 AM: Richmond Fed Survey of Manufacturing Activity for March.
7:00 AM ET: The Mortgage Bankers Association (MBA) will release the results for the mortgage purchase applications index.
8:30 AM: Durable Goods Orders for February from the Census Bureau. The consensus is for a 0.7% decrease in durable goods orders.
8:30 AM: The initial weekly unemployment claims report will be released. The consensus is for 225 initial claims up from 223 thousand last week.
8:30 AM, Gross Domestic Product, 4th Quarter and Year 2024 (Third Estimate), GDP by Industry, and Corporate Profits. The consensus is that real GDP increased 2.3% annualized in Q4, unchanged from 2.3% in the second estimate.
10:00 AM: Pending Home Sales Index for February.
11:00 AM: the Kansas City Fed manufacturing survey for March.
8:30 AM: Personal Income and Outlays for February. The consensus is for a 0.4% increase in personal income, and for a 0.6% increase in personal spending. And for the Core PCE price index to increase 0.3%. PCE prices are expected to be up 2.5% YoY, and core PCE prices up 2.7% YoY.
10:00 AM: University of Michigan's Consumer sentiment index (Final for March). The consensus is for a reading of 57.9.
10:00 AM: State Employment and Unemployment (Monthly) for February 2025
Friday, March 21, 2025
March 21st COVID Update: COVID Deaths Continue Declining
by Calculated Risk on 3/21/2025 07:28:00 PM
 Note: Mortgage rates are from MortgageNewsDaily.com and are for top tier scenarios.
For deaths, I'm currently using 4 weeks ago for "now", since the most recent three weeks will be revised significantly.
Note: "Effective May 1, 2024, hospitals are no longer required to report COVID-19 hospital admissions, hospital capacity, or hospital occupancy data." So, I'm no longer tracking hospitalizations.
| COVID Metrics | ||||
|---|---|---|---|---|
| Now | Week Ago | Goal | ||
| Deaths per Week | 635 | 692 | ≤3501 | |
| 1my goals to stop weekly posts. 🚩 Increasing number weekly for Deaths. ✅ Goal met. | ||||
 Click on graph for larger image.
This graph shows the weekly (columns) number of deaths reported since Jan 2023.
Although weekly deaths met the original goal to stop posting in June 2023 (low of 314 deaths), I've continued to post since deaths are above the goal again - and I'll continue to post until weekly deaths are once again below the goal.
Weekly deaths are now decreasing following the winter pickup and only double the low last year.
 This appears to be a leading indicator for COVID hospitalizations and deaths. This has mostly moved sideways nationally over the last several weeks. This measure has ticked up in the South and Midwest regions.
Nationally COVID in wastewater is "Moderate", up from "Low" last week according to the CDC.
Lennar: "Didn't see typical seasonal pickup after February"
by Calculated Risk on 3/21/2025 02:31:00 PM
Today, in the CalculatedRisk Real Estate Newsletter: Lennar: "Didn't see typical seasonal pickup after February"
Full text:
This is a short note …
The Lennar headline is from a comment this morning. This is just one anecdote, but I believe the housing market will be impacted by policy.
I started the year taking Fed Chair Jerome Powell’s approach to the impact of policy: I’d wait to see what was implemented before changing my outlook. Here is my outlook at the start of 2025:
How much will Residential investment change in 2025? How about housing starts and new home sales in 2025?
What will happen with house prices in 2025?
Will inventory increase further in 2025?
Next week I’ll update my outlook for housing starts, home sales, house prices and more based on the policy changes.


