 RSS Feed
 by Calculated Risk on 3/13/2025 08:30:00 AM
Thursday, March 13, 2025
Weekly Initial Unemployment Claims Decrease to 220,000
The DOL reported:
In the week ending March 8, the advance figure for seasonally adjusted initial claims was 220,000, a decrease of 2,000 from the previous week's revised level. The previous week's level was revised up by 1,000 from 221,000 to 222,000. The 4-week moving average was 226,000, an increase of 1,500 from the previous week's revised average. The previous week's average was revised up by 250 from 224,250 to 224,500.The following graph shows the 4-week moving average of weekly claims since 1971.
emphasis added
 Click on graph for larger image.
The dashed line on the graph is the current 4-week average. The four-week average of weekly unemployment claims increased to 226,000.
The previous week was revised up.
Weekly claims were lower than the consensus forecast.
Wednesday, March 12, 2025
Thursday: Unemployment Claims, PPI, Q4 Flow of Funds
by Calculated Risk on 3/12/2025 07:51:00 PM
 Note: Mortgage rates are from MortgageNewsDaily.com and are for top tier scenarios.
Thursday:
• At 8:30 AM ET, The initial weekly unemployment claims report will be released. The consensus is for 225 initial claims up from 221 thousand last week.
• Also at 8:30 AM, The Producer Price Index for February from the BLS. The consensus is for a 0.3% increase in PPI, and a 0.3% increase in core PPI.
• At 12:00 PM, Q4 Flow of Funds Accounts of the United States from the Federal Reserve.
Part 2: Current State of the Housing Market; Overview for mid-March 2025
by Calculated Risk on 3/12/2025 12:53:00 PM
Today, in the Calculated Risk Real Estate Newsletter: Part 2: Current State of the Housing Market; Overview for mid-March 2025
A brief excerpt:
Earlier this week, in Part 1: Current State of the Housing Market; Overview for mid-March 2025 I reviewed home inventory, housing starts and sales.There is much more in the article.
In Part 2, I will look at house prices, mortgage rates, rents and more.
These “Current State” summaries show us where we came from, where we are, and hopefully give us clues as to where we are going!
NOTE: I started the year adopting the position of Fed Chair Powell, taking a “wait and see” approach on what policies would actually be enacted. Now I’m trying to understand the impact of policy changes on housing. It appears building costs will increase significantly, and demand for housing will likely decline. I’ll have more soon.
...
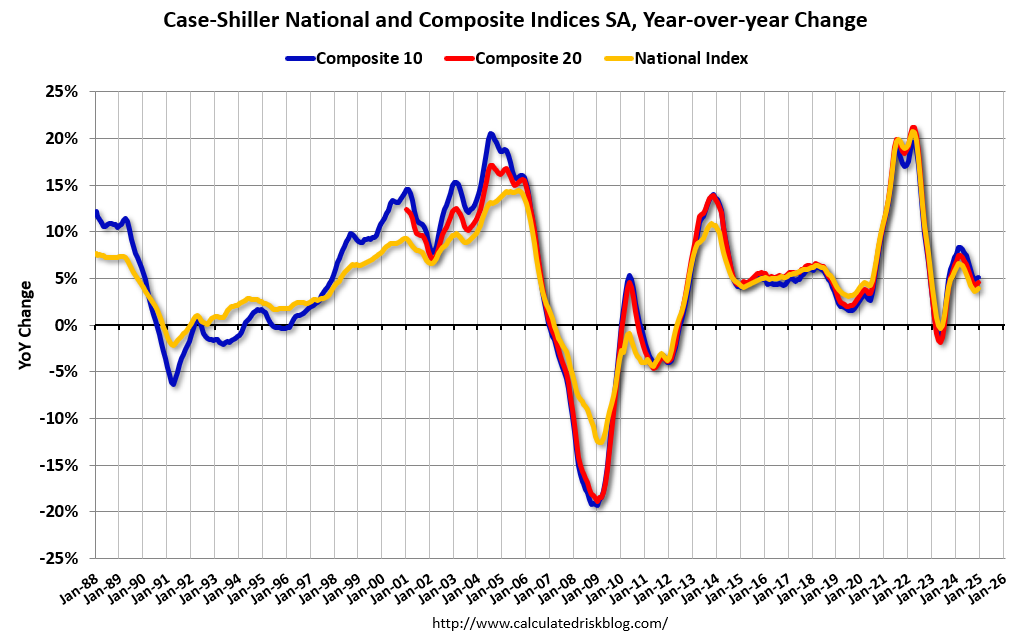
The Case-Shiller National Index increased 3.9% year-over-year (YoY) in December and will be about the same YoY - or slightly higher - in the January report (based on other data).
The MoM increase in the seasonally adjusted (SA) Case-Shiller National Index was at 0.46% (a 5.7% annual rate), This was the 23rd consecutive MoM increase in the seasonally adjusted index.
Cleveland Fed: Median CPI increased 0.3% and Trimmed-mean CPI increased 0.3% in February
by Calculated Risk on 3/12/2025 11:23:00 AM
The Cleveland Fed released the median CPI and the trimmed-mean CPI.
According to the Federal Reserve Bank of Cleveland, the median Consumer Price Index rose 0.3% in February. The 16% trimmed-mean Consumer Price Index increased 0.3%. "The median CPI and 16% trimmed-mean CPI are measures of core inflation calculated by the Federal Reserve Bank of Cleveland based on data released in the Bureau of Labor Statistics’ (BLS) monthly CPI report".
 Click on graph for larger image.
This graph shows the year-over-year change for these four key measures of inflation.
On a year-over-year basis, the median CPI rose 3.5% (down from 3.6% YoY in January), the trimmed-mean CPI rose 3.1% (unchanged from 3.1%), and the CPI less food and energy rose 3.3% (down from 3.1%).
Core PCE is for January was up 2.7% YoY, down from 2.9% in December.
YoY Measures of Inflation: Services, Goods and Shelter
by Calculated Risk on 3/12/2025 08:48:00 AM
Here are a few measures of inflation:
The first graph is the one Fed Chair Powell had mentioned two years ago when services less rent of shelter was up around 8% year-over-year. This declined, but is still elevated, and is now up 3.8% YoY.
 Click on graph for larger image.
This graph shows the YoY price change for Services and Services less rent of shelter through February 2025.
Services were up 4.1% YoY as of February 2025, down from 4.2% YoY in January.
Services less rent of shelter was up 3.8% YoY in February, down from 3.9% YoY in January.
Services less rent of shelter was up 3.8% YoY in February, down from 3.9% YoY in January.
 The second graph shows that goods prices started to increase year-over-year (YoY) in 2020 and accelerated in 2021 due to both strong demand and supply chain disruptions.
Durables were at -1.2% YoY as of February 2025, unchanged from -1.2% YoY in January.
Commodities less food and energy commodities were at -0.0% YoY in February, up from -0.1% YoY in January.
Commodities less food and energy commodities were at -0.0% YoY in February, up from -0.1% YoY in January.
 Here is a graph of the year-over-year change in shelter from the CPI report (through February) and housing from the PCE report (through January)
Shelter was up 4.2% year-over-year in February, down from 4.4% in January. Housing (PCE) was up 4.5% YoY in January, down from 4.7% in December.
This is still catching up with private new lease data.
Core CPI ex-shelter was up 2.2% YoY in February.
BLS: CPI Increased 0.2% in February; Core CPI increased 0.2%
by Calculated Risk on 3/12/2025 08:30:00 AM
The Consumer Price Index for All Urban Consumers (CPI-U) increased 0.2 percent on a seasonally adjusted basis in February, after rising 0.5 percent in January, the U.S. Bureau of Labor Statistics reported today. Over the last 12 months, the all items index increased 2.8 percent before seasonal adjustment.The change in CPI was below expectations. I'll post a graph later today after the Cleveland Fed releases the median and trimmed-mean CPI.
The index for shelter rose 0.3 percent in February, accounting for nearly half of the monthly all items increase. The shelter increase was partially offset by a 4.0-percent decrease in the index for airline fares and a 1.0-percent decline in the index for gasoline. Despite the decrease in the gasoline index, the energy index rose 0.2 percent over the month as the indexes for electricity and natural gas increased. The index for food also increased in February, rising 0.2 percent as the index for food away from home increased 0.4 percent. The food at home index was unchanged over the month.
The index for all items less food and energy rose 0.2 percent in February, following a 0.4-percent increase in January. Indexes that increased over the month include medical care, used cars and trucks, household furnishings and operations, recreation, apparel, and personal care. The indexes for airline fares and new vehicles were among the few major indexes that decreased in February.
The all items index rose 2.8 percent for the 12 months ending February, after rising 3.0 percent over the 12 months ending January. The all items less food and energy index rose 3.1 percent over the last 12 months. The energy index decreased 0.2 percent for the 12 months ending February. The food index increased 2.6 percent over the last year.
emphasis added
MBA: Mortgage Applications Increase in Latest MBA Weekly Survey
by Calculated Risk on 3/12/2025 07:00:00 AM
From the MBA: Mortgage Applications Increase in Latest MBA Weekly Survey
Mortgage applications increased 11.2 percent from one week earlier, according to data from the Mortgage Bankers Association’s (MBA) Weekly Mortgage Applications Survey for the week ending March 7, 2025.
The Market Composite Index, a measure of mortgage loan application volume, increased 11.2 percent on a seasonally adjusted basis from one week earlier. On an unadjusted basis, the Index increased 12 percent compared with the previous week. The Refinance Index increased 16 percent from the previous week and was 90 percent higher than the same week one year ago. The seasonally adjusted Purchase Index increased 7 percent from one week earlier. The unadjusted Purchase Index increased 8 percent compared with the previous week and was 4 percent higher than the same week one year ago.
"Mortgage rates declined for the sixth consecutive week, with the 30-year fixed rate dropping to 6.67 percent, the lowest level since October 2024. As a result, applications increased over the week and were up 31 percent from a year ago,” said Joel Kan, MBA’s Vice President and Deputy Chief Economist. “As we enter the spring homebuying season, the purchase index was more than 4 percent higher than a year ago, and activity was up across all loan categories. Government purchase applications experienced an 11 percent increase – helped by the FHA rate dropping to 6.34 percent. Additionally, average loan sizes were higher, with the purchase loan amount hitting $460,800, the highest in the survey dating back to 1990.”
...
The average contract interest rate for 30-year fixed-rate mortgages with conforming loan balances ($806,500 or less) decreased to 6.67 percent from 6.73 percent, with points increasing to 0.63 from 0.60 (including the origination fee) for 80 percent loan-to-value ratio (LTV) loans.
emphasis added
 Click on graph for larger image.
The first graph shows the MBA mortgage purchase index.
According to the MBA, purchase activity is up 4% year-over-year unadjusted.
Red is a four-week average (blue is weekly).
Purchase application activity is up about 23% from the lows in late October 2023 and is only 2% above the lowest levels during the housing bust.

The second graph shows the refinance index since 1990.
The refinance index increased sharply again this week but remains very low.
Tuesday, March 11, 2025
Wednesday: CPI
by Calculated Risk on 3/11/2025 07:55:00 PM
 Note: Mortgage rates are from MortgageNewsDaily.com and are for top tier scenarios.
Wednesday:
• At 7:00 AM ET, The Mortgage Bankers Association (MBA) will release the results for the mortgage purchase applications index.
• At 8:30 AM, The Consumer Price Index for February from the BLS. The consensus is for a 0.3% increase in CPI, and a 0.3% increase in core CPI. The consensus is for CPI to be up 2.9% Year-over-year (YoY), and core CPI to be up 3.2% YoY.
Lawler: Some Observations on the Federal Reserve’s Balance Sheet Wind-Down and Reinvestment “Strategy” (Still in Quantitative Easing Mode, Just Less So)
by Calculated Risk on 3/11/2025 04:42:00 PM
From housing economist Tom Lawler:
From the beginning of 2020 to early June of 2022 the Federal Reserve’s balance sheet more than doubled to an almost inconceivable $8.9 trillion, with almost all of the gain reflecting increases in the Federal Reserve’s holdings of Treasuries and Agency MBS.
Most of these gains in Treasury and Agency MBS assets were “funded” with increases in very short duration interest-bearing Federal Reserve liabilities, mainly deposits of depository institutions (reserves) and Reverse Repos.
The Federal Reserve began the process of gradually reducing the size of its balance sheet in early June, and from June 8, 2022 to February 26, 2025 the Federal Reserve’s balance sheet had declined to a little under $6.8 trillion, with most of the decline reflecting decreases in Treasury and Agency MBS holdings. At the same time Federal Reserve short-term interest-bearing liabilities fell by a similar but slightly smaller amount.
 Click on table for larger image.
The sizable increases in Federal Reserve assets both after the financial crisis and after the COVID period mainly reflected the purchase of long duration Treasuries and Agency MBS, while the large increases in Federal Reserve liabilities during these periods mainly reflected sizable increases in Federal Reserve short-term interest bearing liabilities (though Federal Reserve Notes – currency in circulation – and Treasury General Account balances also rose). Both of these periods, characterized as “quantitative easing,” were designed in part to lower longer-term interest rates (and mortgage rates) by reducing the amount of long-duration Treasuries and Agency MBS held by the private sector and increasing the amount of short duration Federal Reserve liabilities held by the private sector (including banks).
 Given the significant declines in Federal Reserve holdings of Treasuries and Agency MBS since early 2022, the uninformed (such as Treasury Secretary Bessent) might conclude that the Federal Reserve has been a big net seller of Treasuries and MBS over that period. Indeed, IF the Fed had chosen to reduce its balance sheet size by selling long duration Treasuries and MBS over this period and used the proceeds to reduce its short-duration interest-bearing liabilities, then this period would indeed be one that could be characterized as “quantitative tightening.”
However, that is not what the Federal Reserve did over this period. On the Agency MBS front the Federal Reserve has been letting its MBS holdings run off by not reinvesting principal repayments into new MBS. And on the Treasury front the Federal Reserve has reinvested some (but not all) of the Treasuries that have been maturing (which by definition are short duration) into intermediate and long maturities, with the amount reinvested determined by “caps” and targeted balance sheet levels.
Because there has been a sizeable amount of Fed Treasury holdings maturing in any given year, and since the amount maturing in any given year significantly exceeded the Fed’s targeted balance sheet reduction, on net the Federal Reserve has been a sizable net buyer of Treasury securities from 2022 to 2025. Moreover, since its reinvestment strategy has been to buy mainly Treasury notes and bonds that “sorta” reflected the maturity of Treasury notes and bonds outstanding (but not total Treasury debt outstanding, which includes a large amount of Treasury bills), the net result has been that while total Fed Treasury holdings have declined, the average maturity of Fed Treasury holdings has increased significantly, and the gap between the average maturity of Fed Treasury holdings and that of marketable Treasury securities has widened significantly.
Inquiring minds might want to know why the Federal Reserve did not achieve its balance sheet targets by selling longer maturity/duration assets it had previously purchased. While the Fed has never really explained why it didn’t, implicitly there are three reasons: first, the Fed was concerned that large-scale assets sales would be “disruptive” to the markets; second, the Fed did not want to book large losses, which would increase its deferred remittances to the Treasury; and third, the Fed wanted to keep in place some of its “quantitative easing;” that is it did not want to engage in quantitative tightening, but instead just wanted to have a little less quantitative easing than before.
Focusing now just on Treasury holdings, below is a table comparing Fed Treasury holdings and marketable Treasury debt outstanding at the end of February 2025.
 There are several things to note from this table. First, the average maturity of all Fed Treasury holdings as of the end of February was 8.952 years, over 3 years longer than the average maturity of Treasury marketable Treasury debt outstanding. If one just looks and Treasury bill, note, and bond holdings (it is not clear how TIPS holdings might impact the yield curve), the average maturity of Fed holdings was 9.003 years, 3.1 years longer than that for marketable Treasury bills, notes, and bonds outstanding. This is NOT a “neutral” stance when it comes to the Federal Reserve’s balance sheet, but instead reflects the fact that quantitative easing remained in force.
Second, the Fed only held a paltry 3.1% of marketable Treasury bills outstanding at the end of February, and Treasury bills accounted for a measly 4.7% of total Fed Treasury holdings. By way of comparison, Treasury bills accounted for 35% of total Fed Treasury holdings at the end of 2006.
And third, the Fed held a staggering 30% of marketable Treasury bonds maturing in over 10 years at the end of February, and 10+ maturity Treasury bonds were 34% of total Fed Treasury holdings.
Below is a comparable table for the end of 2022.
 While the Federal Reserve’s balance sheet at the end of February 2025 was significantly lower than it was at the end of 2022, the “gap” between the average maturity of Fed Treasury holdings and marketable Treasury debt outstanding at the end of February 2025 (just over 3 years) was significantly wider than was the case at the end of 2022 (just under 1.6 years). Obviously, the decline in the size of the balance sheet significantly overstates the degree to which the Fed’s balance sheet has reduced the degree of quantitative easing over this period.
What seems especially surprising over this period is the Fed’s decision to reduce its holdings of Treasury bills. If the Fed wanted to reduce the degree of quantitative easing while at the same time limit the speed with which the total balance sheet fell, an obvious way to do this would be to reinvest “excess” Treasury maturities into Treasury bills. (After all, Treasury notes close to maturity are by their nature short maturity assets!) And second, the Fed held less than 8% of total Treasury bills outstanding at the end of 2022, compared to almost 27% of Treasury notes and bonds outstanding, suggesting ample room to increase Treasury bills relative to Treasury notes and bonds.
The Fed instead over this period reinvested significant amounts (net about $450 billion) of “excess” maturities into Treasury notes and bonds that had a weighted average maturity at the end of February of about 8 years, and obviously a higher weighted average maturity at the time of purchase. (e.g., a 10-year Treasury purchase at the end of February 2023 would be have an 8 year maturity at the end of February 2025). I “guesstimate” that the weighted average maturity of net purchases by time of purchase over this period was about 8.7 years.
What if the Federal Reserve had instead reinvested ALL of the “excess” Treasury maturities (that is, it kept its total balance sheet target the same) in Treasury bills?
Here is what the Fed’s balance sheet would have looked like at the end of February.
 As the table shows, an “all TBill” strategy for reinvesting “excess” maturities would have reduced the weighted average maturity of Federal Reserve Treasury holdings by almost a full year, and while that WAM would still be higher than that of all marketable Treasury debt outstanding, it would at least have represented some progress in moving the Federal Reserve holdings to a more “neutral” level.
Some might wonder if such a large increase in Tbills might be disruptive. I would argue not, as this Tbills reinvestment strategy would still have left the Fed’s share of all Tbill outstanding at the end of February at just 10.5%, compared to the Fed’s share of all Treasury notes and bonds outstanding of 16.1%.
However, the Federal Reserve has instead continued a reinvestment strategy that materially reduces the average maturity of private sector government obligations (via its Treasury security holdings and its short-term liabilities). And by letting its still sizable ($2.2 trillion) Agency MBS portfolio with an estimate weighted average life of 8 ½ - 9 years to just slowly roll off adds even more to this private-sector maturity “transformation.”
So net, one could (and should) say current Federal Reserve balance sheet policy is still in a quantitative easing mode, but just not quite as much so as it was several years ago. This may be one reason why the yield curve was inverted so long without “triggering” a recession, and why Treasury term premium remain historically low (though not as low as a few years ago).
Looking ahead, it is quite possible that when the Fed finally decides to stop reducing the size of its balance sheet, it will also work to reduce the average maturity of its Treasury holdings. Here are a few excerpts from the January meeting minutes. (My bolds)
“A number of participants also discussed some issues related to the balance sheet. Regarding the composition of secondary-market purchases of Treasury securities that would occur once the process of reducing the size of the Federal Reserve’s holdings of securities had come to an end, many participants expressed the view that it would be appropriate to structure purchases in a way that moved the maturity composition of the SOMA portfolio closer to that of the outstanding stock of Treasury debt while also minimizing the risk of disruptions to the market.Given the huge current gap between the maturity of SOMA holdings and the maturity of marketable Treasury debt outstanding, presumably these comments suggest that when the Fed decides to stop shrinking its balance sheet, it might also REDUCE its purchases of long-term Treasuries!!!
Next, the deputy manager briefed policymakers on possible alternative strategies that the Committee might follow with regard to purchases of Treasury securities in the secondary market after the eventual conclusion of the process of balance sheet runoff. These strategies would further implement the policy laid out in the Committee’s Principles and Plans for Reducing the Size of the Federal Reserve’s Balance Sheet. The briefing outlined a few illustrative scenarios; under each scenario, principal payments received from agency debt and agency mortgage backed securities (MBS) holdings would be directed toward Treasury securities via secondary-market purchases. The scenarios presented corresponded to different trajectories of the holdings of Treasury securities in the SOMA. Under all scenarios considered, the maturity composition of Treasury holdings in the SOMA portfolio moved into closer alignment with the maturity composition of the outstanding stock of Treasury securities. The scenarios differed on how quickly this alignment would be achieved and, correspondingly, on the assumed increase over coming years in the share of Treasury bills held in the SOMA portfolio."
However, that is just a maybe, and in the interim the Fed has continued to be a large net buyer of intermediate- and long-term Treasuries.
 To end this very long article, here is a list of SOMA purchases (add-ons) of Treasury notes and bonds at this year’s auctions to date.
This was from housing economist Tom Lawler.
CPI Preview
by Calculated Risk on 3/11/2025 02:51:00 PM
The Consumer Price Index for February is scheduled to be released tomorrow. The consensus is for a 0.3% increase in CPI, and a 0.3% increase in core CPI. The consensus is for CPI to be up 2.9% year-over-year (YoY), and core CPI to be up 3.2% YoY.
From Goldman Sachs economists:
We forecast a 0.29% increase in the core CPI in February (vs. 0.3% consensus). Our forecast reflects an increase in used (+0.6%) and new car prices (+0.3%) and another large increase in car insurance (+1.0%), as well as a boost from seasonal distortions to communications (+0.3%) and airfares (+2.5%). We expect the shelter components to moderate slightly (OER +0.29%, rent +0.27%) and lodging to reverse some of last month’s jump (-0.5%).From BofA:
Our forecast would lower year-over-year core CPI inflation to 3.21%. We forecast that headline CPI rose 0.27% in February, reflecting higher food (+0.2%) and energy (+0.2%) prices, and 2.87% over the last year.
We forecast that February headline and core CPI rose by 0.3% mom. While this would be a notable moderation from January, it would still be a sticky-high print. We expect the increase in tariffs on China to boost core goods excluding used car prices. Core services inflation, meanwhile, should moderate but remain above levels consistent with the Fed’s target. In short, CPI data should reinforce our view that inflation progress has stalled.


