by Calculated Risk on 2/08/2024 07:30:00 PM
Thursday, February 08, 2024
Friday: Updated Seasonal Factors for CPI

Friday:
• At 8:30 AM ET, Updated Seasonal Factors for CPI (January 2019 through December 2023)
Hotels: Occupancy Rate Decreased 0.1% Year-over-year
by Calculated Risk on 2/08/2024 04:31:00 PM
U.S. hotel performance decreased slightly from the previous week, while year-over-year comparisons remained mixed, according to CoStar’s latest data through 3 February. ...The following graph shows the seasonal pattern for the hotel occupancy rate using the four-week average.
28 January through 3 February 2024 (percentage change from comparable week in 2023):
• Occupancy: 55.2% (-0.1%)
• Average daily rate (ADR): US$147.99 (+1.9%)
• Revenue per available room (RevPAR): US$81.69 (+1.7%)
emphasis added
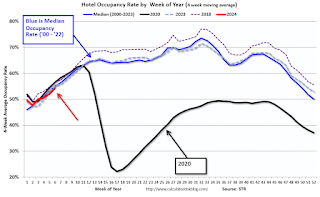 Click on graph for larger image.
The red line is for 2024, black is 2020, blue is the median, and dashed light blue is for 2023. Dashed purple is for 2018, the record year for hotel occupancy.
Realtor.com Reports Active Inventory UP 12.2% YoY; New Listings up 12.8% YoY
by Calculated Risk on 2/08/2024 02:30:00 PM
Realtor.com has monthly and weekly data on the existing home market. Here is their weekly report: Weekly Housing Trends View — Data Week Ending February 3rd, 2024
• Active inventory increased, with for-sale homes 12.2% above year ago levels.
For a 13th consecutive week, active listings registered above prior year level, which means that today’s home shoppers have more homes to choose from that aren’t already in the process of being sold. The added inventory has certainly improved conditions from this time one year ago, but overall inventory is still low. For the month as a whole, January inventory is down nearly 40% below 2017 to 2019 levels.
• New listings–a measure of sellers putting homes up for sale–were up this week, by 12.8% from one year ago.
Newly listed homes were above last year’s levels for the 15th week in a row. It was the biggest jump in nearly three years, which could further contribute to a recovery in active listings meaning more options for home shoppers.
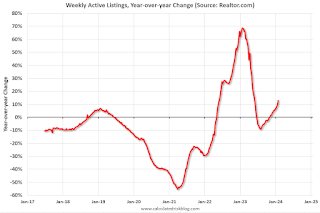 Here is a graph of the year-over-year change in inventory according to realtor.com.
 Inventory was up year-over-year for the 13th consecutive week following 20 consecutive weeks with a YoY decrease in inventory.
MBA: Mortgage Delinquencies Increase in Q4 2023
by Calculated Risk on 2/08/2024 11:23:00 AM
Today, in the Calculated Risk Real Estate Newsletter: MBA: Mortgage Delinquencies Increase in Q4 2023
A brief excerpt:
From the MBA: Mortgage Delinquencies Increase in the Fourth Quarter of 2023There is much more in the article.The delinquency rate for mortgage loans on one-to-four-unit residential properties increased to a seasonally adjusted rate of 3.88 percent of all loans outstanding at the end of the fourth quarter of 2023, according to the Mortgage Bankers Association’s (MBA) National Delinquency Survey....
The following graph shows the percent of loans delinquent by days past due. Overall delinquencies increased in Q4. The sharp increase in 2020 in the 90-day bucket was due to loans in forbearance (included as delinquent, but not reported to the credit bureaus).
The percent of loans in the foreclosure process decreased year-over-year from 0.57 percent in Q4 2022 to 0.47 percent in Q4 2023 (red), even with the end of the foreclosure moratoriums, and remain historically low.
The primary concern is the increase in 30- and 60-day delinquencies (blue), although still historically low. I don’t think this increase is much of a concern.
Weekly Initial Unemployment Claims Decrease to 218,000
by Calculated Risk on 2/08/2024 08:30:00 AM
The DOL reported:
In the week ending February 3, the advance figure for seasonally adjusted initial claims was 218,000, a decrease of 9,000 from the previous week's revised level. The previous week's level was revised up by 3,000 from 224,000 to 227,000. The 4-week moving average was 212,250, an increase of 3,750 from the previous week's revised average. The previous week's average was revised up by 750 from 207,750 to 208,500.The following graph shows the 4-week moving average of weekly claims since 1971.
emphasis added
 Click on graph for larger image.
The dashed line on the graph is the current 4-week average. The four-week average of weekly unemployment claims increased to 212,250.
The previous week was revised up.
Weekly claims were below the consensus forecast.
Wednesday, February 07, 2024
Thursday: Unemployment Claims
by Calculated Risk on 2/07/2024 07:20:00 PM
Thursday:
• At 8:30 AM ET, The initial weekly unemployment claims report will be released. The consensus is for 220 thousand initial claims, down from 224 thousand last week.
Update: Lumber Prices Up 6% YoY
by Calculated Risk on 2/07/2024 03:39:00 PM
This graph shows CME random length framing futures through last August (blue), and the new physically-delivered Lumber Futures (LBR) contract starting in August 2022 (Red).
1st Look at Local Housing Markets in January
by Calculated Risk on 2/07/2024 01:15:00 PM
Today, in the Calculated Risk Real Estate Newsletter: 1st Look at Local Housing Markets in December
A brief excerpt:
NOTE: The tables for active listings, new listings and closed sales all include a comparison to January 2019 for each local market (some 2019 data is not available).There is much more in the article.
This is the first look at several early reporting local markets in December. I’m tracking about 40 local housing markets in the US. Some of the 40 markets are states, and some are metropolitan areas. I’ll update these tables throughout the month as additional data is released.
Closed sales in January were mostly for contracts signed in November and December when 30-year mortgage rates averaged 7.44% and 6.82%, respectively.
...
And a table of January sales.
In January, sales in these markets were up 3.1%. In December, these same markets were down 7.2% year-over-year Not Seasonally Adjusted (NSA).
Sales in all of these markets are down sharply compared to January 2019.
...
This was just several early reporting markets. Many more local markets to come!
Wholesale Used Car Prices "Flat" in December; Down 9.2% Year-over-year
by Calculated Risk on 2/07/2024 09:10:00 AM
From Manheim Consulting today: Wholesale Used-Vehicle Prices Flat in January
Wholesale used-vehicle prices (on a mix, mileage, and seasonally adjusted basis) were unchanged in January compared to December. The Manheim Used Vehicle Value Index (MUVVI) remained at 204.0 but down 9.2% from a year ago. The index experienced the same 0.0% monthly change from December 2021 to January 2022.
“With the volatility we saw last year, it was a welcome sign for the industry to have a calmer month,” said Jeremy Robb, senior director of Economic and Industry Insights for Cox Automotive. “We observed some price declines in the market in the first couple of weeks of January before the winter storm slowed activity in the wholesale markets during the King holiday week. As activity picked up later in the month, we saw more buying activity, which led to flat values in January. The 0.0% month-over-month change showed stronger values than the 0.2% decline we typically see in January. As we move into tax refund season, we expect to see a bit more activity in the wholesale market, and we maintain that 2024 should show more normal market trends through the year.”
The seasonal adjustment countered the January non-adjusted decrease. The non-adjusted price in January declined by 0.2% compared to December, moving the unadjusted average price down 9.3% year over year.
emphasis added
 Click on graph for larger image.
This index from Manheim Consulting is based on all completed sales transactions at Manheim’s U.S. auctions.
Trade Deficit at $62.2 Billion in December
by Calculated Risk on 2/07/2024 08:30:00 AM
The Census Bureau and the Bureau of Economic Analysis reported:
The U.S. Census Bureau and the U.S. Bureau of Economic Analysis announced today that the goods and services deficit was $62.2 billion in December, up $0.3 billion from $61.9 billion in November, revised.
December exports were $258.2 billion, $3.9 billion more than November exports. December imports were $320.4 billion, $4.2 billion more than November imports.
emphasis added
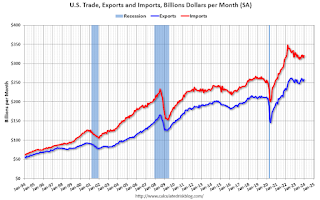 Click on graph for larger image.
Both exports imports increased in December.
Exports are up 3.2% year-over-year; imports are down 0.4$ year-over-year.
Both imports and exports decreased sharply due to COVID-19 and then bounced back - imports and exports are moving sideways recently.
The second graph shows the U.S. trade deficit, with and without petroleum.
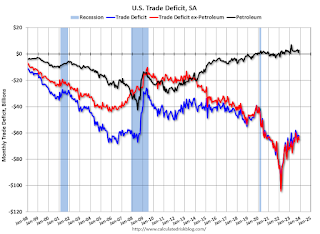 The blue line is the total deficit, and the black line is the petroleum deficit, and the red line is the trade deficit ex-petroleum products.
Note that net, exports of petroleum products are positive and have been increasing.
The trade deficit with China decreased to $22.1 billion from $23.6 billion a year ago.


