 RSS Feed
 by Calculated Risk on 6/01/2023 08:33:00 AM
Thursday, June 01, 2023
Weekly Initial Unemployment Claims increased to 232,000
The DOL reported:
In the week ending May 27, the advance figure for seasonally adjusted initial claims was 232,000, an increase of 2,000 from the previous week's revised level. The previous week's level was revised up by 1,000 from 229,000 to 230,000. The 4-week moving average was 229,500, a decrease of 2,500 from the previous week's revised average. The previous week's average was revised up by 250 from 231,750 to 232,000.The following graph shows the 4-week moving average of weekly claims since 1971.
emphasis added
 Click on graph for larger image.
The dashed line on the graph is the current 4-week average. The four-week average of weekly unemployment claims was decreased to 229,500.
The previous week was revised up.
Weekly claims were below the consensus forecast.
ADP: Private Employment Increased 278,000 in May
by Calculated Risk on 6/01/2023 08:20:00 AM
Private sector employment increased by 278,000 jobs in May and annual pay was up 6.5 percent year-over-year, according to the May ADP® National Employment ReportTM produced by the ADP Research Institute® in collaboration with the Stanford Digital Economy Lab (“Stanford Lab”).This was way above the consensus forecast of 160,000. The BLS report will be released Friday, and the consensus is for 180 thousand non-farm payroll jobs added in May.
...
“This is the second month we've seen a full percentage point decline in pay growth for job changers,” said Nela Richardson, chief economist, ADP. “Pay growth is slowing substantially, and wage-driven inflation may be less of a concern for the economy despite robust hiring.”
emphasis added
Wednesday, May 31, 2023
Thursday: ADP Employment, Unemployment Claims, ISM Mfg, Construction Spending, Vehicle Sales
by Calculated Risk on 5/31/2023 09:00:00 PM
 Note: Mortgage rates are from MortgageNewsDaily.com and are for top tier scenarios.
Thursday:
• At 8:15 AM ET, The ADP Employment Report for May. This report is for private payrolls only (no government). The consensus is for 160,000 payroll jobs added in May, down from 296,000 in April.
• At 8:30 AM, The initial weekly unemployment claims report will be released. The consensus is for 234 thousand initial claims, up from 229 thousand last week.
• At 10:00 AM, ISM Manufacturing Index for May. The consensus is for the ISM to be at 47.0, down from 47.1 in April.
• Also, at 10:00 AM, Construction Spending for April. The consensus is for a 0.2% increase in construction spending.
• All day, Light vehicle sales for May. The consensus is for light vehicle sales to be 14.5 million SAAR in May, up from 14.3 million in April (Seasonally Adjusted Annual Rate).
Freddie Mac House Price Index Increased Slightly in April; Up 0.3% Year-over-year
by Calculated Risk on 5/31/2023 07:43:00 PM
Today, in the Calculated Risk Real Estate Newsletter: Freddie Mac House Price Index Increased Slightly in April; Up 0.3% Year-over-year
A brief excerpt:
Freddie Mac reported that its “National” Home Price Index (FMHPI) increased 0.3% month-over-month on a seasonally adjusted (SA) basis in April, putting the National FMHPI down 0.9% SA from its June 2022 peak, and down 1.2% Not Seasonally Adjusted (NSA) from the peak.There is much more in the article. You can subscribe at https://calculatedrisk.substack.com/
On a year-over-year basis, the National FMHPI was up 0.3% in April, from up 1.2% YoY in March. The YoY increase peaked at 19.2% in July 2021. ...
In April, 22 states and D.C. were below their 2022 peaks, Seasonally Adjusted. The largest seasonally adjusted declines from the recent peak were in Nevada (-7.6%), Idaho (-7.2%), Utah (-6.2%), Arizona (-6.0%), Washington (-5.9%), D.C. (-5.5%), California (-5.3%), and Wyoming (-5.0%).
For cities (Core-based Statistical Areas, CBSA), here are the 30 cities with the largest declines from the peak, seasonally adjusted.

Las Vegas April 2023: Visitor Traffic Down 4% Compared to 2019; Convention Traffic Down 30%
by Calculated Risk on 5/31/2023 04:54:00 PM
Note: I like using Las Vegas as a measure of recovery for both leisure (visitors) and business (conventions).
From the Las Vegas Visitor Authority: April 2023 Las Vegas Visitor Statistics
Las Vegas hosted approximately 3,385,500 visitors in Apr 2023, on par with the robust volumes achieved last Apr when pent‐up demand overtook receding pandemic impacts.
Overall hotel occupancy reached 84.3% for the month, similar to last Apr (+0.3 pts YoY). As Weekend occupancy (92.4%) saw a ‐0.8 pts YoY decline, Midweek occupancy approached 81%, surpassing last Apr by 1.5 pts.
Overall ADR reached $171, down 3.3% from Apr 2022 while RevPAR exceeded $144, ‐3.0% YoY.
 Click on graph for larger image.
 The first graph shows visitor traffic for 2019 (Black), 2020 (light blue), 2021 (purple), 2022 (orange), and 2023 (red).
Visitor traffic was down 4.4% compared to the same month in 2019.
Visitor traffic was up 0.1% compared to last April.
The second graph shows convention traffic.
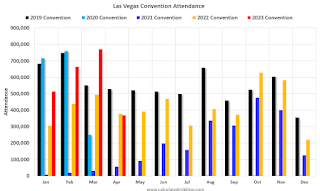
Convention traffic was down 30.2% compared to April 2019, and down 2.1% compared to April 2022.The second graph shows convention traffic.

Note: There was almost no convention traffic from April 2020 through May 2021.
Fed's Beige Book: "Economic activity was little changed ... Residential real estate activity picked up"
by Calculated Risk on 5/31/2023 02:06:00 PM
Fed's Beige Book "This report was prepared at the Federal Reserve Bank of Chicago based on information collected on or before May 22, 2023."
Economic activity was little changed overall in April and early May. Four Districts reported small increases in activity, six no change, and two slight to moderate declines. Expectations for future growth deteriorated a little, though contacts still largely expected a further expansion in activity. Consumer expenditures were steady or higher in most Districts, with many noting growth in spending on leisure and hospitality. Education and healthcare organizations saw steady activity on balance. Manufacturing activity was flat to up in most Districts, and supply chain issues continued to improve. Demand for transportation services was down, especially in trucking, where contacts reported there was a "freight recession." Residential real estate activity picked up in most Districts despite continued low inventories of homes for sale. Commercial construction and real estate activity decreased overall, with the office segment continuing to be a weak spot. Outlooks for farm income fell in most districts, and energy activity was flat to down amidst lower natural gas prices. Financial conditions were stable or somewhat tighter in most Districts. Contacts in several Districts noted a rise in consumer loan delinquencies, which were returning closer to pre-pandemic levels. High inflation and the end of Covid-19 benefits continued to stress the budgets of low- and moderate-income households, driving increased demand for social services, including food and housing.
Employment increased in most Districts, though at a slower pace than in previous reports. Overall, the labor market continued to be strong, with contacts reporting difficulty finding workers across a wide range of skill levels and industries. That said, contacts across Districts also noted that the labor market had cooled some, highlighting easier hiring in construction, transportation, and finance. Many contacts said they were fully staffed, and some reported they were pausing hiring or reducing headcounts due to weaker actual or prospective demand or to greater uncertainty about the economic outlook. Staffing firms reported slower growth in demand. As in the last report, wages grew modestly.
emphasis added
BLS: Job Openings Increased to 10.1 million in April
by Calculated Risk on 5/31/2023 10:05:00 AM
From the BLS: Job Openings and Labor Turnover Summary
The number of job openings edged up to 10.1 million on the last business day of April, the U.S. Bureau of Labor Statistics reported today. Over the month, the number of hires changed little at 6.1 million. Total separations decreased to 5.7 million. Within separations, quits (3.8 million) changed little, while layoffs and discharges (1.6 million) decreased.The following graph shows job openings (black line), hires (dark blue), Layoff, Discharges and other (red column), and Quits (light blue column) from the JOLTS.
emphasis added
This series started in December 2000.
Note: The difference between JOLTS hires and separations is similar to the CES (payroll survey) net jobs headline numbers. This report is for April the employment report this Friday will be for May.
 Click on graph for larger image.
Note that hires (dark blue) and total separations (red and light blue columns stacked) are usually pretty close each month. This is a measure of labor market turnover. When the blue line is above the two stacked columns, the economy is adding net jobs - when it is below the columns, the economy is losing jobs.
The spike in layoffs and discharges in March 2020 is labeled, but off the chart to better show the usual data.
Jobs openings increased in April to 10.1 million from 9.7 million in March.
The number of job openings (black) were down 14% year-over-year.
Quits were down 16% year-over-year. These are voluntary separations. (See light blue columns at bottom of graph for trend for "quits").
Lawler: Census Finally Releases 2020 Census Demographic Profile and Demographic and Housing Characteristics File
by Calculated Risk on 5/31/2023 08:32:00 AM
Today, in the Calculated Risk Real Estate Newsletter: Lawler: Census Finally Releases 2020 Census Demographic Profile and Demographic and Housing Characteristics File
Excerpt:
From housing economist Tom Lawler:
After an unusually long delay related to the challenges associated with conducting a Census during a nationwide pandemic, last week Census finally released the 2020 Census Demographic Profile and Demographic and Housing Characteristics File. ... The table below focuses on housing/household related data.
In a report later this week I will discuss some of the issues associated with the Census population numbers with respect to age distribution and discuss how that impacts folks trying to project the population by age.

There is much more in the article. You can subscribe at https://calculatedrisk.substack.com/
MBA: Mortgage Applications Decreased in Weekly Survey
by Calculated Risk on 5/31/2023 07:00:00 AM
From the MBA: Mortgage Applications Decrease in Latest MBA Weekly Survey
Mortgage applications decreased 3.7 percent from one week earlier, according to data from the Mortgage Bankers Association’s (MBA) Weekly Mortgage Applications Survey for the week ending May 26, 2023.
The Market Composite Index, a measure of mortgage loan application volume, decreased 3.7 percent on a seasonally adjusted basis from one week earlier. On an unadjusted basis, the Index decreased 5 percent compared with the previous week. The Refinance Index decreased 7 percent from the previous week and was 45 percent lower than the same week one year ago. The seasonally adjusted Purchase Index decreased 3 percent from one week earlier. The unadjusted Purchase Index decreased 4 percent compared with the previous week and was 31 percent lower than the same week one year ago.
“Inflation is still running too high, and recent economic data is beginning to convince investors that the Federal Reserve will not be cutting rates anytime soon. Mortgage rates for conforming balance 30-year loans were being quoted above 7 percent by some lenders last week, and the weekly average at 6.9 percent reached the highest level since last November,” said Mike Fratantoni, MBA’s SVP and Chief Economist. “Application volumes for both purchase and refinance loans decreased last week due to these higher rates. While refinance demand is almost entirely driven by the level of rates, purchase volume continues to be constrained by the lack of homes on the market.”
...
The average contract interest rate for 30-year fixed-rate mortgages with conforming loan balances ($726,200 or less) increased to 6.91 percent from 6.69 percent, with points increasing to 0.83 from 0.66 (including the origination fee) for 80 percent loan-to-value ratio (LTV) loans. The effective rate increased from last week.
emphasis added
 Click on graph for larger image.
The first graph shows the MBA mortgage purchase index.
According to the MBA, purchase activity is down 31% year-over-year unadjusted.
Red is a four-week average (blue is weekly). This is close to the lowest level since the mid 1990s.

The second graph shows the refinance index since 1990.
With higher mortgage rates, the refinance index declined sharply in 2022 - and has mostly flat lined at a low level since then.
Tuesday, May 30, 2023
Wednesday: Job Openings, Chicago PMI, Fed's Beige Book
by Calculated Risk on 5/30/2023 08:47:00 PM
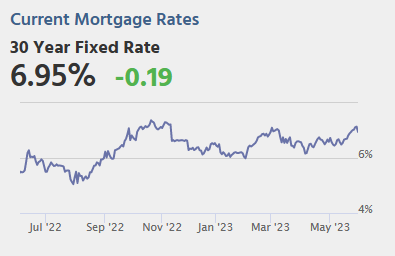 From Matthew Graham at Mortgage News Daily: Rates Drop Sharply to Start The New Week
The past 2 weeks were fairly rough for fans of low mortgage rates. The average lender moved higher at the fastest pace since February over that time. By the end of last week, the average lender was back above 7% for a top tier 30yr fixed scenario (and "well above" on Friday).Wednesday:
What a difference a weekend makes. While we're nowhere near the lower levels seen several weeks ago, the bond market (which underlies rates) was able to recover all of the losses seen on Thursday and Friday as well as a small portion of Wednesday's to boot. [30 year fixed 6.96%]
emphasis added
• At 7:00 AM ET, The Mortgage Bankers Association (MBA) will release the results for the mortgage purchase applications index.
• At 9:45 AM, Chicago Purchasing Managers Index for May.
• At 10:00 AM, Job Openings and Labor Turnover Survey for April from the BLS.
• At 2:00 PM, the Federal Reserve Beige Book, an informal review by the Federal Reserve Banks of current economic conditions in their Districts.


