 RSS Feed
 by Calculated Risk on 5/24/2023 02:13:00 PM
Wednesday, May 24, 2023
FOMC Minutes: Staff Predicts Recession Starting in Q4; Future Monetary Policy "less certain"
From the Fed: Minutes of the Federal Open Market Committee, May 2-3, 2023. Excerpt:
The economic forecast prepared by the staff for the May FOMC meeting continued to assume that the effects of the expected further tightening in bank credit conditions, amid already tight financial conditions, would lead to a mild recession starting later this year, followed by a moderately paced recovery. Real GDP was projected to decelerate over the next two quarters before declining modestly in both the fourth quarter of this year and the first quarter of next year. Real GDP growth over 2024 and 2025 was projected to be below the staff's estimate of potential output growth. The unemployment rate was forecast to increase this year, to peak next year, and then to start declining gradually in 2025.
...
In discussing the policy outlook, participants generally agreed that in light of the lagged effects of cumulative tightening in monetary policy and the potential effects on the economy of a further tightening in credit conditions, the extent to which additional increases in the target range may be appropriate after this meeting had become less certain. Participants agreed that it would be important to closely monitor incoming information and assess the implications for monetary policy. In determining the extent to which additional policy firming may be appropriate to return inflation to 2 percent over time, various participants noted specific factors that should bear on future decisions on policy actions. One such factor was the degree and timing with which cumulative policy tightening restrained economic activity and reduced inflation, with some participants commenting that they saw evidence that the past years' tightening was beginning to have its intended effect. Another factor was the degree to which tighter credit conditions for households and businesses resulting from events in the banking sector would weigh on activity and reduce inflation, which participants agreed was very uncertain. Additional factors included the progress toward returning inflation to the Committee's longer-run goal of 2 percent, and the pace at which labor market conditions softened and economic growth slowed.
emphasis added
AIA: Architecture Billings Decreased in April
by Calculated Risk on 5/24/2023 12:38:00 PM
Note: This index is a leading indicator primarily for new Commercial Real Estate (CRE) investment.
From the AIA: AIA/Deltek Architecture Billings Index Reflects Continued Weakness in Business Conditions in April
Architecture firms reported a modest decrease in April billings. However, there was a slight increase in inquiries into future project activity according to a report released today from The American Institute of Architects (AIA).
The billings score for March decreased from 50.4 in March to 48.5 in April (any score below 50 indicates a decrease in firm billings). However, firms reported that inquiries into new projects accelerated slightly to 53.9, while most firms continued to report a decline in the value of new design contracts, with a score of 49.8.
“The ongoing weakness in design activity at architecture firms reflects clients’ concerns regarding the economic outlook,” said AIA Chief Economist Kermit Baker Hon. AIA, Ph.D. “High construction costs, extended project schedules, elevated interest rates, and growing difficulty in obtaining financing are all weighing on the construction market.”
...
• Regional averages: Midwest (51.2); West (49.3); South (48.7); Northeast (47.2)
• Sector index breakdown: mixed practice (firms that do not have at least half of their billings in any one other category) (52.1); commercial/industrial (51.8); institutional (50.6); multi-family residential (41.5)
emphasis added
 Click on graph for larger image.
This graph shows the Architecture Billings Index since 1996. The index was at 48.5 in April, down from 50.4 in March. Anything below 50 indicates a decrease in demand for architects' services.
Note: This includes commercial and industrial facilities like hotels and office buildings, multi-family residential, as well as schools, hospitals and other institutions.
This index has declined in 6 of the last 7 months. This index usually leads CRE investment by 9 to 12 months, so this index suggests a slowdown in CRE investment later in 2023 and into 2024.
Note that multi-family billing turned down in July 2022 and has been negative for TEN consecutive months. At 41.5, this was the weakest reading for multi-family since the start of the pandemic in March and April 2020. This suggests we will see a downturn in multi-family starts this year.
Two Key Housing Themes: Low Inventory and Few Distressed Sales
by Calculated Risk on 5/24/2023 09:43:00 AM
Today, in the Calculated Risk Real Estate Newsletter: Two Key Housing Themes: Low Inventory and Few Distressed Sales
Brief excerpt:
Every housing cycle is different. One of the key themes in this cycle is that existing home inventory is historically extremely low as many homeowners are “locked in” to their current home with low mortgage rates.You can subscribe at https://calculatedrisk.substack.com/.
Another key theme is that there will be few distressed sales as most homeowners have substantial equity.
Here is some data on outstanding mortgage rates and current loan-to-values.
Here is some data from the FHFA’s National Mortgage Database showing the distribution of interest rates on closed-end, fixed-rate 1-4 family mortgages outstanding at the end of each quarter since Q1 2013 through Q4 2022.
This shows the recent surge in the percent of loans under 3%, and also under 4%, starting in early 2020 as mortgage rates declined sharply during the pandemic. The percent of outstanding loans under 4% peaked in Q1 2022 at 65.4%, and the percent under 5% peaked at 85.8%. These low existing mortgage rates makes it difficult for homeowners to sell their homes and buy a new home since their monthly payments would increase sharply. This is a key reason existing home inventory levels are very low.

MBA: Mortgage Applications Decreased in Weekly Survey
by Calculated Risk on 5/24/2023 07:00:00 AM
From the MBA: Mortgage Applications Decrease in Latest MBA Weekly Survey
Mortgage applications decreased 4.6 percent from one week earlier, according to data from the Mortgage Bankers Association’s (MBA) Weekly Mortgage Applications Survey for the week ending May 19, 2023.
The Market Composite Index, a measure of mortgage loan application volume, decreased 4.6 percent on a seasonally adjusted basis from one week earlier. On an unadjusted basis, the Index decreased 5 percent compared with the previous week. The Refinance Index decreased 5 percent from the previous week and was 44 percent lower than the same week one year ago. The seasonally adjusted Purchase Index decreased 4 percent from one week earlier. The unadjusted Purchase Index decreased 5 percent compared with the previous week and was 30 percent lower than the same week one year ago.
“Mortgage applications declined almost five percent last week as borrowers remained sensitive to higher rates. The 30-year fixed rate increased to 6.69 percent, the highest level since March,” said Joel Kan, MBA’s Vice President and Deputy Chief Economist. Since rates have been so volatile and for-sale inventory still scarce, we have yet to see sustained growth in purchase applications. Refinance activity remains limited, with the refinance index falling to its lowest level in two months and more than 40 percent below last year’s pace.”
Added Kan, “Investors remained attuned to the uncertainty around the U.S. debt ceiling and communication from several Federal Reserve officials last week, which sent Treasury yields higher, along with mortgage rates. Economic data released over the past week have also pointed to a still-resilient economy. The housing market received positive data on new residential construction – which is seen as a key solution to the lack of housing inventory.”
...
The average contract interest rate for 30-year fixed-rate mortgages with conforming loan balances ($726,200 or less) increased to 6.69 percent from 6.57 percent, with points increasing to 0.66 from 0.61 (including the origination fee) for 80 percent loan-to-value ratio (LTV) loans.
emphasis added
 Click on graph for larger image.
The first graph shows the MBA mortgage purchase index.
According to the MBA, purchase activity is down 30% year-over-year unadjusted.
Red is a four-week average (blue is weekly).

The second graph shows the refinance index since 1990.
With higher mortgage rates, the refinance index declined sharply in 2022 - and has mostly flat lined at a low level since then.
Tuesday, May 23, 2023
Wednesday: FOMC Minutes
by Calculated Risk on 5/23/2023 09:09:00 PM
 Note: Mortgage rates are from MortgageNewsDaily.com and are for top tier scenarios.
Wednesday:
• At 7:00 AM ET, The Mortgage Bankers Association (MBA) will release the results for the mortgage purchase applications index.
• During the day: The AIA's Architecture Billings Index for April (a leading indicator for commercial real estate).
• At 2:00 PM: FOMC Minutes, Minutes Meeting of May 2-3, 2023
"Mortgage Rates Move Back Above 7%"
by Calculated Risk on 5/23/2023 05:18:00 PM
From Matthew Graham at MortgageNewsDaily: Mortgage Rates Move Back Above 7%
Today's headline is the most dramatic part of today's story on mortgage rates. The average top tier 30yr fixed rate has been mostly operating in a 6-7% range since September 2022. There were several weeks in the low to mid 7s in Oct/Nov and a few days in early March.
...
Rates were already quite close to 7% yesterday and today merely provided a gentle nudge. Interestingly enough, the underlying bond market currently suggests lenders would be able to drop back below 7% tomorrow, but only if current trading levels hold until then (they almost never do).
 Click on graph for larger image.
This is a graph from Mortgage News Daily (MND) showing 30-year fixed rates from three sources (MND, MBA, Freddie Mac) over the last 5 years.
The 30-year fixed rate for top tier scenarios was 7.01% today, up from the recent low of 6.18% on April 6th.
The cycle high was 7.37% for this series in October 2022.
Go to MND and you can adjust the graph for different time periods.
New Home Sales at 683,000 Annual Rate in April; Median New Home Price is Down 15.3% from the Peak
by Calculated Risk on 5/23/2023 10:57:00 AM
Today, in the Calculated Risk Real Estate Newsletter: New Home Sales at 683,000 Annual Rate in April
Brief excerpt:
The next graph shows new home sales for 2022 and 2023 by month (Seasonally Adjusted Annual Rate). Sales in April 2023 were up 11.8% from April 2022.You can subscribe at https://calculatedrisk.substack.com/.
As expected, new home sales were up year-over-year.
...
As previously discussed, the Census Bureau overestimates sales, and underestimates inventory when cancellation rates are rising, see: New Home Sales and Cancellations: Net vs Gross Sales. This has reversed now since cancellation rates have started to decline. When a previously cancelled home is resold, the home builder counts it as a sale, but the Census Bureau does not (since it was already counted).
There are still a large number of homes under construction, and this suggests we might see a further increase in completed inventory over the next several months, but in general, this is a positive report for new home sales.

New Home Sales at 683,000 Annual Rate in April
by Calculated Risk on 5/23/2023 10:06:00 AM
The Census Bureau reports New Home Sales in April were at a seasonally adjusted annual rate (SAAR) of 683 thousand.
The previous three months were revised down, combined.
Sales of new single‐family houses in April 2023 were at a seasonally adjusted annual rate of 683,000, according to estimates released jointly today by the U.S. Census Bureau and the Department of Housing and Urban Development. This is 4.1 percent above the revised March rate of 656,000 and is 11.8 percent above the April 2022 estimate of 611,000.
emphasis added
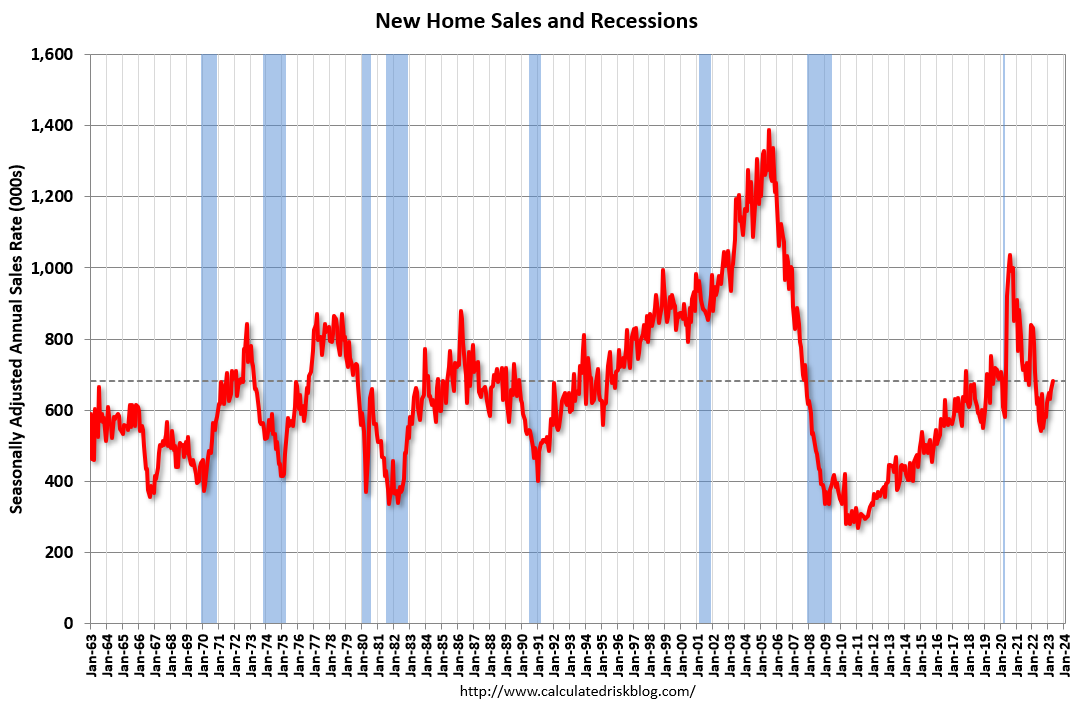 Click on graph for larger image.
The first graph shows New Home Sales vs. recessions since 1963. The dashed line is the current sales rate.
New home sales are close to pre-pandemic levels.
The second graph shows New Home Months of Supply.
 The months of supply decreased in April to 7.6 months from 7.9 months in March.
 The all-time record high was 12.2 months of supply in January 2009. The all-time record low was 3.3 months in August 2020.
This is well above the top of the normal range (about 4 to 6 months of supply is normal).
"The seasonally‐adjusted estimate of new houses for sale at the end of April was 433,000. This represents a supply of 7.6 months at the current sales rate."Sales were above expectations of 660 thousand SAAR, however, sales in the three previous months were revised down, combined. I'll have more later today.
Monday, May 22, 2023
Tuesday: New Home Sales
by Calculated Risk on 5/22/2023 08:18:00 PM
 From Matthew Graham at Mortgage News Daily: Mortgage Rates Approaching 7% Again
[M]ost of the past week saw the average top tier rate at 6.625% or higher for the average lender. And as of today, we're painfully close to 7.0% again. To be fair, we were already close to 7.0% on Friday. Most lenders didn't move much higher since then, and many lenders were already there. ... What's behind the spike? In general, the market is coming to terms with the possibility that the Federal Reserve may not have been that off-base over the past few months as it has maintained the need to keep rates "higher for longer." [30 year fixed 6.67%]Tuesday:
emphasis added
• At 10:00 AM ET, New Home Sales for April from the Census Bureau. The consensus is for 660 thousand SAAR, down from 683 thousand SAAR in March.
• Also at 10:00 AM, Richmond Fed Survey of Manufacturing Activity for May.
Final Look at Local Housing Markets in April
by Calculated Risk on 5/22/2023 11:56:00 AM
Today, in the Calculated Risk Real Estate Newsletter: Final Look at Local Housing Markets in April
A brief excerpt:
California Home Sales Down 36.1% YoY in April, Median Prices Decline 7.8% YoYThere is much more in the article. You can subscribe at https://calculatedrisk.substack.com/
Here is the press release from the California Association of Realtors® (C.A.R.): Higher mortgage rates and low housing inventory restrain California home sales in April, C.A.R. reports• Existing, single-family home sales totaled 267,880 in April on a seasonally adjusted annualized rate, down 4.7 percent from March and down 36.1 percent from April 2022.And a table of April sales.
• April’s statewide median home price was $815,340, up 3.0 percent from March and down 7.8 percent from April 2022. ...
In April, sales in these markets were down 26.1%. In March, these same markets were down 20.5% YoY Not Seasonally Adjusted (NSA).
This was a larger YoY decline NSA in April than in March for these markets, however there was one less selling day in April this year.
...
My early expectation is we will see a somewhat similar level of sales in May as in April. 30-year mortgage rates averaged about 6.4% in February and March (for closed sales in April), and 30-year rates averaged 6.44% in March and April (about the same).
...
More local data coming in June for activity in May!


