 RSS Feed
 by Calculated Risk on 3/09/2023 02:29:00 PM
Thursday, March 09, 2023
"Home ATM" is Closing; Mortgage Equity Withdrawal (MEW) Declines in Q4
Today, in the Real Estate Newsletter: "Home ATM" is Closing
Excerpt:
Here is the quarterly increase in mortgage debt from the Federal Reserve’s Financial Accounts of the United States - Z.1 (sometimes called the Flow of Funds report) released today. In the mid ‘00s, there was a large increase in mortgage debt associated with the housing bubble.There is much more in the article. You can subscribe at https://calculatedrisk.substack.com/ (All ad free).
In Q4 2022, mortgage debt increased $155 billion, down from $210 billion in Q3, and down from the cycle peak of $258 billion in Q2 2022. Note the almost 7 years of declining mortgage debt as distressed sales (foreclosures and short sales) wiped out a significant amount of debt.
However, some of this debt is being used to increase the housing stock (purchase new homes), so this isn’t all Mortgage Equity Withdrawal (MEW).
...
The bottom line is, the “Home ATM” is now closing with refinance activity off sharply and HELOC borrowing declining.

Fed's Flow of Funds: Household Net Worth Increased $2.9 Trillion in Q4
by Calculated Risk on 3/09/2023 01:52:00 PM
The Federal Reserve released the Q4 2022 Flow of Funds report today: Financial Accounts of the United States.
The net worth of households and nonprofits rose to $147.7 trillion during the fourth quarter of 2022. The value of directly and indirectly held corporate equities increased $2.7 trillion and the value of real estate decreased $0.1 trillion.
...
Household debt increased 2.3 percent at an annual rate in the fourth quarter of 2022. Consumer credit grew at an annual rate of 7 percent, while mortgage debt (excluding charge-offs) grew at an annual rate of 4.4 percent.
 Click on graph for larger image.
The first graph shows Households and Nonprofit net worth as a percent of GDP.
Net worth as a percent of GDP is down $4.2 trillion from the all-time high in Q1 2022.
This includes real estate and financial assets (stocks, bonds, pension reserves, deposits, etc) net of liabilities (mostly mortgages). Note that this does NOT include public debt obligations.
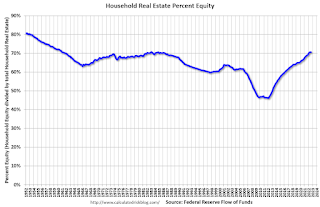 The second graph shows homeowner percent equity since 1952.
Household percent equity (as measured by the Fed) collapsed when house prices fell sharply in 2007 and 2008.
In Q4 2022, household percent equity (of household real estate) was at 71.2% - down slightly from 71.6% in Q3, 2022. This is close to the highest percent equity since the early 1980s.
Note: This includes households with no mortgage debt.
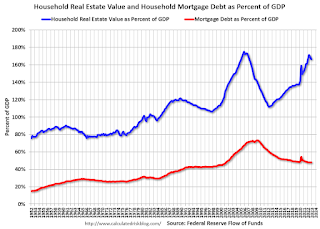 The third graph shows household real estate assets and mortgage debt as a percent of GDP. Note this graph was impacted by the sharp decline in Q2 2020 GDP.
Mortgage debt increased by $155 billion in Q4.
Mortgage debt is up $1.82 trillion from the peak during the housing bubble, but, as a percent of GDP is at 47.9% - down from Q3 - and down from a peak of 73.3% of GDP during the housing bust.
The value of real estate, as a percent of GDP, decreased in Q4 - after peaking in Q2 2022 - and is well above the average of the last 30 years.
 The second graph shows homeowner percent equity since 1952.
 Household percent equity (as measured by the Fed) collapsed when house prices fell sharply in 2007 and 2008.
In Q4 2022, household percent equity (of household real estate) was at 71.2% - down slightly from 71.6% in Q3, 2022. This is close to the highest percent equity since the early 1980s.
Note: This includes households with no mortgage debt.
 The third graph shows household real estate assets and mortgage debt as a percent of GDP. Note this graph was impacted by the sharp decline in Q2 2020 GDP.
Mortgage debt increased by $155 billion in Q4.
Mortgage debt is up $1.82 trillion from the peak during the housing bubble, but, as a percent of GDP is at 47.9% - down from Q3 - and down from a peak of 73.3% of GDP during the housing bust.
The value of real estate, as a percent of GDP, decreased in Q4 - after peaking in Q2 2022 - and is well above the average of the last 30 years.
Realtor.com Reports Weekly Active Inventory Up 61% YoY; New Listings Down 26% YoY
by Calculated Risk on 3/09/2023 11:26:00 AM
Realtor.com has monthly and weekly data on the existing home market. Here is their weekly report released today from Chief economist Danielle Hale: Weekly Housing Trends View — Data Week Ending Mar 4, 2023
• Active inventory growth continued to climb with for-sale homes up 61% above one year ago. Inventories of for-sale homes rose again, but the gain was the lowest we’ve seen since December. With new listings lagging behind year-ago pace, the growing number of homes for sale reflects longer time on market rather than an influx of sellers.
...
• New listings–a measure of sellers putting homes up for sale–were again down, this week by 26% from one year ago. For 35 weeks now, fewer homeowners put their homes on the market for sale than at this time one year ago. Until this week, the gap was slightly smaller than we saw in the last quarter of 2022. In February, attitudes toward housing worsened among both potential buyers and potential sellers as mortgage rates began to climb again and respondents reported lower job security. These attitudes could mean ongoing weakness in the number of homeowners deciding to sell.
 Here is a graph of the year-over-year change in inventory according to realtor.com.
 Inventory is still up sharply year-over-year; however, the YoY increase has slowed recently.
February Employment Preview
by Calculated Risk on 3/09/2023 11:15:00 AM
On Friday at 8:30 AM ET, the BLS will release the employment report for February. The consensus is for 200,000 jobs added, and for the unemployment rate to be unchanged at 3.4%.
From BofA economists:
"[W]e expect nonfarm payroll growth moderated to 230k, reversing much of the acceleration seen in January. This should still be enough to put downward pressure on the unemployment rate since we expect the labor force participation rate to be unchanged at 62.4%. As a result, we look for the unemployment rate to remain unchanged at 3.4%, but there is a meaningful risk that it rounds down to 3.3%."From Goldman Sachs:
"We left our nonfarm payroll forecast unchanged at +250k (mom sa)."
 Click on graph for larger image.
• First, as of January there were 2.70 million more jobs than in February 2020 (the month before the pandemic).
This graph shows the job losses from the start of the employment recession, in percentage terms. As of June 2022, the total number of jobs had exceeded pre-pandemic levels.
• ADP Report: The ADP employment report showed 242,000 private sector jobs were added in February. This suggests job gains slightly above consensus expectations, however, in general, ADP hasn't been very useful in forecasting the BLS report.
• ISM Surveys: Note that the ISM services are diffusion indexes based on the number of firms hiring (not the number of hires). The ISM® manufacturing employment index decreased in February to 49.1%, down from 50.6% last month. This would suggest 25,000 jobs lost in manufacturing. The ADP report indicated 43,000 manufacturing jobs added in February.
The ISM® services employment index increased in February to 54.0%, from 50.0% last month. This would suggest service employment increased 180,000 in February.
Combined, the ISM surveys suggest 155,000 jobs added in February (below the consensus forecast).
• Unemployment Claims: The weekly claims report showed no change in the number of initial unemployment claims during the reference week (includes the 12th of the month) from 192,000 in January to 192,000 in February. This would usually a similar number of layoffs in February as in January. In general, weekly claims were below expectations in February.
• COVID: As far as the pandemic, the number of weekly cases during the reference week in January was around 262,000, down from 317,000 in January.
• Weather: In January, the San Francisco Fed estimated that weather adjusted employment gains added 125 thousand to the employment report, and there should be some payback in February.
• Other Factors: The settlement of a labor dispute at the University of California boosted payrolls by about 40 thousand in January. Seasonal factors could also impact this report. In February 2022, the consensus was for 400 thousand jobs added, and the BLS reported 678 thousand jobs gained (since revised up to 904 thousand). And in February 2021, the consensus was for 148 thousand jobs added, and the BLS reported 379 thousand jobs added (since revised up to 575 thousand). Although the consensus has been way too low in February for the last two years, the new seasonal adjustments might negatively impact job gains in the February 2023 report.
• Conclusion: Accounting for weather and the end of the labor dispute, January employment gains were around 350 thousand - close to the gains for the previous 5 months. Reversing the January special factors, my guess is the employment report will be close to the consensus forecast.
Weekly Initial Unemployment Claims increase to 211,000
by Calculated Risk on 3/09/2023 08:33:00 AM
The DOL reported:
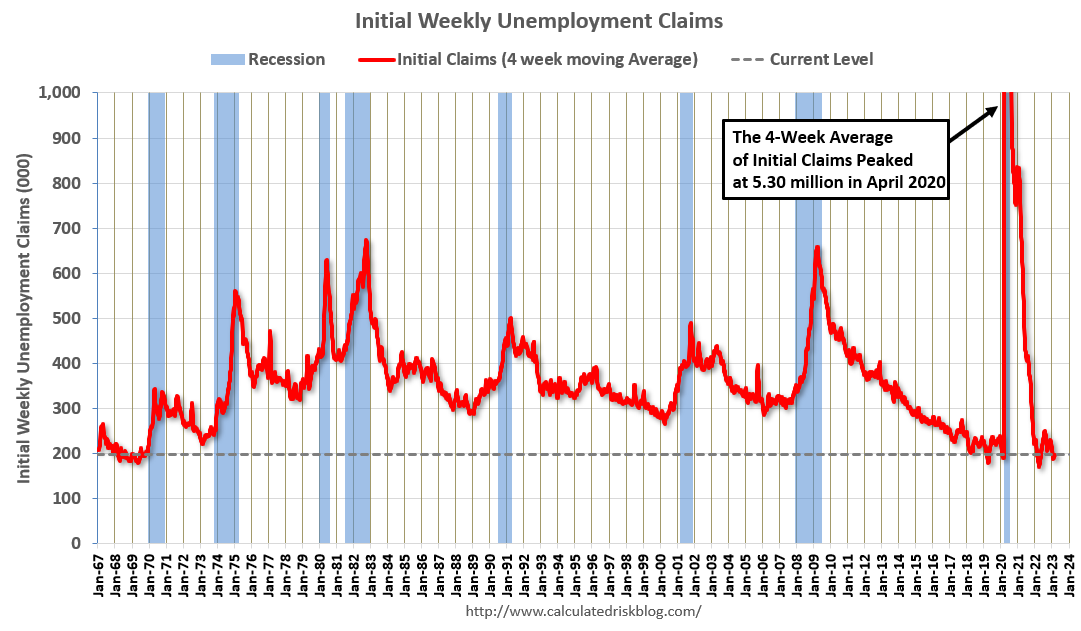
In the week ending March 4, the advance figure for seasonally adjusted initial claims was 211,000, an increase of 21,000 from the previous week's unrevised level of 190,000. The 4-week moving average was 197,000, an increase of 4,000 from the previous week's unrevised average of 193,000.The following graph shows the 4-week moving average of weekly claims since 1971.
emphasis added
 Click on graph for larger image.
The dashed line on the graph is the current 4-week average. The four-week average of weekly unemployment claims increased to 197,000.
The previous week was unrevised.
Weekly claims were above the consensus forecast.
Wednesday, March 08, 2023
Thursday: Unemployment Claims, Q4 Flow of Funds
by Calculated Risk on 3/08/2023 08:30:00 PM
 Note: Mortgage rates are from MortgageNewsDaily.com and are for top tier scenarios.
Thursday:
• At 8:30 AM ET, The initial weekly unemployment claims report will be released. The consensus is for 195 thousand initial claims, up from 190 thousand last week.
• At 12:00 PM, Q4 Flow of Funds Accounts of the United States from the Federal Reserve.
Fed's Beige Book: "Leasing rates for multifamily were starting to decrease"
by Calculated Risk on 3/08/2023 02:16:00 PM
Fed's Beige Book "This report was prepared at the Federal Reserve Bank of New York based on information collected on or before February 27, 2023. "
Overall economic activity increased slightly in early 2023. Six Districts reported little or no change in economic activity since the last report, while six indicated economic activity expanded at a modest pace. On balance, supply chain disruptions continued to ease. Consumer spending generally held steady, though a few Districts reported moderate to strong growth in retail sales during what is typically a slow period. Auto sales were little changed, on balance, though inventory levels continued to improve. Several Districts indicated that high inflation and higher interest rates continued to reduce consumers' discretionary income and purchasing power, and some concern was expressed about rising credit card debt. Travel and tourism activity remained fairly strong in most Districts. Manufacturing activity stabilized following a period of contraction. While housing markets remained subdued, restrained by exceptionally low inventory, an unexpected uptick in activity beyond the seasonal norm was seen in some Districts along the eastern seaboard. Commercial real estate activity was steady, with some growth in the industrial market but ongoing weakness in the office market. Demand for nonfinancial services was steady overall but picked up in a few Districts. On balance, loan demand declined, credit standards tightened, and delinquency rates edged up. Energy activity was flat to down slightly, and agricultural conditions were mixed. Amid heightened uncertainty, contacts did not expect economic conditions to improve much in the months ahead.And some regional comments on rents:
Labor market conditions remained solid. Employment continued to increase at a modest to moderate pace in most Districts despite hiring freezes by some firms and scattered reports of layoffs. Labor availability improved slightly, though finding workers with desired skills or experience remained challenging. Several Districts indicated that a lack of available childcare continued to impede labor force participation. While labor markets generally remained tight, a few Districts noted that firms are becoming less flexible with employees and beginning to reduce remote work options. Wages generally increased at a moderate pace, though some Districts noted that wage pressures had eased somewhat. Wage increases are expected to moderate further in the coming year.
emphasis added
Richmond: "Leasing rates for multifamily were starting to decrease, particularly for mid-priced units; high end apartment rents were unchanged."
...
Dallas: "Apartment leasing remained sluggish, and occupancy and rents were flat."
1st Look at Local Housing Markets in February
by Calculated Risk on 3/08/2023 12:26:00 PM
Today, in the Calculated Risk Real Estate Newsletter:
1st Look at Local Housing Markets in February
A brief excerpt:
This is the first look at local markets in February. I’m tracking about 40 local housing markets in the US. Some of the 40 markets are states, and some are metropolitan areas. I’ll update these tables throughout the month as additional data is released.There is much more in the article. You can subscribe at https://calculatedrisk.substack.com/
Closed sales in February were mostly for contracts signed in December and January. Since 30-year fixed mortgage rates were over 6% for all of December and January - compared to mid-3% range the previous year - closed sales were down significantly year-over-year in February. However, the impact was probably not as severe as for closed sales in December and January (rates were the highest in October and November 2022 when contracts were signed for closing in December and January.
...
Median sales prices for single family homes were down 5.6% year-over year (YoY) in Las Vegas, down 5.7% YoY in Denver, down 1.1% YoY in San Diego, and down 1.7% YoY in the Northwest (Seattle Area).
...
In February, sales in these markets were down 24.1%. In January, these same markets were down 36.3% YoY Not Seasonally Adjusted (NSA).
This is a smaller YoY decline NSA than in January for these early reporting markets. The early data suggests NAR reported sales will rebound in February. This will still be a significant YoY decline, and the 18th consecutive month with a YoY decline.
...
Many more local markets to come!

Trade Deficit increased to $68.3 Billion in January
by Calculated Risk on 3/08/2023 10:38:00 AM
From the Department of Commerce reported:
The U.S. Census Bureau and the U.S. Bureau of Economic Analysis announced today that the goods and services deficit was $68.3 billion in January, up $1.1 billion from $67.2 billion in December, revised.
January exports were $257.5 billion, $8.5 billion more than December exports. January imports were $325.8 billion, $9.6 billion more than December imports.
emphasis added
 Click on graph for larger image.
Both exports and imports increased in January.
Exports are up 13% year-over-year; imports are up 3% year-over-year.
Both imports and exports decreased sharply due to COVID-19 and then bounced back.
The second graph shows the U.S. trade deficit, with and without petroleum.
 The blue line is the total deficit, and the black line is the petroleum deficit, and the red line is the trade deficit ex-petroleum products.
Note that net, exports of petroleum products are positive.
The trade deficit with China decreased to $25.2 billion in January, from $36.4 billion a year ago.
The trade deficit was close to the consensus forecast.
BLS: Job Openings Decreased to 10.8 million in January
by Calculated Risk on 3/08/2023 10:08:00 AM
From the BLS: Job Openings and Labor Turnover Summary
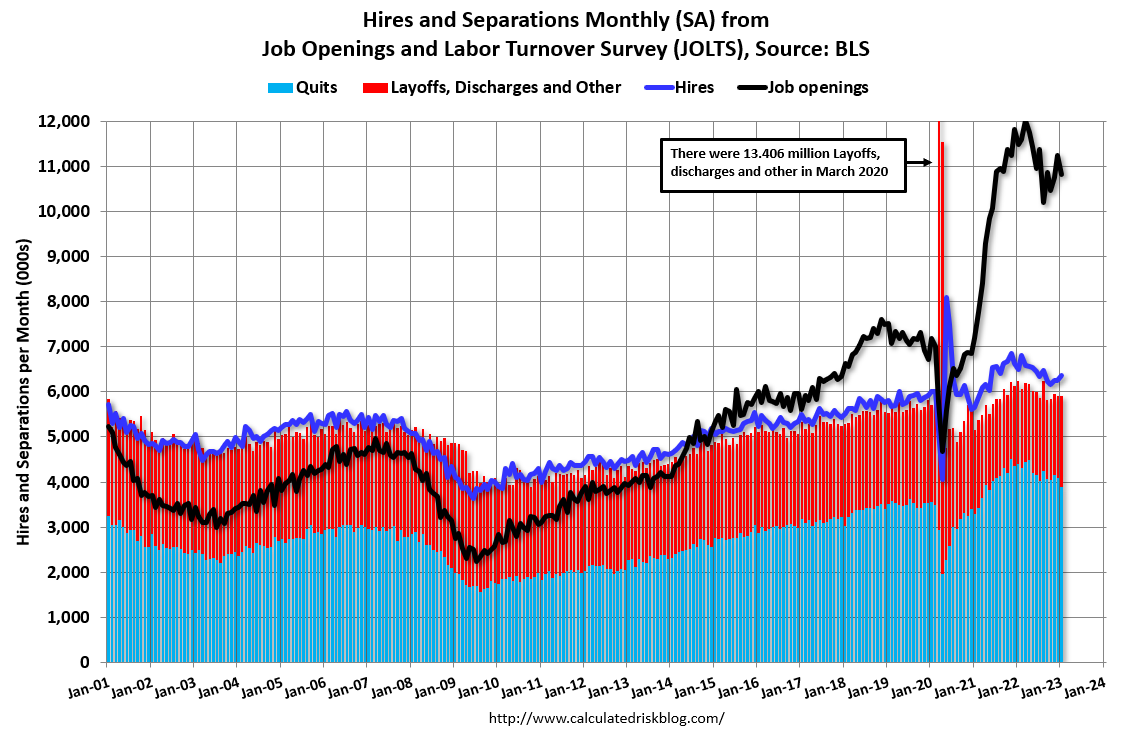
The number of job openings decreased to 10.8 million on the last business day of January, the U.S. Bureau of Labor Statistics reported today. Over the month, the number of hires and total separations changed little at 6.4 million and 5.9 million, respectively. Within separations, quits (3.9 million) decreased, while layoffs and discharges (1.7 million) increased.The following graph shows job openings (black line), hires (dark blue), Layoff, Discharges and other (red column), and Quits (light blue column) from the JOLTS.
emphasis added
This series started in December 2000.
Note: The difference between JOLTS hires and separations is similar to the CES (payroll survey) net jobs headline numbers. This report is for January the employment report this Friday will be for February.
 Click on graph for larger image.
Note that hires (dark blue) and total separations (red and light blue columns stacked) are usually pretty close each month. This is a measure of labor market turnover. When the blue line is above the two stacked columns, the economy is adding net jobs - when it is below the columns, the economy is losing jobs.
The spike in layoffs and discharges in March 2020 is labeled, but off the chart to better show the usual data.
Jobs openings decreased in January to 10.8 million from 11.2 million in December.
The number of job openings (black) were down 6% year-over-year.
Quits were down 12% year-over-year. These are voluntary separations. (See light blue columns at bottom of graph for trend for "quits").


