 RSS Feed
 by Calculated Risk on 1/18/2023 07:00:00 AM
Wednesday, January 18, 2023
MBA: Mortgage Applications Increase in Latest Weekly Survey
From the MBA: Mortgage Applications Increase in Latest MBA Weekly Survey
Mortgage applications increased 27.9 percent from one week earlier, according to data from the Mortgage Bankers Association’s (MBA) Weekly Mortgage Applications Survey for the week ending January 13, 2023.
... The Refinance Index increased 34 percent from the previous week and was 81 percent lower than the same week one year ago. The seasonally adjusted Purchase Index increased 25 percent from one week earlier. The unadjusted Purchase Index increased 32 percent compared with the previous week and was 35 percent lower than the same week one year ago.
“Mortgage application activity rebounded strongly in the first full week of January, with both refinance and purchase activity increasing by double-digit percentages compared to last week, which included the New Year’s holiday observance,” said Mike Fratantoni, MBA’s SVP and Chief Economist. “Despite these gains, refinance activity remains more than 80% below last year’s pace and purchase volume remains 35% below year-ago levels.”
Added Fratantoni, “Mortgage rates are now at their lowest level since September 2022, and about a percentage point below the peak mortgage rate last fall. As we enter the beginning of the spring buying season, lower mortgage rates and more homes on the market will help affordability for first-time homebuyers.”
...
The average contract interest rate for 30-year fixed-rate mortgages with conforming loan balances ($726,200 or less) decreased to 6.23 percent from 6.42 percent, with points decreasing to 0.67 from 0.73 (including the origination fee) for 80 percent loan-to-value ratio (LTV) loans.
emphasis added
 Click on graph for larger image.
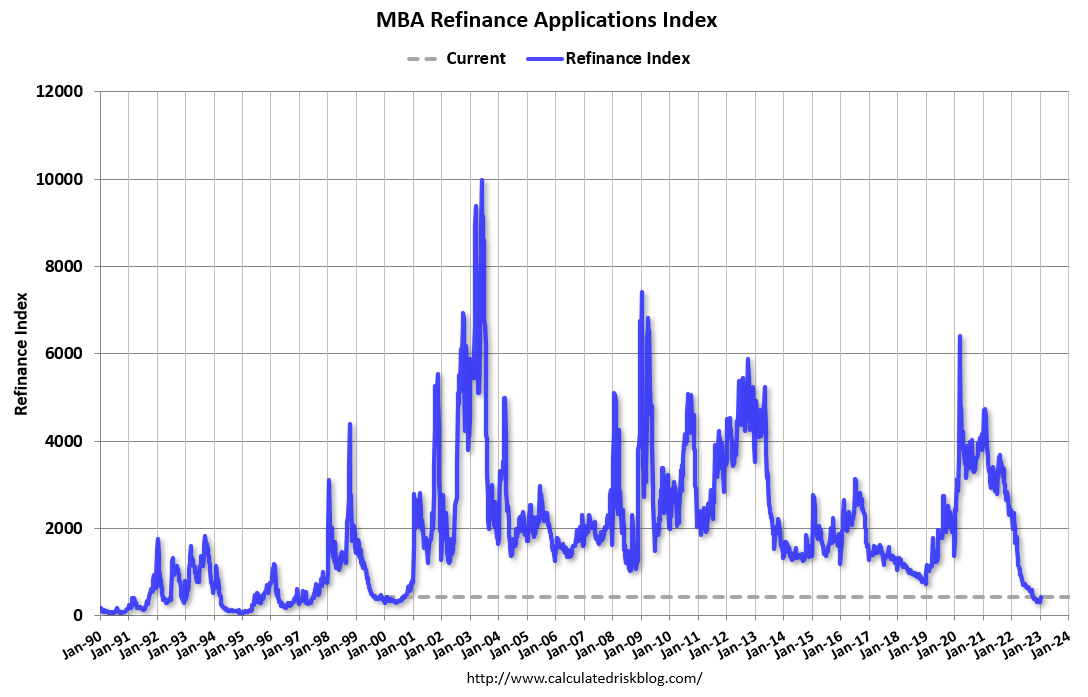
The first graph shows the refinance index since 1990.
With higher mortgage rates, the refinance index declined sharply in 2022.
Two weeks ago, the refinance index was at the lowest level since the year 2000, but it has rebounded a little as rates declined.
The second graph shows the MBA mortgage purchase index.
 According to the MBA, purchase activity is down 35% year-over-year unadjusted.
Note: Red is a four-week average (blue is weekly).
Tuesday, January 17, 2023
Wednesday: Retail Sales, PPI, Industrial Production, Homebuilder Confidence, Fed's Beige Book
by Calculated Risk on 1/17/2023 08:33:00 PM
 From Matthew Graham at Mortgage News Daily: Old Range is New Again as Markets Wait For Mid-Tier Data
By the middle of December, bond yields made a convincing move down from decades-long highs and settled in a sideways range on CPI/Fed week. We re-entered that same sideways range after last week's CPI (3.42-3.62 in 10yr yields), and now wait for a slew of mid-tier reports to see if they're up to the task of informing a new range breakout. [30 year fixed 6.17%]Wednesday:
emphasis added
• At 7:00 AM ET, The Mortgage Bankers Association (MBA) will release the results for the mortgage purchase applications index.
• At 8:30 AM, Retail sales for December is scheduled to be released. The consensus is for a 0.8% decrease in retail sales.
• Also 8:30 AM, The Producer Price Index for December from the BLS. The consensus is for a 0.1% decrease in PPI, and a 0.1% increase in core PPI.
• At 9:15 AM, The Fed will release Industrial Production and Capacity Utilization for December. The consensus is for a 0.1% decrease in Industrial Production, and for Capacity Utilization to decrease to 79.6%.
• At 10:00 AM, The January NAHB homebuilder survey. The consensus is for a reading of 31, unchanged from 31 in December. Any number below 50 indicates that more builders view sales conditions as poor than good.
• At 2:00 PM, the Federal Reserve Beige Book, an informal review by the Federal Reserve Banks of current economic conditions in their Districts.
Homebuilder Price Cuts
by Calculated Risk on 1/17/2023 03:32:00 PM
Today, in the Calculated Risk Real Estate Newsletter: Homebuilder Price Cuts
A brief excerpt:
A short note on homebuilder price cuts courtesy of Rick Palacios Jr., Director of Research at John Burns Real Estate Consulting (a must follow for housing on twitter!):There is more in the article. You can subscribe at https://calculatedrisk.substack.com/
From Palacios on Twitter:
Nationally, just 16% of home builders haven't had to drop prices since the market peaked in March 2022. Most builders have dropped prices -6% to -10%. Very different story when you break it out by region however...

Update: The Inland Empire
by Calculated Risk on 1/17/2023 08:18:00 AM
Way back in 2006 I disagreed with some analysts on the outlook for the Inland Empire in California. I wrote:
As the housing bubble unwinds, housing related employment will fall; and fall dramatically in areas like the Inland Empire. The more an area is dependent on housing, the larger the negative impact on the local economy will be.And sure enough, the economies of housing dependent areas like the Inland Empire were devastated during the housing bust.
So I think some pundits have it backwards: Instead of a strong local economy keeping housing afloat, I think the bursting housing bubble will significantly impact housing dependent local economies.
 Click on graph for larger image.
This graph shows the unemployment rate for the Inland Empire (using MSA: Riverside, San Bernardino, Ontario), and also the number of construction jobs as a percent of total employment.
The unemployment rate was falling before the pandemic and was down to 3.6% (down from 14.4% in 2010). During the pandemic, the unemployment rate increased to 15.6%, but is down to 4.2% (NSA).
And construction employment is up from the lows (as a percent of total employment), but still well below the bubble years.
So, the Inland Empire economy isn't as heavily depending on construction as during the bubble - and will not be as hard hit by the current housing slowdown.
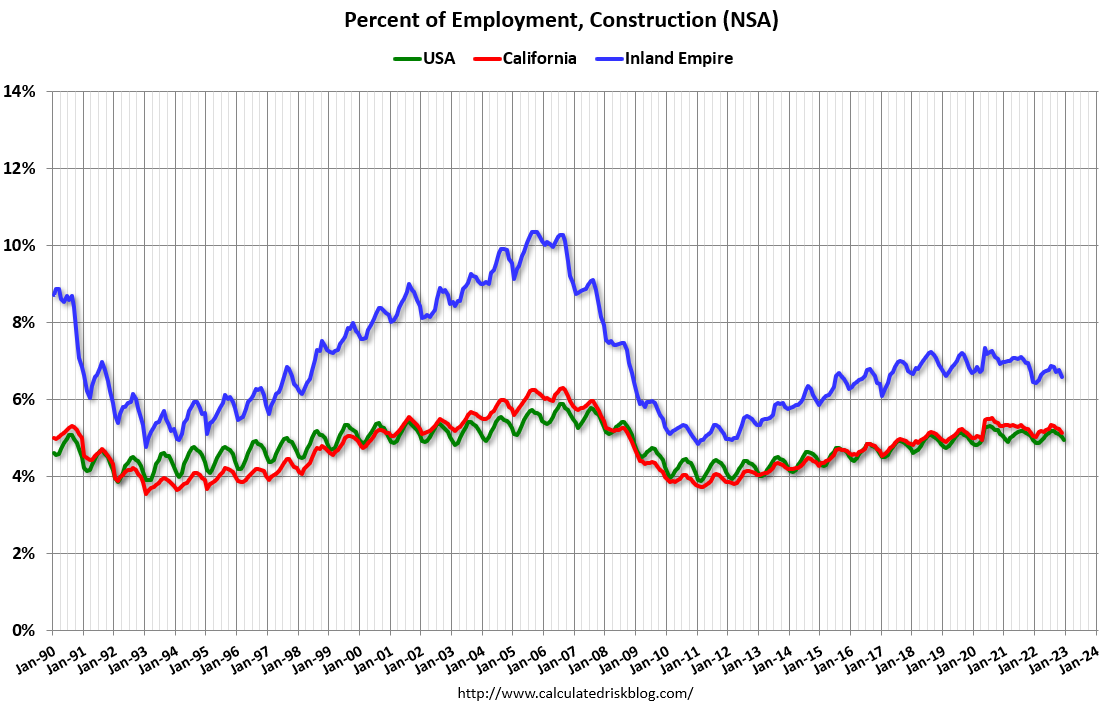
 The second graph shows the number of construction jobs as a percent of total employment for the Inland Empire, all of California, and the entire U.S.
Clearly the Inland Empire is more dependent on construction than most areas.
So, the Inland Empire economy isn't as heavily depending on construction as during the bubble - and will not be as hard hit by the current housing slowdown.
 The second graph shows the number of construction jobs as a percent of total employment for the Inland Empire, all of California, and the entire U.S.
Clearly the Inland Empire is more dependent on construction than most areas.
Monday, January 16, 2023
Tuesday: NY Fed Mfg
by Calculated Risk on 1/16/2023 08:20:00 PM
Weekend:
• Schedule for Week of January 15, 2023
Tuesday:
• 8:30 AM: The New York Fed Empire State manufacturing survey for January. The consensus is for a reading of -8.7, up from -11.2.
From CNBC: Pre-Market Data and Bloomberg futures S&P 500 and DOW futures are mostly unchanged (fair value).
Oil prices were up over the last week with WTI futures at $78.85 per barrel and Brent at $84.06 per barrel. A year ago, WTI was at $84, and Brent was at $79 - so WTI oil prices are DOWN 6% year-over-year.
Here is a graph from Gasbuddy.com for nationwide gasoline prices. Nationally prices are at $3.29 per gallon. A year ago, prices were at $3.27 per gallon, so gasoline prices are up $0.02 per gallon year-over-year.
The Housing Bubble and Mortgage Debt as a Percent of GDP
by Calculated Risk on 1/16/2023 10:38:00 AM
Today, in the Calculated Risk Real Estate Newsletter: The Housing Bubble and Mortgage Debt as a Percent of GDP
A brief excerpt:
In a 2005 post, I included a graph of household mortgage debt as a percent of GDP. Several readers asked if I could update the graph.There is much more in the article. You can subscribe at https://calculatedrisk.substack.com/
First, from February 2005 (18 years ago!):The following chart shows household mortgage debt as a % of GDP. Although mortgage debt has been increasing for years, the last four years have seen a tremendous increase in debt. Last year alone mortgage debt increased close to $800 Billion - almost 7% of GDP. ...And a serious problem is what happened!
Many homeowners have refinanced their homes, in essence using their homes as an ATM.It wouldn't take a RE bust to impact the general economy. Just a slowdown in both volume (to impact employment) and in prices (to slow down borrowing) might push the general economy into recession. An actual bust, especially with all of the extensive sub-prime lending, might cause a serious problem.

Housing January 16th Weekly Update: Inventory Increased 0.3% Week-over-week
by Calculated Risk on 1/16/2023 08:13:00 AM
Altos reports inventory was up 0.3% week-over-week. Usually inventory bottoms in February; last year, in 2022, inventory bottomed in early March. It is possible that inventory has already bottomed for the year!
Here are the same week inventory changes for the last five years:
2023: +1.3K
2022: -8.4K
2021: -22.9K
2020: -25.8K
2019: -2.3K
 Click on graph for larger image.
This inventory graph is courtesy of Altos Research.
As of January 13th, inventory was at 473 thousand (7-day average), compared to 471 thousand the prior week.

The red line is for 2023. The black line is for 2019. Note that inventory is up from the previous two years (the record low was in 2022), but still well below normal levels.
Inventory was up 66.6% compared to the same week in 2022, and down 42.0% compared to the same week in 2019.
A key will be when inventory starts increasing in 2023 (this might have already happened).
Mike Simonsen discusses this data regularly on Youtube.
Sunday, January 15, 2023
Effective Fed Funds Rate and Inflation
by Calculated Risk on 1/15/2023 10:33:00 AM
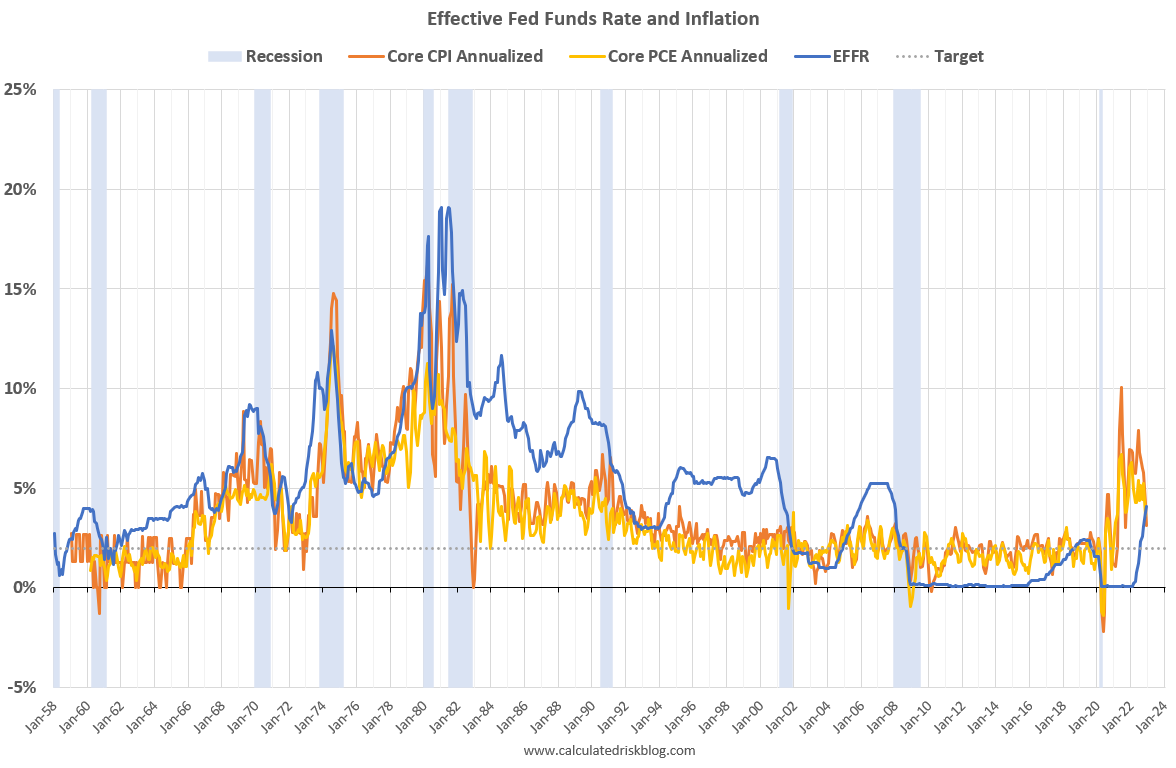
This graph shows the Effective Fed Funds Rate (blue) since 1958.
The graph shows two measures of inflation using a month-over-month change annualized (using a three-month average to smooth the graph). For example, for December 2022, I used an average of December, November and October 2022, divided by the average of November, October and September 2022. (This was just for smoothing).
 Click on graph for larger image.
In 1974, the Fed started cutting rates before inflation peaked. However, in the Volcker period, the Fed waited until after inflation peaked.
The good news is the inflation has clearly peaked. And since rents are falling faster than seasonally normal - due to the pandemic related changes in household formation - it makes sense for the short term to use core CPI ex-shelter. And that is actually negative for the last 3 months!
NOTE: There was a surge in household formation during the pandemic, pushing up rents sharply, and now household formation has slowed sharply just as more supply will be coming on the market.
 This graph shows the year-over-year change in Core CPI ex-Shelter (blue), and the one month change annualized (red). The year-over-year change was at 4.4% in December, down from 5.2% in November. And the annualized one-month change was negative in October, November and December!
Saturday, January 14, 2023
Real Estate Newsletter Articles this Week: A Sharp Decline in Sales, House Prices and Rents Falling
by Calculated Risk on 1/14/2023 02:11:00 PM
At the Calculated Risk Real Estate Newsletter this week:
• 3rd Look at Local Housing Markets in December
• Current State of the Housing Market; Overview for mid-January
• Lawler: Freddie Mac “National” Home Price Index Down Again in November; Rents Continued to Slide
• Mortgage Rate Update
• 2nd Look at Local Housing Markets in December
This is usually published 4 to 6 times a week and provides more in-depth analysis of the housing market.
You can subscribe at https://calculatedrisk.substack.com/
Most content is available for free (and no Ads), but please subscribe!
Schedule for Week of January 15, 2023
by Calculated Risk on 1/14/2023 08:11:00 AM
The key reports this week are December retail sales, housing starts and existing home sales.
For manufacturing, the December Industrial Production report and the January New York and Philly Fed manufacturing surveys will be released.
All US markets will be closed in observance of Martin Luther King Jr. Day
8:30 AM: The New York Fed Empire State manufacturing survey for January. The consensus is for a reading of -8.7, up from -11.2.
7:00 AM ET: The Mortgage Bankers Association (MBA) will release the results for the mortgage purchase applications index.
 8:30 AM: Retail sales for December is scheduled to be released. The consensus is for a 0.8% decrease in retail sales.
This graph shows retail sales since 1992. This is monthly retail sales and food service, seasonally adjusted (total and ex-gasoline).
8:30 AM ET: The Producer Price Index for December from the BLS. The consensus is for a 0.1% decrease in PPI, and a 0.1% increase in core PPI.
 9:15 AM: The Fed will release Industrial Production and Capacity Utilization for December.
This graph shows industrial production since 1967.
The consensus is for a 0.1% decrease in Industrial Production, and for Capacity Utilization to decrease to 79.6%.
10:00 AM: The January NAHB homebuilder survey. The consensus is for a reading of 31, unchanged from 31 in December. Any number below 50 indicates that more builders view sales conditions as poor than good.
2:00 PM: the Federal Reserve Beige Book, an informal review by the Federal Reserve Banks of current economic conditions in their Districts.
8:30 AM: The initial weekly unemployment claims report will be released. The consensus is for 212 thousand initial claims, up from 205 thousand last week.
 8:30 AM: Housing Starts for December.
 This graph shows single and multi-family housing starts since 1968.
The consensus is for 1.358 million SAAR, down from 1.427 million SAAR.
8:30 AM: the Philly Fed manufacturing survey for January.
 10:00 AM: Existing Home Sales for December from the National Association of Realtors (NAR). The consensus is for 3.95 million SAAR, down from 4.09 million.
The graph shows existing home sales from 1994 through the report last month.


