 RSS Feed
 by Calculated Risk on 11/29/2022 06:34:00 PM
Tuesday, November 29, 2022
Las Vegas October 2022: Visitor Traffic Down Just 0.8% Compared to 2019; Convention Traffic UP
Note: I like using Las Vegas as a measure of recovery for both leisure (visitors) and business (conventions).
From the Las Vegas Visitor Authority: October 2022 Las Vegas Visitor Statistics
With an improving conventions segment combined with several events including the dual weekend When We Were Young music festival, two Raiders home games and the NASCAR South Point 400 race, the month saw the destination host over 3.6M visitors, nearly matching the tally of October 2019.
Reaching the highest level since November 2019, overall hotel occupancy reached 87.7% (+6.1 pts YoY and down ‐2.3 pts vs. October 2019). Weekend occupancy reached 94.0%, a level not seen since the 94.8% figure of February 2020, the month immediately preceding the COVID shutdown, while Midweek occupancy reached 85.1%, the highest figure since October 2019's 87.1% tally.
Strong demand during the month supported by major events and conventions shattered the monthly record for ADR as avg. daily room rates approached $210, +20.8% YoY and +55.1% ahead of October 2019 while RevPAR surpassed $184 for the month, +29.9% YoY and +51.1% over October 2019
 Click on graph for larger image.
 The first graph shows visitor traffic for 2019 (dark blue), 2020 (light blue), 2021 (yellow) and 2022 (red)
Visitor traffic was down 0.8% compared to the same month in 2019.
Visitor traffic was up 7.3% compared to last October.
The second graph shows convention traffic.

Convention traffic was UP 19.6% compared to October 2019.The second graph shows convention traffic.
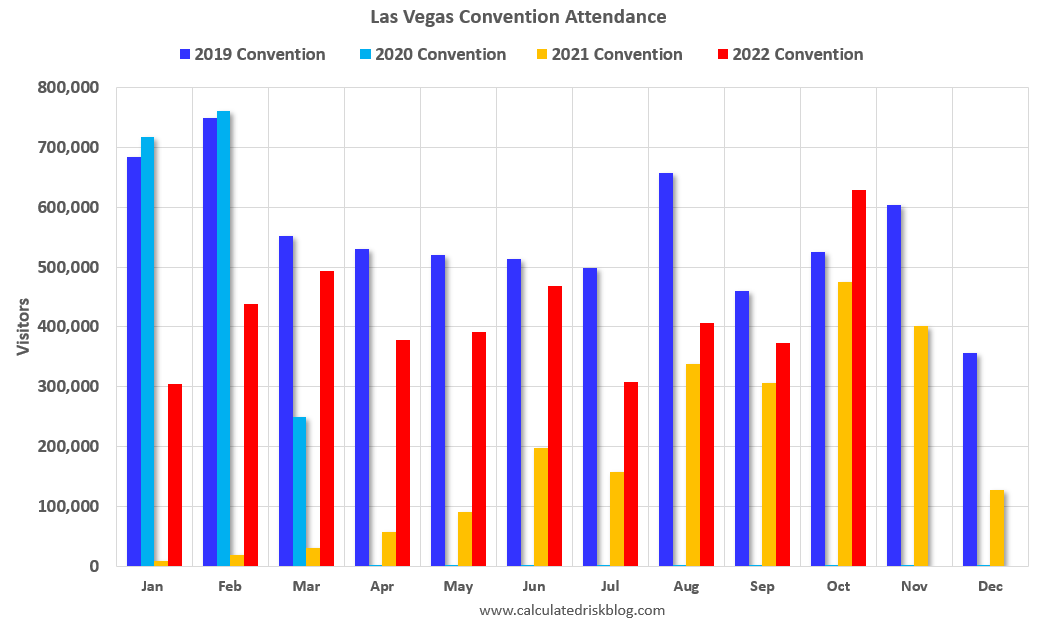
Note: There was almost no convention traffic from April 2020 through May 2021.
FHFA Announces Baseline Conforming Loan Limit Will Increase to $726,200
by Calculated Risk on 11/29/2022 01:12:00 PM
High-Cost Areas increase to $1,089,300.
Here is the official announcement from the FHFA: FHFA Announces Conforming Loan Limit Values for 2023
The Federal Housing Finance Agency (FHFA) today announced the conforming loan limit values (CLLs) for mortgages to be acquired by Fannie Mae and Freddie Mac (the Enterprises) in 2023. In most of the United States, the 2023 CLL value for one-unit properties will be $726,200, an increase of $79,000 from $647,200 in 2022.
...
The new ceiling loan limit for one-unit properties will be $1,089,300, which is 150 percent of $726,200.
Comments on September Case-Shiller and FHFA House Prices
by Calculated Risk on 11/29/2022 09:51:00 AM
Today, in the Calculated Risk Real Estate Newsletter: Case-Shiller: National House Price Index "Continued to Decline" to 10.6% year-over-year increase in September
Excerpt:
Both the Case-Shiller House Price Index (HPI) and the Federal Housing Finance Agency (FHFA) HPI for September were released today. Here is a graph of the month-over-month (MoM) change in the Case-Shiller National Index Seasonally Adjusted (SA).
The Case-Shiller Home Price Indices for “September” is a 3-month average of July, August and September closing prices. July closing prices include some contracts signed in May, so there is a significant lag to this data.
The MoM decrease in Case-Shiller was at -0.76% seasonally adjusted. This was the third consecutive MoM decrease, and slightly less than the decrease last month. This suggests prices fell sharply for September closings.
On a seasonally adjusted basis, prices declined in all of the Case-Shiller cities on a month-to-month basis. The largest monthly declines seasonally adjusted were in San Francisco (-2.2%), Phoenix (-2.1%) and Las Vegas (-2.1%). San Francisco has fallen 10.3% from the peak in May 2022.
...
The September Case-Shiller report is mostly for contracts signed in the May through August period when 30-year mortgage rates were in the low-to-mid 5% range. The October report will mostly be for contracts signed in the June through September period - when rates were mostly in the low-to-mid 5% range (except September).
The impact from higher rates in September and October will not show up significantly for a few more months.

There is much more in the article. You can subscribe at https://calculatedrisk.substack.com/
Case-Shiller: National House Price Index "Continued to Decline" to 10.6% year-over-year increase in September
by Calculated Risk on 11/29/2022 09:12:00 AM
S&P/Case-Shiller released the monthly Home Price Indices for September ("September" is a 3-month average of July, August and September closing prices).
This release includes prices for 20 individual cities, two composite indices (for 10 cities and 20 cities) and the monthly National index.
From S&P: S&P Corelogic Case-Shiller Index Continued to Decline in September
The S&P CoreLogic Case-Shiller U.S. National Home Price NSA Index, covering all nine U.S. census divisions, reported a 10.6% annual gain in September, down from 12.9% in the previous month. The 10-City Composite annual increase came in at 9.7%, down from 12.1% in the previous month. The 20- City Composite posted a 10.4% year-over-year gain, down from 13.1% in the previous month.
Miami, Tampa, and Charlotte reported the highest year-over-year gains among the 20 cities in September. Miami led the way with a 24.6% year-over-year price increase, followed by Tampa in second with a 23.8% increase, and Charlotte in third with a 17.8% increase. All 20 cities reported lower price increases in the year ending September 2022 versus the year ending August 2022.
...
Before seasonal adjustment, the U.S. National Index posted a -1.0% month-over-month decrease in September, while the 10-City and 20-City Composites posted decreases of -1.4% and -1.5%, respectively.
After seasonal adjustment, the U.S. National Index posted a month-over-month decrease of -0.8%, and the 10-City and 20-City Composites both posted decreases of -1.2%.
In September, all 20 cities reported declines before and after seasonal adjustments.
“As has been the case for the past several months, our September 2022 report reflects short-term declines and medium-term deceleration in housing prices across the U.S.,” says Craig J. Lazzara, Managing Director at S&P DJI. “For example, the National Composite Index fell -1.0% in September, and now stands 10.6% above its year-ago level. We see comparable patterns in our 10- and 20-City Composites, which declined -1.4% and -1.5%, respectively, bringing their year-over-year gains down to 9.7% and 10.4%. For all three composites, year-over-year gains, while still well above their historical medians, peaked roughly six months ago and have decelerated since then.
emphasis added
 Click on graph for larger image.
 The first graph shows the nominal seasonally adjusted Composite 10, Composite 20 and National indices (the Composite 20 was started in January 2000).
The Composite 10 index is down 1.2% in September (SA).
The Composite 20 index is down 1.2% (SA) in September.
The National index is 62% above the bubble peak (SA), and down 0.8% (SA) in September. The National index is up 119% from the post-bubble low set in February 2012 (SA).
 The second graph shows the year-over-year change in all three indices.
The Composite 10 SA is up 9.7% year-over-year. The Composite 20 SA is up 10.4% year-over-year.
The National index SA is up 10.6% year-over-year.
Annual price increases were lower than expected. I'll have more later.
Monday, November 28, 2022
Tuesday: Case-Shiller House Prices
by Calculated Risk on 11/28/2022 08:47:00 PM
 From Matthew Graham at Mortgage News Daily: Reinforcing The Range as Trading Slowly Resumes
Bonds were effectively closed for a 4-day weekend starting with Thanksgiving last Thursday. True, Friday was technically open for half a day, but volume and participation were so light as to make any of the movement questionable. This is typical of any Friday after Thanksgiving.Tuesday:
The following Monday (or "today" in today's case) tends to be a transitional day with plenty of holiday vibes intact but stronger participation compared to the previous trading session. ... [30 year fixed 6.62%]
emphasis added
• At 9:00 AM ET, S&P/Case-Shiller House Price Index for September. The consensus is for a 14.4% year-over-year increase in the Composite 20 index for September.
• Also at 9:00 AM, FHFA House Price Index for September. This was originally a GSE only repeat sales, however there is also an expanded index. The 2023 Conforming loan limits will also be announced.
Join the CalculatedRisk Newsletter subscriber chat
by Calculated Risk on 11/28/2022 11:10:00 AM
Today I’m announcing the CalculatedRisk Newsletter subscriber chat.
This is a conversation space in the Substack app that is exclusively for CalculatedRisk Newsletter subscribers — kind of like a group chat or live hangout. I’ll post short prompts, thoughts, and updates that come my way, and you can jump into the discussion.
To join the chat, you’ll need to download the Substack app (messages are sent via the app, not email).
NOTE: The app is currently only available for iOS but will be available for Android and web very soon.
First, subscribe to the CalculatedRisk Newsletter.
Then download the substack app by clicking this link
Open the app and tap the Chat icon. It looks like two bubbles in the bottom bar, and you’ll see a row for my chat inside.
The Newsletter is mostly free, and many chat threads will be free. Enjoy.
Housing November 28th Weekly Update: Inventory Decreased Slightly Week-over-week
by Calculated Risk on 11/28/2022 08:57:00 AM
Active inventory decreased slightly. Here are the same week inventory changes for the last four years (usually inventory declines seasonally through the Winter):
2022: -4.8K (smaller than usual decrease in inventory)
2021: -9.9K
2020: -15.1K
2019: -18.4K
Altos reports inventory is down 0.8% week-over-week and down 2.3% from the peak on October 28th.
 Click on graph for larger image.
This inventory graph is courtesy of Altos Research.
 Click on graph for larger image.
This inventory graph is courtesy of Altos Research.
As of November 25th, inventory was at 564 thousand (7-day average), compared to 569 thousand the prior week.
Compared to the same week in 2021, inventory is up 50.3% from 375 thousand, and compared to the same week in 2020 inventory is up 12.9% from 499 thousand. However, compared to 3 years ago (2019), inventory is down 34.4% from 859 thousand.
Here are the inventory milestones I’ve been watching for with the Altos data:
1. The seasonal bottom (happened on March 4, 2022, for Altos) ✅
2. Inventory up year-over-year (happened on May 20, 2022, for Altos) ✅
3. Inventory up compared to 2020 (happened on October 7, 2022, for Altos) ✅
4. Inventory up compared to 2019 (currently down 34.4%).
Mike Simonsen discusses this data regularly on Youtube.
1. The seasonal bottom (happened on March 4, 2022, for Altos) ✅
2. Inventory up year-over-year (happened on May 20, 2022, for Altos) ✅
3. Inventory up compared to 2020 (happened on October 7, 2022, for Altos) ✅
4. Inventory up compared to 2019 (currently down 34.4%).

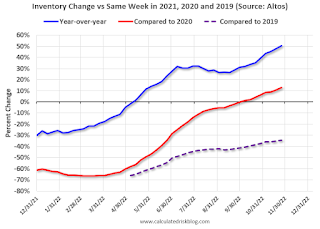
Here is a graph of the inventory change vs 2021 (milestone 2 above), 2020 (milestone 3) and 2019 (milestone 4). The blue line is the year-over-year data, the red line is compared to two years ago, and dashed purple is compared to 2019.
A key will be if inventory declines slower than usual during the winter months.
Mike Simonsen discusses this data regularly on Youtube.
Four High Frequency Indicators for the Economy
by Calculated Risk on 11/28/2022 08:29:00 AM
These indicators are mostly for travel and entertainment. It was interesting to watch these sectors recover as the pandemic impact subsided.
The TSA is providing daily travel numbers.
This data is as of November 27th.
 Click on graph for larger image.
This data shows the 7-day average of daily total traveler throughput from the TSA for 2019 (Light Blue), 2020 (Black), 2021 (Blue) and 2022 (Red).
The dashed line is the percent of 2019 for the seven-day average.
The 7-day average is 7.2% below the same week in 2019 (92.8% of 2019). (Dashed line)
Air travel - as a percent of 2019 - has picked up recently - but still below pre-pandemic levels.
----- Movie Tickets: Box Office Mojo -----
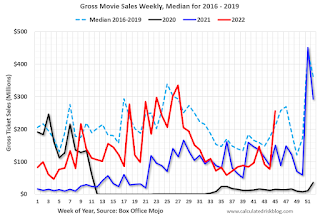 This data shows domestic box office for each week and the median for the years 2016 through 2019 (dashed light blue).
 This data shows domestic box office for each week and the median for the years 2016 through 2019 (dashed light blue).
 Black is 2020, Blue is 2021 and Red is 2022.
The data is from BoxOfficeMojo through November 24th.
Note that the data is usually noisy week-to-week and depends on when blockbusters are released.
Movie ticket sales were at $142 million last week, down about 45% from the median for the week.
Note that the data is usually noisy week-to-week and depends on when blockbusters are released.
Movie ticket sales were at $142 million last week, down about 45% from the median for the week.
NOTE: This is the previous week data, since hotel data wasn't released during the holiday week.
 This graph shows the seasonal pattern for the hotel occupancy rate using the four-week average.
 The red line is for 2022, black is 2020, blue is the median, and dashed light blue is for 2021. Dashed purple is 2019 (STR is comparing to a strong year for hotels).
This data is through Nov 12th. The occupancy rate was up 0.9% compared to the same week in 2019.
The 4-week average of the occupancy rate is above the median rate for the previous 20 years (Blue) and close to 2019 levels.
Notes: Y-axis doesn't start at zero to better show the seasonal change.
Notes: Y-axis doesn't start at zero to better show the seasonal change.

This graph, based on weekly data from the U.S. Energy Information Administration (EIA), shows gasoline supplied compared to the same week of 2019.
Blue is for 2020. Purple is for 2021, and Red is for 2022.
As of November 18th, gasoline supplied was down 9.4% compared to the same week in 2019.
Recently gasoline supplied has been running below 2019 and 2021 levels - and sometimes below 2020.
Sunday, November 27, 2022
Sunday Night Futures
by Calculated Risk on 11/27/2022 07:34:00 PM
Weekend:
• Schedule for Week of November 27, 2022
Monday:
• AT 10:30 AM ET, Dallas Fed Survey of Manufacturing Activity for November. This is the last of the regional Fed manufacturing surveys for November.
From CNBC: Pre-Market Data and Bloomberg futures S&P 500 are down 17 and DOW futures are down 110 (fair value).
Oil prices were down over the last week with WTI futures at $76.06 per barrel and Brent at $83.47 per barrel. A year ago, WTI was at $70, and Brent was at $73 - so WTI oil prices are up 9% year-over-year.
Here is a graph from Gasbuddy.com for nationwide gasoline prices. Nationally prices are at $3.62 per gallon. A year ago, prices were at $3.39 per gallon, so gasoline prices are up $0.23 per gallon year-over-year.
Realtor.com Reports Weekly Active Inventory Up 49% Year-over-year; New Listings Down 17%
by Calculated Risk on 11/27/2022 10:20:00 AM
Realtor.com has monthly and weekly data on the existing home market. Here is their weekly report released today from Chief Economist Danielle Hale: Weekly Housing Trends View — Data Week Ending Nov 19, 2022. Note: They have data on list prices, new listings and more, but this focus is on inventory.
• Active inventory continued to grow, increasing 49% above one year ago. Inventory accelerated again, notching a sixth straight week of growth in the yearly trend roughly at or above 2%–in this case nearly double.
...
• New listings–a measure of sellers putting homes up for sale–were again down, dropping 17% from one year ago. This marks a twentieth straight week of year over year declines in homeowners listing their home for sale, a tangible reflection of the ongoing decline in seller confidence.
 Here is a graph of the year-over-year change in inventory according to realtor.com.
 Note the rapid increase in the YoY change earlier this year, from down 30% at the beginning of the year, to up 29% YoY at the beginning of July.
Then the Realtor.com data was stuck at up around 26% to 30% YoY for 14 weeks in a row. This was due to the slowdown in new listings, even as sales had fallen sharply.
Now YoY inventory is increasing again with even higher mortgage rates, suggesting sales are off more than new listings.


