by Calculated Risk on 11/18/2022 08:45:00 AM
Friday, November 18, 2022
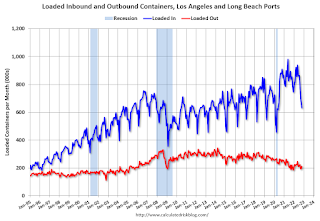
LA Port Traffic Down Sharply in October
Notes: The expansion to the Panama Canal was completed in 2016 (As I noted a few years ago), and some of the traffic that used the ports of Los Angeles and Long Beach is probably going through the canal. This might be impacting TEUs on the West Coast.
Container traffic gives us an idea about the volume of goods being exported and imported - and usually some hints about the trade report since LA area ports handle about 40% of the nation's container port traffic.
The following graphs are for inbound and outbound traffic at the ports of Los Angeles and Long Beach in TEUs (TEUs: 20-foot equivalent units or 20-foot-long cargo container).
To remove the strong seasonal component for inbound traffic, the first graph shows the rolling 12-month average.

On a rolling 12-month basis, inbound traffic decreased 2.2% in October compared to the rolling 12 months ending in September. Outbound traffic decreased 0.4% compared to the rolling 12 months ending the previous month.
The 2nd graph is the monthly data (with a strong seasonal pattern for imports).
Thursday, November 17, 2022
Friday: Existing Home Sales
by Calculated Risk on 11/17/2022 08:35:00 PM
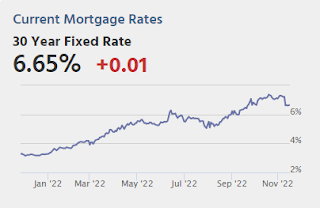
Friday:
• At 10:00 AM ET, Existing Home Sales for October from the National Association of Realtors (NAR). The consensus is for 4.39 million SAAR, down from 4.71 million in September.
• Also at 10:00 AM, State Employment and Unemployment (Monthly) for October 2022
Realtor.com Reports Weekly Active Inventory Up 45% Year-over-year; New Listings Down 18%
by Calculated Risk on 11/17/2022 02:10:00 PM
Realtor.com has monthly and weekly data on the existing home market. Here is their weekly report released today from Chief Economist Danielle Hale: Weekly Housing Trends View — Data Week Ending Nov 12, 2022. Note: They have data on list prices, new listings and more, but this focus is on inventory.
• Active inventory continued to grow, increasing 45% above one year ago. Inventory accelerated again, notching a fifth straight week of gains roughly at or above 2% after a fair amount of stability between July and September. Fewer newly listed homes would normally cause a decline in inventory, but buyers have retreated from the housing market as higher and more uncertain costs make it difficult to ascertain purchasing power and set a budget.
...
• New listings–a measure of sellers putting homes up for sale–were again down, dropping 18% from one year ago. This marks the nineteenth week of year over year declines in homeowners listing their home for sale, a tangible reflection of the ongoing decline in seller confidence. Because potential sellers have pulled back so significantly, prices are decelerating in a more modest fashion than might otherwise be the case.
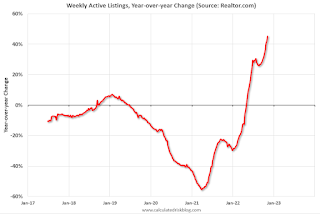 Here is a graph of the year-over-year change in inventory according to realtor.com.
 Note the rapid increase in the YoY change earlier this year, from down 30% at the beginning of the year, to up 29% YoY at the beginning of July.
October Housing Starts: Record Number of Housing Units Under Construction
by Calculated Risk on 11/17/2022 09:22:00 AM
Today, in the CalculatedRisk Real Estate Newsletter: October Housing Starts: Record Number of Housing Units Under Construction
Excerpt:
The fourth graph shows housing starts under construction, Seasonally Adjusted (SA).There is much more in the post. You can subscribe at https://calculatedrisk.substack.com/ (Most content is available for free, so please subscribe).
Red is single family units. Currently there are 794 thousand single family units (red) under construction (SA). This is below the previous six months, and 36 thousand below the recent peak in April and May. Single family units under construction have peaked since single family starts are now declining. The reason there are so many homes under construction is probably due to supply constraints.
Blue is for 2+ units. Currently there are 928 thousand multi-family units under construction. This is the highest level since December 1973! For multi-family, construction delays are probably also a factor. The completion of these units should help with rent pressure.
Combined, there are 1.722 million units under construction. This is the all-time record number of units under construction.
Housing Starts Decreased to 1.425 million Annual Rate in October
by Calculated Risk on 11/17/2022 08:42:00 AM
From the Census Bureau: Permits, Starts and Completions
Housing Starts:
Privately‐owned housing starts in October were at a seasonally adjusted annual rate of 1,425,000. This is 4.2 percent below the revised September estimate of 1,488,000 and is 8.8 percent below the October 2021 rate of 1,563,000. Single‐family housing starts in October were at a rate of 855,000; this is 6.1 percent below the revised September figure of 911,000. The October rate for units in buildings with five units or more was 556,000.
Building Permits:
Privately‐owned housing units authorized by building permits in October were at a seasonally adjusted annual rate of 1,526,000. This is 2.4 percent below the revised September rate of 1,564,000 and is 10.1 percent below the October 2021 rate of 1,698,000. Single‐family authorizations in October were at a rate of 839,000; this is 3.6 percent below the revised September figure of 870,000. Authorizations of units in buildings with five units or more were at a rate of 633,000 in October.
emphasis added
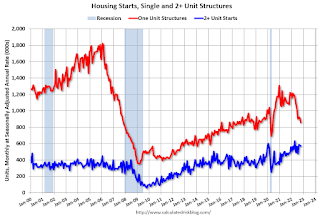 Click on graph for larger image.
The first graph shows single and multi-family housing starts for the last several years.
Multi-family starts (blue, 2+ units) decreased in October compared to September. Multi-family starts were up 17.8% year-over-year in October.
Single-family starts (red) decreased in October and were down 20.8% year-over-year.
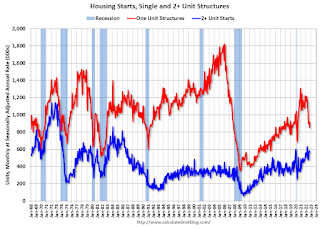 The second graph shows single and multi-family housing starts since 1968.
 This shows the huge collapse following the housing bubble, and then the eventual recovery.
Total housing starts in October were above expectations, however, starts in August and September were revised down slightly, combined.
I'll have more later …
Weekly Initial Unemployment Claims decrease to 222,000
by Calculated Risk on 11/17/2022 08:33:00 AM
The DOL reported:
In the week ending November 12, the advance figure for seasonally adjusted initial claims was 222,000, a decrease of 4,000 from the previous week's revised level. The previous week's level was revised up by 1,000 from 225,000 to 226,000. The 4-week moving average was 221,000, an increase of 2,000 from the previous week's revised average. The previous week's average was revised up by 250 from 218,750 to 219,000.The following graph shows the 4-week moving average of weekly claims since 1971.
emphasis added
 Click on graph for larger image.
The dashed line on the graph is the current 4-week average. The four-week average of weekly unemployment claims increased to 221,000.
The previous week was revised up.
Weekly claims were above the consensus forecast.
Wednesday, November 16, 2022
Thursday: Housing Starts, Unemployment Claims, Philly Fed Mfg
by Calculated Risk on 11/16/2022 09:06:00 PM

Thursday:
• At 8:30 AM ET, Housing Starts for October. The consensus is for 1.410 million SAAR, down from 1.439 million SAAR.
• Also at 8:30 AM, The initial weekly unemployment claims report will be released. The consensus is for 230 thousand initial claims, up from 225 thousand last week.
• Also at 8:30 AM, the Philly Fed manufacturing survey for November. The consensus is for a reading of -8.0, up from -8.7.
• At 11:00 AM: the Kansas City Fed manufacturing survey for November.
3rd Look at Local Housing Markets in October; California Sales off 37% YoY, Prices Fall; Early Read on October Sales
by Calculated Risk on 11/16/2022 03:49:00 PM
Today, in the Calculated Risk Real Estate Newsletter: 3rd Look at Local Housing Markets in October; California Sales off 37% YoY, Prices Fall; Early Read on October Sales
A brief excerpt:
California doesn’t report monthly inventory numbers, but they do report the change in months of inventory. Here is the press release from the California Association of Realtors® (C.A.R.): California home sales bear brunt of higher interest rates in October, C.A.R. reportsThere is much more in the article. You can subscribe at https://calculatedrisk.substack.com/October’s sales pace was down 10.4 percent on a monthly basis from 305,680 in September and down 36.9 percent from a year ago, when 434,170 homes were sold on an annualized basis. ...
California’s median home price declined 2.5 percent in October to $801,190 from the $821,680 recorded in September. The October price was 0.3 percent higher than the $798,440 recorded last October and was the smallest year-over-year price gain in 29 months.In October, sales were down 29.2% YoY Not Seasonally Adjusted (NSA) for these markets.
Here is a table comparing the year-over-year Not Seasonally Adjusted (NSA) declines in sales this year from the National Association of Realtors® (NAR) with the local markets I track. So far, these measures have tracked closely, and the preliminary data below suggests a sharp decline in sales in October.
AIA: Architecture Billings Index "decreases considerably" in October
by Calculated Risk on 11/16/2022 12:02:00 PM
Note: This index is a leading indicator primarily for new Commercial Real Estate (CRE) investment.
From the AIA: Demand for design services decreases considerably
Demand for design services from architecture firms softened considerably in October, according to a new report from The American Institute of Architects (AIA).
AIA’s Architecture Billings Index (ABI) score for October was 47.7, the first decline in billings since January 2021 (any score below 50 indicates a decline in firm billings). Inquiries into new projects continued to grow in October with a score of 52.3, while the value of new design contracts declined, with a score of 48.6.
“Economic headwinds have been steadily mounting, and finally led to weakening demand for new projects,” said AIA Chief Economist, Kermit Baker, Hon. AIA, PhD. “Firm backlogs are healthy and will hopefully provide healthy levels of design activity against fewer new projects entering the pipeline should this weakness persist.”
...
• Regional averages: Midwest (50.8); South (50.6); Northeast (50.3); West (49.6)
• Sector index breakdown: institutional (54.3); mixed practice (50.8); multi-family residential (46.1); commercial/industrial (45.9)
emphasis added
 Click on graph for larger image.
This graph shows the Architecture Billings Index since 1996. The index was at 47.7 in October, down from 51.7 in September. Anything below 50 indicates contraction in demand for architects' services.
Note: This includes commercial and industrial facilities like hotels and office buildings, multi-family residential, as well as schools, hospitals and other institutions.
This index had been positive for 20 consecutive months. This index usually leads CRE investment by 9 to 12 months, so this index suggests a pickup in CRE investment in early 2023, but if the weakness persists - a slowdown in CRE investment later in 2023.
NAHB: Builder Confidence Decreased Further in November
by Calculated Risk on 11/16/2022 10:07:00 AM
The National Association of Home Builders (NAHB) reported the housing market index (HMI) was at 33, down from 35 last month. Any number below 50 indicates that more builders view sales conditions as poor than good.
From the NAHB: Builder Confidence Declines for 11 Consecutive Months as Housing Weakness Continues
Elevated interest rates, stubbornly high building material costs and declining affordability conditions that are pushing more buyers to the sidelines continue to drag down builder sentiment.
Builder confidence in the market for newly built single-family homes posted its 11th straight monthly decline in November, dropping five points to 33, according to the National Association of Home Builders (NAHB)/Wells Fargo Housing Market Index (HMI) released today. This is the lowest confidence reading since June 2012, with the exception of the onset of the pandemic in the spring of 2020.
“Higher interest rates have significantly weakened demand for new homes as buyer traffic is becoming increasingly scarce,” said NAHB Chairman Jerry Konter, a home builder and developer from Savannah, Ga. “With the housing sector in a recession, the Biden administration and new Congress must turn their focus to policies that lower the cost of building and allow the nation’s home builders to expand housing production.”
To bring more buyers into the marketplace, 59% of builders report using incentives, with a big increase in usage from September to November. For example, in November, 25% of builders say they are paying points for buyers, up from 13% in September. Mortgage rate buy-downs rose from 19% to 27% over the same time frame. And 37% of builders cut prices in November, up from 26% in September, with an average price of reduction of 6%. This is still far below the 10%-12% price cuts seen during the Great Recession in 2008.”
...
All three HMI components posted declines in November. Current sales conditions fell six points to 39, sales expectations in the next six months declined four points to 31 and traffic of prospective buyers fell five points to 20.
Looking at the three-month moving averages for regional HMI scores, the Northeast fell six points to 41, the Midwest dropped two points to 38, the South fell seven points to 42 and the West posted a five-point decline to 29
emphasis added
 Click on graph for larger image.
This graph shows the NAHB index since Jan 1985.
This was below the consensus forecast, and the lowest level since 2012 (excluding the two-month drop at the beginning of the pandemic).


