 RSS Feed
 by Calculated Risk on 10/02/2022 07:42:00 PM
Sunday, October 02, 2022
Monday: ISM Mfg, Construction Spending
Weekend:
• Schedule for Week of October 2, 2022
Monday:
• At 10:00 AM ET, ISM Manufacturing Index for September. The consensus is for a reading of 52.2, down from 52.8 in August.
• Also, at 10:00 AM, Construction Spending for August. The consensus is for a 0.3% decrease.
From CNBC: Pre-Market Data and Bloomberg futures S&P 500 are down 1 and DOW futures are up 42 (fair value).
Oil prices were up over the last week with WTI futures at $79.49 per barrel and Brent at $85.14 per barrel. A year ago, WTI was at $76, and Brent was at $79 - so WTI oil prices are up 5% year-over-year.
Here is a graph from Gasbuddy.com for nationwide gasoline prices. Nationally prices are at $3.76 per gallon. A year ago, prices were at $3.18 per gallon, so gasoline prices are up $0.58 per gallon year-over-year. NOTE: Gasoline prices in Los Angeles have spiked to near record $6.28 per gallon due to refinery issues.
Update: Framing Lumber Prices Close to Pre-Pandemic Levels
by Calculated Risk on 10/02/2022 12:04:00 PM
Here is another monthly update on framing lumber prices.
This graph shows CME random length framing futures through September 30th.
Lumber was at $425 per 1000 board feet on Friday.
This is down from the peak of $1,733, and down 34% from $643 a year ago.
Prices are close to the pre-pandemic levels of around $400.
 Click on graph for larger image.
It is unlikely we will see a runup in prices as happened at the end of last year due to the housing slowdown.
Prices are close to the pre-pandemic levels of around $400.
 Click on graph for larger image.
There is somewhat of a seasonal demand for lumber, and lumber prices usually peak in April or May, although peaked much earlier this year.
It is unlikely we will see a runup in prices as happened at the end of last year due to the housing slowdown.
Saturday, October 01, 2022
Real Estate Newsletter Articles this Week
by Calculated Risk on 10/01/2022 02:11:00 PM
At the Calculated Risk Real Estate Newsletter this week:
• Goldman Sees US House Prices Falling 5% to 10%
• Case-Shiller: National House Price Index "Continued its Deceleration" to 15.8% year-over-year increase in July
• Inflation Adjusted House Prices Declined Further in July
• New Home Sales Increased in August; Completed Inventory Increased
• Pace of Rent Increases Continues to Slow
• New Home Sales and Cancellations: Net vs Gross Sales
This is usually published 4 to 6 times a week and provides more in-depth analysis of the housing market.
You can subscribe at https://calculatedrisk.substack.com/
Most content is available for free (and no Ads), but please subscribe!
Schedule for Week of October 2, 2022
by Calculated Risk on 10/01/2022 08:11:00 AM
The key report this week is the September employment report on Friday.
Other key indicators include the September ISM Manufacturing and Services indices, September auto sales and the August trade deficit.
10:00 AM: ISM Manufacturing Index for September. The consensus is for a reading of 52.2, down from 52.8 in August.
10:00 AM: Construction Spending for August. The consensus is for a 0.3% decrease.
8:00 AM ET: Corelogic House Price index for August.
 10:00 AM: Job Openings and Labor Turnover Survey for August from the BLS.
 This graph shows job openings (black line), hires (purple), Layoff, Discharges and other (red column), and Quits (light blue column) from the JOLTS.
Jobs openings increased in July to 11.239 million from 11.040 million in June.
The number of job openings (yellow) were up 4% year-over-year. Quits were up 2% year-over-year.
 All day: Light vehicle sales for September.
The consensus is for sales of 13.5 million SAAR, up from 13.2 million SAAR in August (Seasonally Adjusted Annual Rate).
This graph shows light vehicle sales since the BEA started keeping data in 1967. The dashed line is the current sales rate.
7:00 AM ET: The Mortgage Bankers Association (MBA) will release the results for the mortgage purchase applications index.
8:15 AM: The ADP Employment Report for September. This report is for private payrolls only (no government). The consensus is for 205,000 jobs added, up from 132,000 in August.
 8:30 AM: Trade Balance report for August from the Census Bureau. The consensus is for the deficit to be $68.0 billion in August, from $70.7 billion in July.
This graph shows the U.S. trade deficit, with and without petroleum, through the most recent report. The blue line is the total deficit, and the black line is the petroleum deficit, and the red line is the trade deficit ex-petroleum products.
10:00 AM: the ISM Services Index for September.
8:30 AM: The initial weekly unemployment claims report will be released. The consensus is for an increase to 203 thousand from 193 thousand last week.
 8:30 AM: Employment Report for September. The consensus is for 250,000 jobs added, and for the unemployment rate to be unchanged at 3.7%.
There were 315,000 jobs added in August, and the unemployment rate was at 3.7%.
This graph shows the job losses from the start of the employment recession, in percentage terms.
The current employment recession was by far the worst recession since WWII in percentage terms. However, 30 months after the onset of the current employment recession, all of the jobs have returned.
Friday, September 30, 2022
COVID Sept 30, 2022, Update on Cases, Hospitalizations and Deaths
by Calculated Risk on 9/30/2022 09:14:00 PM
NOTE: Starting next week, COVID stats will be updated only on Fridays.
On COVID (focus on hospitalizations and deaths):
| COVID Metrics | ||||
|---|---|---|---|---|
| Now | Week Ago | Goal | ||
| New Cases per Day2 | 45,725 | 54,205 | ≤5,0001 | |
| Hospitalized2 | 23,052 | 25,159 | ≤3,0001 | |
| Deaths per Day2 | 325 | 376 | ≤501 | |
| 1my goals to stop daily posts, 27-day average for Cases, Currently Hospitalized, and Deaths 🚩 Increasing 7-day average week-over-week for Cases, Hospitalized, and Deaths ✅ Goal met. | ||||
 Click on graph for larger image.
This graph shows the daily (columns) and 7-day average (line) of deaths reported.
NOTE: Cases have declined by more than half, and deaths lag cases - so we might see average daily deaths in the 200s soon (good news, but still too high).
Average daily deaths bottomed in July 2021 at 214 per day.
Fannie Mae: Mortgage Serious Delinquency Rate Decreased in August
by Calculated Risk on 9/30/2022 04:11:00 PM
Fannie Mae reported that the Single-Family Serious Delinquency decreased to 0.72% in August from 0.76% in July. The serious delinquency rate is down from 1.79% in August 2021. This is almost back to pre-pandemic levels.
These are mortgage loans that are "three monthly payments or more past due or in foreclosure".
The Fannie Mae serious delinquency rate peaked in February 2010 at 5.59% following the housing bubble and peaked at 3.32% in August 2020 during the pandemic.
 Click on graph for larger image
By vintage, for loans made in 2004 or earlier (1% of portfolio), 2.48% are seriously delinquent (down from 2.60% in July).
For loans made in 2005 through 2008 (1% of portfolio), 3.95% are seriously delinquent (down from 4.11%),
For recent loans, originated in 2009 through 2021 (98% of portfolio), 0.57% are seriously delinquent (down from 0.60%). So, Fannie is still working through a few poor performing loans from the bubble years.
Mortgages in forbearance were counted as delinquent in this monthly report, but they were not reported to the credit bureaus.
Freddie Mac reported earlier.
Mortgages in forbearance were counted as delinquent in this monthly report, but they were not reported to the credit bureaus.
Freddie Mac reported earlier.
Goldman Sees US House Prices Falling 5% to 10%
by Calculated Risk on 9/30/2022 01:47:00 PM
Today, in the Calculated Risk Real Estate Newsletter: Goldman See US House Prices Falling 5% to 10%
Excerpt:
The recent weakness in the housing market, combined with mortgage rates close to 7%, have led to some downwards revisions to house price forecasts. For example, from Goldman Sachs economists today:Our G10 home price model suggests sizable nominal home prices declines from the peak of around 15% in Canada, 5-10% in the US, and under 5% in the UK. … We view the risks to these estimates as tilted to the downsideThis is a significant downgrade from Goldman’s “stall” forecast from just a few weeks ago. ...
emphasis added
It now appears house prices are falling even though inventory levels are still historically fairly low (by measures of active inventory or months of supply). ... Here is a look at existing home months-of-supply (inverted, from the NAR) vs. the seasonally adjusted month-to-month price change in the Case-Shiller National Index (both since January 1999 through July 2022). Note that the months-of-supply is not seasonally adjusted.
The last three months are in black showing a possible shift in the relationship.

There is much more in the article. You can subscribe at https://calculatedrisk.substack.com/
Q3 GDP Tracking: 1% to 2% Range
by Calculated Risk on 9/30/2022 01:13:00 PM
From BofA:
Overall, the data since our last weekly publication and our updated assumptions on trade boosted our 3Q US GDP tracking from 0.8% q/q saar to 1.5% q/q saar. [September 30th estimate]From Goldman:
emphasis added
Following this morning’s data and yesterday’s revisions, we have lowered our Q3 GDP tracking forecast by 0.5pp to +0.9% (qoq ar). [September 30th estimate]And from the Altanta Fed: GDPNow
The GDPNow model estimate for real GDP growth (seasonally adjusted annual rate) in the third quarter of 2022 is 2.4 percent on September 30, up from 0.3 percent on September 27. After recent releases from the US Bureau of Economic Analysis and the US Census Bureau, the nowcasts of third-quarter personal consumption expenditures growth and third-quarter gross private domestic investment growth increased from 0.4 percent and -7.6 percent, respectively, to 1.0 percent and -4.2 percent, respectively, while the nowcast of the contribution of net exports to first-quarter real GDP growth increased from 1.10 percentage points to 2.20 percentage points. [September 30th estimate]
Realtor.com Reports Weekly Active Inventory Up 29% Year-over-year; New Listings Down 10%
by Calculated Risk on 9/30/2022 09:48:00 AM
Realtor.com has monthly and weekly data on the existing home market. Here is their weekly report released yesterday from Chief Economist Danielle Hale and Jiayi Xu: Weekly Housing Trends View — Data Week Ending Sep 24, 2022. Note: They have data on list prices, new listings and more, but this focus is on inventory.
• Active inventory continued to grow, and improved 29% above one year ago. Financial conditions are changing the balance of sellers and buyers in the housing market with more homes for-sale compared to one year ago. Still, the market is still not back to pre-pandemic inventory levels.
...
• New listings–a measure of sellers putting homes up for sale–were again down, dropping 10% from one year ago. This week marks the twelfth straight week of year over year declines in the number of new listings coming up for sale.
 Here is a graph of the year-over-year change in inventory according to realtor.com.
 Note the rapid increase in the YoY change earlier this year, from down 30% at the beginning of the year, to up 29% YoY at the beginning of July.
However, the Realtor.com data has been stuck at up around 26% to 30% YoY for 13 weeks in a row. This is due to the slowdown in new listings, even as sales have fallen sharply.
Personal Income increased 0.3% in August; Spending increased 0.4%
by Calculated Risk on 9/30/2022 08:39:00 AM
The BEA released the Personal Income and Outlays, August 2022 and Annual Update report:
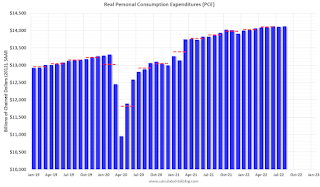
Personal income increased $71.6 billion (0.3 percent) in August, according to estimates released today by the Bureau of Economic Analysis. Disposable personal income (DPI) increased $67.6 billion (0.4 percent) and personal consumption expenditures (PCE) increased $67.5 billion (0.4 percent).The August PCE price index increased 6.2 percent year-over-year (YoY), down from 6.4 percent YoY in July.
The PCE price index increased 0.3 percent. Excluding food and energy, the PCE price index increased 0.6 percent. Real DPI increased 0.1 percent in August and Real PCE increased 0.1 percent; goods decreased 0.2 percent and services increased 0.2 percent.
emphasis added
The PCE price index, excluding food and energy, increased 4.9 percent YoY, up from 4.7% in July.
The following graph shows real Personal Consumption Expenditures (PCE) through August 2022 (2012 dollars). Note that the y-axis doesn't start at zero to better show the change.
 Click on graph for larger image.
The dashed red lines are the quarterly levels for real PCE.
Personal income was at expectations, and PCE was above expectations.
Inflation was slightly higher than expected.
Using the two-month method to estimate Q3 real PCE growth, real PCE was increasing at a 0.8% annual rate in Q3 2022. (Using the mid-month method, real PCE was increasing at 0.9%)
Using the two-month method to estimate Q3 real PCE growth, real PCE was increasing at a 0.8% annual rate in Q3 2022. (Using the mid-month method, real PCE was increasing at 0.9%)


