 RSS Feed
 by Calculated Risk on 7/02/2022 02:11:00 PM
Saturday, July 02, 2022
Real Estate Newsletter Articles this Week
At the Calculated Risk Real Estate Newsletter this week:
• Housing: Inventory will Tell the Tale
• Case-Shiller National Index up 20.4% Year-over-year in April
• Worst Housing Affordability" since 1991 excluding Bubble
• Realtor.com Reports Weekly Inventory Up 25% Year-over-year
• Rent Increases Up Sharply Year-over-year, Pace is slowing
This is usually published 4 to 6 times a week and provides more in-depth analysis of the housing market.
You can subscribe at https://calculatedrisk.substack.com/
Most content is available for free (and no Ads), but please subscribe!
Vehicles Sales Increased to 13.00 million SAAR in June
by Calculated Risk on 7/02/2022 09:00:00 AM
Wards Auto released their estimate of light vehicle sales for June. Wards Auto estimates sales of 13.00 million SAAR in June 2022 (Seasonally Adjusted Annual Rate), up 2.5% from the May sales rate, and down 16.0% from June 2021.
 Click on graph for larger image.
This graph shows light vehicle sales since 2006 from the BEA (blue) and Wards Auto's estimate for June (red).
The impact of COVID-19 was significant, and April 2020 was the worst month. After April 2020, sales increased, and were close to sales in 2019 (the year before the pandemic).
However, sales decreased late last year due to supply issues. It appears the "supply chain bottom" was in September 2021.
 The second graph shows light vehicle sales since the BEA started keeping data in 1967.
 Sales in June were below the consensus forecast of 13.6 million SAAR.
Schedule for Week of July 3, 2022
by Calculated Risk on 7/02/2022 08:11:00 AM
The key report scheduled for this week is the June employment report to be released on Friday.
Other key reports include Job Openings, the June ISM Service survey and the Trade Deficit for May.
All US markets will be closed in observance of Independence Day
8:00 AM: Corelogic House Price index for May.
7:00 AM ET: The Mortgage Bankers Association (MBA) will release the results for the mortgage purchase applications index.
 10:00 AM ET: Job Openings and Labor Turnover Survey for May from the BLS.
 This graph shows job openings (yellow line), hires (purple), Layoff, Discharges and other (red column), and Quits (light blue column) from the JOLTS.
Jobs openings decreased in April to 11.400 million from 11.855 million in March.
The number of job openings (yellow) were up 23% year-over-year and quits were up 10% year-over-year.
10:00 AM: the ISM Services Index for June. The consensus is for a reading of 54.5, down from 55.9.
2:00 PM: FOMC Minutes, Meeting of June 14-15, 2022
8:15 AM: The ADP Employment Report for June will NOT be released.
"ADP Research Institute (ADPRI) and the Stanford Digital Economy Lab (the "Lab") announced they will retool the ADP National Employment Report (NER) methodology to provide a more robust, high-frequency view of the labor market and trajectory of economic growth. In preparation for the changeover to the new report and methodology, ADPRI will pause issuing the current report and has targeted August 31, 2022 ..."8:30 AM: The initial weekly unemployment claims report will be released. The consensus is for 225 thousand down from 231 thousand last week.
 8:30 AM: Trade Balance report for May from the Census Bureau.
 This graph shows the U.S. trade deficit, with and without petroleum, through the most recent report. The blue line is the total deficit, and the black line is the petroleum deficit, and the red line is the trade deficit ex-petroleum products.
The consensus is the trade deficit to be $84.9 billion. The U.S. trade deficit was at $87.1 billion the previous month.
 8:30 AM: Employment Report for June. The consensus is for 270,000 jobs added, and for the unemployment rate to be unchanged at 3.6%.
There were 390,000 jobs added in May, and the unemployment rate was at 3.6%.
This graph shows the job losses from the start of the employment recession, in percentage terms.
The current employment recession was by far the worst recession since WWII in percentage terms. However, the current employment recession, 26 months after the onset, has recovered quicker than the previous two recessions.
Friday, July 01, 2022
COVID July 1, 2022, Update on Cases, Hospitalizations and Deaths
by Calculated Risk on 7/01/2022 10:11:00 PM
On COVID (focus on hospitalizations and deaths):
| COVID Metrics | ||||
|---|---|---|---|---|
| Now | Week Ago | Goal | ||
| Percent fully Vaccinated | 66.9% | --- | ≥70.0%1 | |
| Fully Vaccinated (millions) | 222.3 | --- | ≥2321 | |
| New Cases per Day3🚩 | 109,944 | 99,245 | ≤5,0002 | |
| Hospitalized3🚩 | 26,896 | 25,227 | ≤3,0002 | |
| Deaths per Day3 | 316 | 319 | ≤502 | |
| 1 Minimum to achieve "herd immunity" (estimated between 70% and 85%). 2my goals to stop daily posts, 37-day average for Cases, Currently Hospitalized, and Deaths 🚩 Increasing 7-day average week-over-week for Cases, Hospitalized, and Deaths ✅ Goal met. | ||||
 Click on graph for larger image.
This graph shows the daily (columns) and 7-day average (line) of deaths reported.
Average daily deaths bottomed in July 2021 at 214 per day.
Q2 GDP Forecasts: Close to Zero
by Calculated Risk on 7/01/2022 03:18:00 PM
From BofA:
With the downward revisions to spending and weak spending data in May, we have revised down our 2Q GDP tracking by from 1.5% qoq saar to 0.0% qoq saar. [July 1 estimate]From Goldman:
emphasis added
We left our Q2 GDP tracking estimate unchanged at +1.9% (qoq ar). [July 1 estimate]And from the Altanta Fed: GDPNow
The GDPNow model estimate for real GDP growth (seasonally adjusted annual rate) in the second quarter of 2022 is -2.1 percent on July 1, down from -1.0 percent on June 30. [July 1 estimate]
Rent Increases Up Sharply Year-over-year, Pace is slowing
by Calculated Risk on 7/01/2022 12:39:00 PM
Today, in the Calculated Risk Real Estate Newsletter: Rent Increases Up Sharply Year-over-year, Pace is slowing
A brief excerpt:
Here is a graph of the year-over-year (YoY) change for these measures since January 2015. All of these measures are through April 2022 (Apartment List through June 2022).There is much more in the article. You can subscribe at https://calculatedrisk.substack.com/
Note that new lease measures (Zillow, Apartment List) dipped early in the pandemic, whereas the BLS measures were steady. Then new leases took off, and the BLS measures are picking up.
...
The Zillow measure is up 15.9% YoY in May, down from 16.6% YoY in April. This is down from a peak of 17.2% YoY in February.
The ApartmentList measure is up 14.1% YoY as of June, down from 15.4% in May. This is down from the peak of 17.8% YoY last December.
Clearly rents are still increasing, and we should expect this to continue to spill over into measures of inflation in 2022. The Owners’ Equivalent Rent (OER) was up 5.1% YoY in May, from 4.8% YoY in April - and will likely increase further in the coming months.
My suspicion is rent increases will slow over the coming months as the pace of household formation slows, and more supply comes on the market.

Construction Spending Decreased 0.1% in May
by Calculated Risk on 7/01/2022 10:23:00 AM
From the Census Bureau reported that overall construction spending increased:
Construction spending during May 2022 was estimated at a seasonally adjusted annual rate of $1,779.8 billion, 0.1 percent below the revised April estimate of $1,782.5 billion. The May figure is 9.7 percent above the May 2021 estimate of $1,621.9 billion.Private spending increased and public spending decreased:
emphasis added
Spending on private construction was at a seasonally adjusted annual rate of $1,436.0 billion, virtually unchanged from the revised April estimate of $1,435.9 billion. ...
In May, the estimated seasonally adjusted annual rate of public construction spending was $343.8 billion, 0.8 percent below the revised April estimate of $346.6 billion.
 Click on graph for larger image.
This graph shows private residential and nonresidential construction spending, and public spending, since 1993. Note: nominal dollars, not inflation adjusted.
Residential (red) spending is 38% above the bubble peak (in nominal terms - not adjusted for inflation).
Non-residential (blue) spending is 20% above the bubble era peak in January 2008 (nominal dollars).
Public construction spending is 6% above the peak in March 2009.
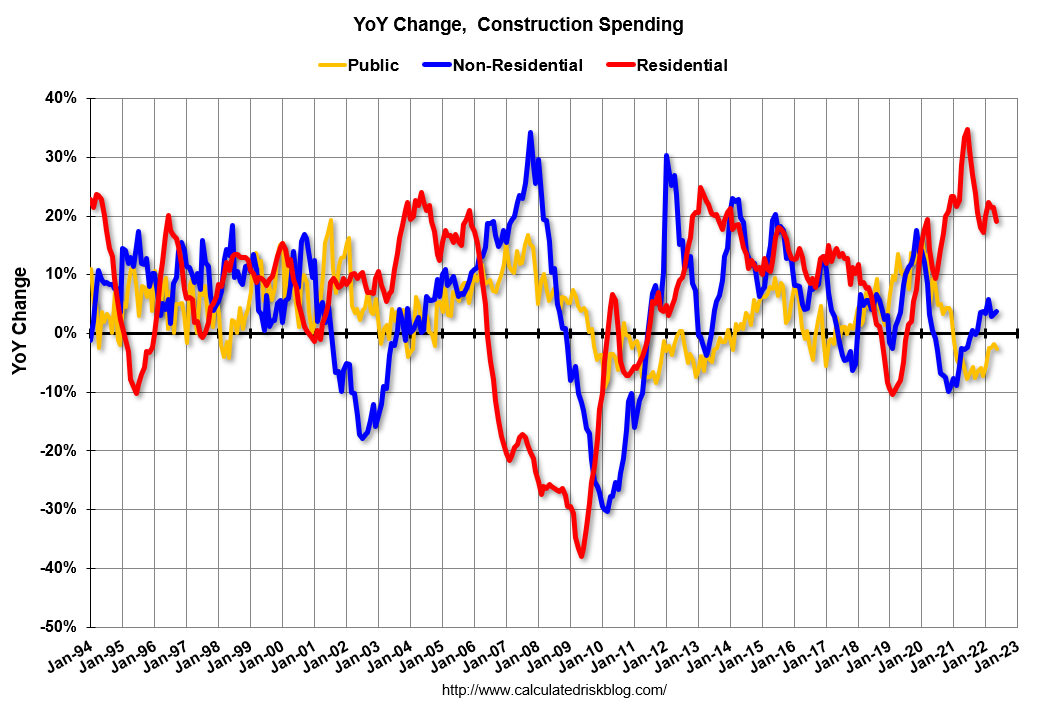 The second graph shows the year-over-year change in construction spending.
On a year-over-year basis, private residential construction spending is up 19.0%. Non-residential spending is up 3.7% year-over-year. Public spending is down 2.7% year-over-year.
This was below consensus expectations of a 0.4% increase in spending; however, construction spending for the previous three months was revised up sharply.
ISM® Manufacturing index Decreased to 53.0% in June
by Calculated Risk on 7/01/2022 10:09:00 AM
(Posted with permission). The ISM manufacturing index indicated expansion. The PMI® was at 53.0% in June, down from 56.1% in May. The employment index was at 47.3%, down from 49.6% last month, and the new orders index was at 49.2%, down from 55.1%.
From ISM: Manufacturing PMI® at 53% June 2022 Manufacturing ISM® Report On Business®
Economic activity in the manufacturing sector grew in June, with the overall economy achieving a 25th consecutive month of growth, say the nation's supply executives in the latest Manufacturing ISM® Report On Business®.This suggests manufacturing expanded at a slower pace in June than in May. This was below the consensus forecast, and the employment index was weak again in June.
The report was issued today by Timothy R. Fiore, CPSM, C.P.M., Chair of the Institute for Supply Management® (ISM®) Manufacturing Business Survey Committee:
“The June Manufacturing PMI® registered 53 percent, down 3.1 percentage points from the reading of 56.1 percent in May. This figure indicates expansion in the overall economy for the 25th month in a row after a contraction in April and May 2020. This is the lowest Manufacturing PMI® reading since June 2020, when it registered 52.4 percent. The New Orders Index reading of 49.2 percent is 5.9 percentage points lower than the 55.1 percent recorded in May. The Production Index reading of 54.9 percent is a 0.7-percentage point increase compared to May’s figure of 54.2 percent. The Prices Index registered 78.5 percent, down 3.7 percentage points compared to the May figure of 82.2 percent. The Backlog of Orders Index registered 53.2 percent, 5.5 percentage points below the May reading of 58.7 percent. The Employment Index contracted for a second straight month at 47.3 percent, 2.3 percentage points lower than the 49.6 percent recorded in May. The Supplier Deliveries Index reading of 57.3 percent is 8.4 percentage points lower than the May figure of 65.7 percent. The Inventories Index registered 56 percent, 0.1 percentage point higher than the May reading of 55.9 percent. The New Export Orders Index reading of 50.7 percent is down 2.2 percentage points compared to May’s figure of 52.9 percent. The Imports Index climbed into expansion territory, up 2 percentage points to 50.7 percent from 48.7 percent in May.”
emphasis added
Thursday, June 30, 2022
Friday: ISM Manufacturing, Construction Spending, Vehicle Sales
by Calculated Risk on 6/30/2022 09:00:00 PM
Friday:
• At 10:00 AM ET, ISM Manufacturing Index for June. The consensus is for the ISM to be at 55.0, down from 56.1 in May.
• At 10:00 AM, Construction Spending for May. The consensus is for a 0.4% increase in construction spending.
• Late in the day, Light vehicle sales for June. The consensus is for light vehicle sales to be 13.6 million SAAR in June, up from 12.7 million in May (Seasonally Adjusted Annual Rate).
On COVID (focus on hospitalizations and deaths):
| COVID Metrics | ||||
|---|---|---|---|---|
| Now | Week Ago | Goal | ||
| Percent fully Vaccinated | 66.9% | --- | ≥70.0%1 | |
| Fully Vaccinated (millions) | 222.1 | --- | ≥2321 | |
| New Cases per Day3🚩 | 109,930 | 98,217 | ≤5,0002 | |
| Hospitalized3🚩 | 26,648 | 25,110 | ≤3,0002 | |
| Deaths per Day3🚩 | 317 | 289 | ≤502 | |
| 1 Minimum to achieve "herd immunity" (estimated between 70% and 85%). 2my goals to stop daily posts, 37-day average for Cases, Currently Hospitalized, and Deaths 🚩 Increasing 7-day average week-over-week for Cases, Hospitalized, and Deaths ✅ Goal met. | ||||
 Click on graph for larger image.
This graph shows the daily (columns) and 7-day average (line) of deaths reported.
Average daily deaths bottomed in July 2021 at 214 per day.
Fannie Mae: Mortgage Serious Delinquency Rate Decreased in May
by Calculated Risk on 6/30/2022 04:14:00 PM
Fannie Mae reported that the Single-Family Serious Delinquency decreased to 0.87% in May from 0.94% in April. The serious delinquency rate is down from 2.24% in May 2021. This is almost back to pre-pandemic levels.
These are mortgage loans that are "three monthly payments or more past due or in foreclosure".
The Fannie Mae serious delinquency rate peaked in February 2010 at 5.59% following the housing bubble and peaked at 3.32% in August 2020 during the pandemic.
 Click on graph for larger image
By vintage, for loans made in 2004 or earlier (1% of portfolio), 2.86% are seriously delinquent (down from 2.98% in April).
For loans made in 2005 through 2008 (1% of portfolio), 4.67% are seriously delinquent (down from 4.88%),
For recent loans, originated in 2009 through 2021 (97% of portfolio), 0.69% are seriously delinquent (down from 0.74%). So, Fannie is still working through a few poor performing loans from the bubble years.
Mortgages in forbearance are counted as delinquent in this monthly report, but they will not be reported to the credit bureaus.
The pandemic related increase in delinquencies was very different from the increase in delinquencies following the housing bubble. Lending standards had been fairly solid over the previous decade, and most of these homeowners had equity in their homes - and the vast majority of these homeowners have been able to restructure their loans once they were employed.
Freddie Mac reported earlier.


