 RSS Feed
 by Calculated Risk on 6/30/2022 09:00:00 PM
Thursday, June 30, 2022
Friday: ISM Manufacturing, Construction Spending, Vehicle Sales
Friday:
• At 10:00 AM ET, ISM Manufacturing Index for June. The consensus is for the ISM to be at 55.0, down from 56.1 in May.
• At 10:00 AM, Construction Spending for May. The consensus is for a 0.4% increase in construction spending.
• Late in the day, Light vehicle sales for June. The consensus is for light vehicle sales to be 13.6 million SAAR in June, up from 12.7 million in May (Seasonally Adjusted Annual Rate).
On COVID (focus on hospitalizations and deaths):
| COVID Metrics | ||||
|---|---|---|---|---|
| Now | Week Ago | Goal | ||
| Percent fully Vaccinated | 66.9% | --- | ≥70.0%1 | |
| Fully Vaccinated (millions) | 222.1 | --- | ≥2321 | |
| New Cases per Day3🚩 | 109,930 | 98,217 | ≤5,0002 | |
| Hospitalized3🚩 | 26,648 | 25,110 | ≤3,0002 | |
| Deaths per Day3🚩 | 317 | 289 | ≤502 | |
| 1 Minimum to achieve "herd immunity" (estimated between 70% and 85%). 2my goals to stop daily posts, 37-day average for Cases, Currently Hospitalized, and Deaths 🚩 Increasing 7-day average week-over-week for Cases, Hospitalized, and Deaths ✅ Goal met. | ||||
 Click on graph for larger image.
This graph shows the daily (columns) and 7-day average (line) of deaths reported.
Average daily deaths bottomed in July 2021 at 214 per day.
Fannie Mae: Mortgage Serious Delinquency Rate Decreased in May
by Calculated Risk on 6/30/2022 04:14:00 PM
Fannie Mae reported that the Single-Family Serious Delinquency decreased to 0.87% in May from 0.94% in April. The serious delinquency rate is down from 2.24% in May 2021. This is almost back to pre-pandemic levels.
These are mortgage loans that are "three monthly payments or more past due or in foreclosure".
The Fannie Mae serious delinquency rate peaked in February 2010 at 5.59% following the housing bubble and peaked at 3.32% in August 2020 during the pandemic.
 Click on graph for larger image
By vintage, for loans made in 2004 or earlier (1% of portfolio), 2.86% are seriously delinquent (down from 2.98% in April).
For loans made in 2005 through 2008 (1% of portfolio), 4.67% are seriously delinquent (down from 4.88%),
For recent loans, originated in 2009 through 2021 (97% of portfolio), 0.69% are seriously delinquent (down from 0.74%). So, Fannie is still working through a few poor performing loans from the bubble years.
Mortgages in forbearance are counted as delinquent in this monthly report, but they will not be reported to the credit bureaus.
The pandemic related increase in delinquencies was very different from the increase in delinquencies following the housing bubble. Lending standards had been fairly solid over the previous decade, and most of these homeowners had equity in their homes - and the vast majority of these homeowners have been able to restructure their loans once they were employed.
Freddie Mac reported earlier.
Las Vegas May 2022: Visitor Traffic Down 6.6% Compared to 2019
by Calculated Risk on 6/30/2022 03:52:00 PM
Note: I like using Las Vegas as a measure of recovery for both leisure (visitors) and business (conventions).
From the Las Vegas Visitor Authority: May 2022 Las Vegas Visitor Statistics
Visitation exceeded 3.4M visitors in May, surpassing last May by 19.8% and approx. 7% shy of May 2019.
Overall hotel occupancy reached 82.6%, 11.7 pts ahead of last May and down 8.2 pts vs. May 2019. Weekend occupancy again was in the 90's (91.9%, up 4.1 pts YoY and down 4.5 pts vs. May 2019) while Midweek occupancy exceeded 78% (up 16.0 pts YoY and down 9.3 pts vs. May 2019).
Following last month's record‐breaking ADR, May saw another month with ADR reaching nearly $176, 38.7% ahead of last May and over 25% above May 2019 while RevPAR exceeded $145 for the month, significantly ahead of May 2021 (+61.6%) and 13.8% over May 2019.
 Click on graph for larger image.
 The first graph shows visitor traffic for 2019 (dark blue), 2020 (light blue), 2021 (yellow) and 2022 (red)
Visitor traffic was down 6.6% compared to the same month in 2019.
Visitor traffic was up 20% compared to last May.
The second graph shows convention traffic.
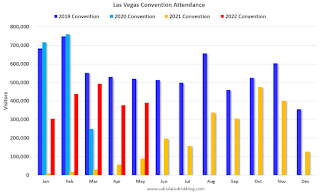
Convention traffic was down 24.9% compared to May 2019.The second graph shows convention traffic.

Note: There was almost no convention traffic from April 2020 through May 2021.
Hotels: Occupancy Rate Down 4.1% Compared to Same Week in 2019
by Calculated Risk on 6/30/2022 01:43:00 PM
U.S. hotel performance continued to climb with another weekly record established for revenue per available room (RevPAR) on a nominal basis, according to STR‘s latest data through 25 June.The following graph shows the seasonal pattern for the hotel occupancy rate using the four-week average.
June 19-25, 2022 (percentage change from comparable week in 2019*):
• Occupancy: 72.3% (-4.1%)
• Average daily rate (ADR): $157.05 (+17.1%)
• Revenue per available room (RevPAR): $113.55 (+12.3%)
*Due to the pandemic impact, STR is measuring recovery against comparable time periods from 2019.
emphasis added
 Click on graph for larger image.
The red line is for 2022, black is 2020, blue is the median, and dashed light blue is for 2021. Dashed purple is 2019 (STR is comparing to a strong year for hotels).
The 4-week average of the occupancy rate is at the median rate for the previous 20 years (Blue).
Note: Y-axis doesn't start at zero to better show the seasonal change.
The 4-week average of the occupancy rate will increase seasonally over the next couple of months.
Realtor.com Reports Weekly Inventory Up 25% Year-over-year
by Calculated Risk on 6/30/2022 09:51:00 AM
Today, in the Calculated Risk Real Estate Newsletter: Realtor.com Reports Weekly Inventory Up 25% Year-over-year
Excerpt:
Realtor.com has monthly and weekly data on the existing home market. Here is their weekly report released this morning from Chief Economist Danielle Hale: Weekly Housing Trends View — Data Week Ending June 25, 2022.. Note: They have data on list prices, new listings and more, but this focus is on inventory.• Active inventory continued to grow, rising 25% above one year ago. With more homeowners deciding to sell just as higher mortgage rates and prices are taking a big bite out of homebuyer purchasing power, the number of homes actively available to shoppers has made a quick about-face. Inventory was roughly even with last year’s levels at the beginning of May and the gains have mounted each week with this most recent week seeing five homes on the market for every four that a buyer at this time last year would have seen. Still, our June Housing Trends Report showed that the active listings count remained less than half its June 2019 level and just shy of two-thirds its June 2020 mark. Put another way, today’s shoppers have more options, but the market needs even more before the selection is on par with the pre-pandemic or even early-pandemic housing market....And here is a monthly graph from Realtor.com released today that shows their estimate of active inventory over the last six years. Note that inventory was declining rapidly for most of 2020, and it is very likely that inventory will be up compared to 2020 in Q3. (June 2022 is for mid-June, and inventory has increased further over the last two weeks).

There is much more in the article. You can subscribe at https://calculatedrisk.substack.com/
Personal Income increased 0.5% in May; Spending increased 0.2%
by Calculated Risk on 6/30/2022 08:42:00 AM
The BEA released the Personal Income and Outlays report for May:
Personal income increased $113.4 billion (0.5 percent) in May, according to the Bureau of Economic Analysis. Disposable personal income (DPI) increased $96.5 billion (0.5 percent) and personal consumption expenditures (PCE) increased $32.7 billion (0.2 percent).The May PCE price index increased 6.3 percent year-over-year (YoY), unchanged from 6.3 percent YoY in April.
Real DPI decreased 0.1 percent in May and Real PCE decreased 0.4 percent; goods decreased 1.6 percent and services increased 0.3 percent. The PCE price index increased 0.6 percent. Excluding food and energy, the PCE price index increased 0.3 percent (
emphasis added
The PCE price index, excluding food and energy, increased 4.7 percent YoY, down from 4.9% in April.
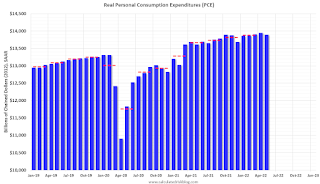
The following graph shows real Personal Consumption Expenditures (PCE) through May 2022 (2012 dollars). Note that the y-axis doesn't start at zero to better show the change.
 Click on graph for larger image.
The dashed red lines are the quarterly levels for real PCE.
Personal income was at expectations, and the increase in PCE was below expectations.
Inflation was at expectations.
Using the two-month method to estimate Q1 PCE growth, PCE was increasing at a 1.6% annual rate in Q2 2022. (Using the mid-month method, PCE was increasing at 0.7%).
Using the two-month method to estimate Q1 PCE growth, PCE was increasing at a 1.6% annual rate in Q2 2022. (Using the mid-month method, PCE was increasing at 0.7%).
Weekly Initial Unemployment Claims at 231,000
by Calculated Risk on 6/30/2022 08:33:00 AM
The DOL reported:
In the week ending June 25, the advance figure for seasonally adjusted initial claims was 231,000, a decrease of 2,000 from the previous week's revised level. The previous week's level was revised up by 4,000 from 229,000 to 233,000. The 4-week moving average was 231,750, an increase of 7,250 from the previous week's revised average. The previous week's average was revised up by 1,000 from 223,500 to 224,500.The following graph shows the 4-week moving average of weekly claims since 1971.
emphasis added
 Click on graph for larger image.
The dashed line on the graph is the current 4-week average. The four-week average of weekly unemployment claims increased to 231,750.
The previous week was revised up.
Weekly claims were higher than the consensus forecast.
Wednesday, June 29, 2022
Thursday: Personal Income & Outlays, Unemployment Claims, Chicago PMI
by Calculated Risk on 6/29/2022 08:31:00 PM
Thursday:
• Early, Census Bureau to Release Vintage 2021 Population Estimates (this might be delayed)
• At 8:30 AM, The initial weekly unemployment claims report will be released. The consensus is for 230 thousand up from 229 thousand last week.
• At 8:30 AM, Personal Income and Outlays, May 2022. The consensus is for a 0.5% increase in personal income, and for a 0.5% increase in personal spending. And for the Core PCE price index to increase 0.4%. PCE prices are expected to be up 6.2% YoY, and core PCE prices up 4.7% YoY.
• At 9:45 AM: Chicago Purchasing Managers Index for June.
On COVID (focus on hospitalizations and deaths):
| COVID Metrics | ||||
|---|---|---|---|---|
| Now | Week Ago | Goal | ||
| Percent fully Vaccinated | 66.9% | --- | ≥70.0%1 | |
| Fully Vaccinated (millions) | 222.1 | --- | ≥2321 | |
| New Cases per Day3🚩 | 108,505 | 99,702 | ≤5,0002 | |
| Hospitalized3🚩 | 26,232 | 25,023 | ≤3,0002 | |
| Deaths per Day3🚩 | 321 | 283 | ≤502 | |
| 1 Minimum to achieve "herd immunity" (estimated between 70% and 85%). 2my goals to stop daily posts, 37-day average for Cases, Currently Hospitalized, and Deaths 🚩 Increasing 7-day average week-over-week for Cases, Hospitalized, and Deaths ✅ Goal met. | ||||
 Click on graph for larger image.
This graph shows the daily (columns) and 7-day average (line) of deaths reported.
Average daily deaths bottomed in July 2021 at 214 per day.
Update: Framing Lumber Prices Down 21% Year-over-year; Still up Sharply from Pre-pandemic Levels
by Calculated Risk on 6/29/2022 01:22:00 PM
Here is another monthly update on framing lumber prices.
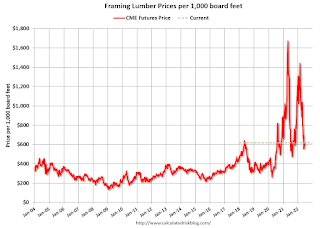
This graph shows CME random length framing futures through June 29th.
Lumber was at $618 per 1000 board feet this morning.
This is down from the peak of $1,733, and down 21% from $779 a year ago.
Prices are still up sharply from the pre-pandemic levels of around $400.
 Click on graph for larger image.
The slowdown in housing - and some supply improvement - has pushed down prices.
Several commodities are showing year-over-year price declines, and this will take some of the pressure off of inflation.
Prices are still up sharply from the pre-pandemic levels of around $400.
 Click on graph for larger image.
There is somewhat of a seasonal demand for lumber, and lumber prices usually peak in April or May (although it seems likely lumber prices peaked earlier this year).
The slowdown in housing - and some supply improvement - has pushed down prices.
Several commodities are showing year-over-year price declines, and this will take some of the pressure off of inflation.
Worst Housing Affordability" since 1991 excluding Bubble; Real House Prices and Price-to-Rent Ratio in April
by Calculated Risk on 6/29/2022 10:00:00 AM
Today, in the Calculated Risk Real Estate Newsletter: Worst Housing Affordability" since 1991 excluding Bubble
Excerpt:
I’ve put together my own affordability index - since 1976 - that is similar to the FirstAm approach (more of a house price index adjusted by mortgage rates and the median household income).
I used median income from the Census Bureau (estimated 2021 and 2022), assumed a 15% down payment, and used a 2% estimate for property taxes, insurance and maintenance. This is probably low for high property tax states like New Jersey and Texas, and too high for lower property tax states. If we were including condos, we’d also include HOA fees too (this is excluded).
For house prices, I used the Case-Shiller National Index, Seasonally Adjusted (SA). Also, for the down payment - there wasn’t a significant difference between 15% and 20%. For mortgage rates, I used the Freddie Mac PMMS (30-year fixed rates).
So here is what the index looks like (lower is more affordable like the FirstAm index):
Note that by this index, during the early ‘80s, homes were very unaffordable due to the very high mortgage rates. During the housing bubble, houses were also less affordable using 30-year mortgage rates, however, during the bubble, there were many “affordability products” that allowed borrowers to be qualified at the teaser rate (usually around 1%) that made houses seem more affordable.
In general, this would suggest houses are the least affordable since the housing bubble. And excluding the bubble - with all the “affordability products” - this is the worst affordability since 1989.
Look down to the second graph below (real house prices) and look what happened after 1989. It took more than a decade to return to 1989 prices in real terms.
Also, in April, the average 30-year mortgage rates were around 5.2%, and currently mortgage rates are close to 6.0% - so we already know the “Affordability Price Index” will increase further over the next couple of months (meaning houses are even less affordable).

There is much more in the article. You can subscribe at https://calculatedrisk.substack.com/


