 RSS Feed
 by Calculated Risk on 6/25/2022 02:11:00 PM
Saturday, June 25, 2022
Real Estate Newsletter Articles this Week
At the Calculated Risk Real Estate Newsletter this week:
• May New Home Sales Increase, Over 5 Months of Inventory Under Construction
• New Home Sales and Cancellations
• Final Look at Local Housing Markets in May
• NAR: Existing-Home Sales Decreased to 5.41 million SAAR in May
• Housing Completions will Increase Sharply in 2022
• 3rd Look at Local Housing Markets in May
This is usually published 4 to 6 times a week and provides more in-depth analysis of the housing market.
You can subscribe at https://calculatedrisk.substack.com/
Most content is available for free (and no Ads), but please subscribe!
Schedule for Week of June 26, 2022
by Calculated Risk on 6/25/2022 08:11:00 AM
The key reports this week are the third estimate of Q1 GDP, and Personal Income and Outlays for May.
Other key reports include the June ISM Manufacturing survey, June Vehicle Sales, and April Case-Shiller house prices.
For manufacturing, the June Richmond and Dallas Fed manufacturing surveys will be released.
8:30 AM: Durable Goods Orders for May from the Census Bureau. The consensus is for a 0.1% increase in durable goods orders.
10:00 AM: Pending Home Sales Index for May. The consensus is for a 2.0% decrease in the index.
10:30 AM: Dallas Fed Survey of Manufacturing Activity for June.
 9:00 AM: S&P/Case-Shiller House Price Index for April.
This graph shows the year-over-year change in the seasonally adjusted National Index, Composite 10 and Composite 20 indexes through the most recent report (the Composite 20 was started in January 2000).
The consensus is for a 21.0% year-over-year increase in the Comp 20 index for April.
9:00 AM: FHFA House Price Index for April 2021. This was originally a GSE only repeat sales, however there is also an expanded index.
10:00 AM: Richmond Fed Survey of Manufacturing Activity for June.
7:00 AM ET: The Mortgage Bankers Association (MBA) will release the results for the mortgage purchase applications index.
8:30 AM: Gross Domestic Product, 1st quarter 2022 (Third estimate). The consensus is that real GDP decreased 1.5% annualized in Q1, unchanged from the second estimate of a 1.5% decrease.
Early: Census Bureau to Release Vintage 2021 Population Estimates
8:30 AM: The initial weekly unemployment claims report will be released. The consensus is for 230 thousand up from 229 thousand last week.
8:30 AM ET: Personal Income and Outlays, May 2022. The consensus is for a 0.5% increase in personal income, and for a 0.5% increase in personal spending. And for the Core PCE price index to increase 0.4%. PCE prices are expected to be up 6.2% YoY, and core PCE prices up 4.7% YoY.
9:45 AM: Chicago Purchasing Managers Index for June.
10:00 AM: ISM Manufacturing Index for June. The consensus is for the ISM to be at 55.0, down from 56.1 in May.
10:00 AM: Construction Spending for May. The consensus is for a 0.4% increase in construction spending.
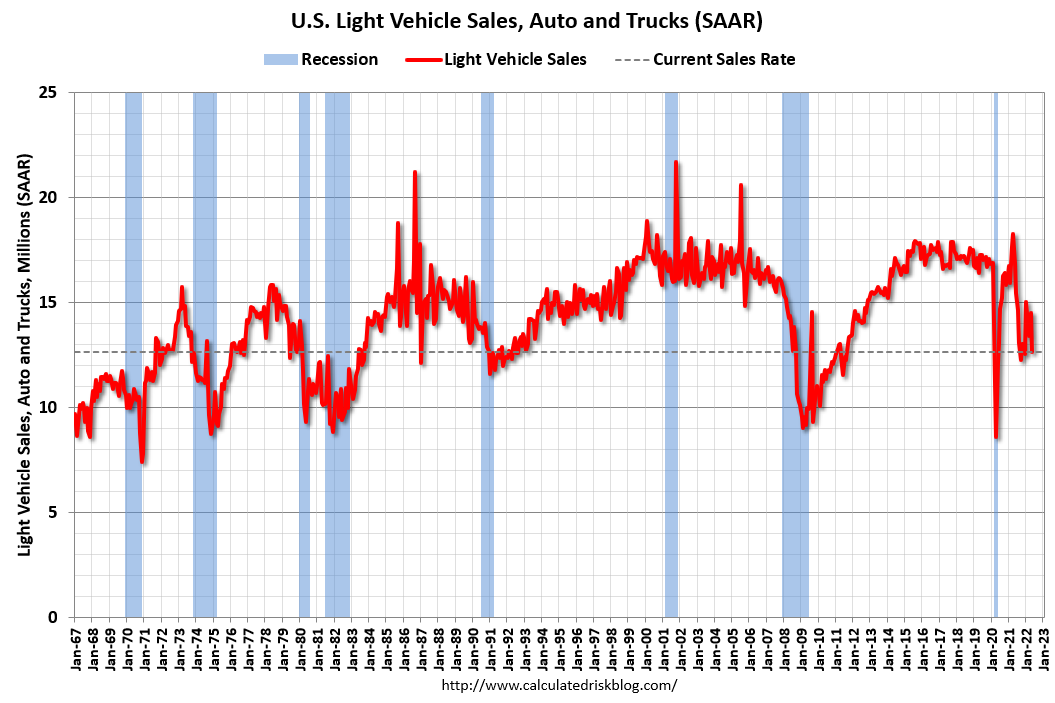 Late in the day: Light vehicle sales for June.
The consensus is for light vehicle sales to be 13.6 million SAAR in June, up from 12.7 million in May (Seasonally Adjusted Annual Rate).
This graph shows light vehicle sales since the BEA started keeping data in 1967. The dashed line is the sales rate for last month.
Wards Auto is forecasting sales of 13.3 million SAAR in June.
Friday, June 24, 2022
COVID June 24, 2022, Update on Cases, Hospitalizations and Deaths
by Calculated Risk on 6/24/2022 09:01:00 PM
On COVID (focus on hospitalizations and deaths):
| COVID Metrics | ||||
|---|---|---|---|---|
| Now | Week Ago | Goal | ||
| Percent fully Vaccinated | 66.9% | --- | ≥70.0%1 | |
| Fully Vaccinated (millions) | 222.1 | --- | ≥2321 | |
| New Cases per Day3 | 97,548 | 102,042 | ≤5,0002 | |
| Hospitalized3🚩 | 24,950 | 24,513 | ≤3,0002 | |
| Deaths per Day3 | 283 | 291 | ≤502 | |
| 1 Minimum to achieve "herd immunity" (estimated between 70% and 85%). 2my goals to stop daily posts, 37-day average for Cases, Currently Hospitalized, and Deaths 🚩 Increasing 7-day average week-over-week for Cases, Hospitalized, and Deaths ✅ Goal met. | ||||
 Click on graph for larger image.
This graph shows the daily (columns) and 7-day average (line) of deaths reported.
Average daily deaths bottomed in July 2021 at 214 per day.
Q2 GDP Forecasts: Fairly Wide Range
by Calculated Risk on 6/24/2022 01:32:00 PM
From BofA:
We continue to track 1.5% qoq saar growth for 2Q, unchanged from last week. We continue to forecast 2.3% GDP growth for 2022 and expect growth to slow to 1.4% and 0.8% in 2023 and 2024, respectively as the lagged effects of tighter monetary policy and financial conditions cool the economy. [June 24 estimate]From Goldman:
emphasis added
Following today’s data, we boosted our Q2 GDP tracking estimate by 0.1pp to +2.9% (qoq ar) [June 24 estimate]And from the Altanta Fed: GDPNow
The GDPNow model estimate for real GDP growth (seasonally adjusted annual rate) in the second quarter of 2022 is 0.0 percent on June 16, unchanged from June 15 after rounding. [June 16 estimate]
May New Home Sales Increase, Over 5 Months of Inventory Under Construction
by Calculated Risk on 6/24/2022 11:23:00 AM
Today, in the Calculated Risk Real Estate Newsletter: May New Home Sales Increase, Over 5 Months of Inventory Under Construction
Brief excerpt:
The next graph shows the months of supply by stage of construction. “Months of supply” is inventory at each stage, divided by the sales rate.You can subscribe at https://calculatedrisk.substack.com/.
There are just over 0.68 months of completed supply (red line). This is about half the normal level.
The inventory of new homes under construction is at 5.0 months (blue line) - well above the normal level. This elevated level of homes under construction is due to supply chain constraints. This is close to the record set in 1980.
And a record 115 thousand homes have not been started - about 2.0 months of supply (grey line) - almost double the normal level. Homebuilders are probably waiting to start some homes until they have a firmer grasp on prices and demand.

New Home Sales Increase to 696,000 Annual Rate in May
by Calculated Risk on 6/24/2022 10:09:00 AM
The Census Bureau reports New Home Sales in May were at a seasonally adjusted annual rate (SAAR) of 696 thousand.
The previous three months were revised up, combined.
Sales of new single‐family houses in May 2022 were at a seasonally adjusted annual rate of 696,000, according to estimates released jointly today by the U.S. Census Bureau and the Department of Housing and Urban Development. This is 10.7 percent above the revised April rate of 629,000, but is 5.9 percent below the May 2021 estimate of 740,000.
emphasis added
 Click on graph for larger image.
The first graph shows New Home Sales vs. recessions since 1963. The dashed line is the current sales rate.
New home sales are now at pre-pandemic levels.
The second graph shows New Home Months of Supply.
 The months of supply decreased in May to 7.7 months from 8.3 months in April.
 The all-time record high was 12.1 months of supply in January 2009. The all-time record low was 3.5 months, most recently in October 2020.
This is well above the top of the normal range (about 4 to 6 months of supply is normal).
"The seasonally‐adjusted estimate of new houses for sale at the end of May was 444,000. This represents a supply of 7.7 months at the current sales rate."
 The last graph shows sales NSA (monthly sales, not seasonally adjusted annual rate).
In May 2022 (red column), 63 thousand new homes were sold (NSA). Last year, 65 thousand homes were sold in May.
The all-time high for May was 120 thousand in 2005, and the all-time low for May was 26 thousand in 2010.
This was above expectations, and sales in the three previous months were revised up, combined. I'll have more later today.
Black Knight: "Past-Due Mortgages Fall to Third Consecutive Record Low in May"
by Calculated Risk on 6/24/2022 08:30:00 AM
From Black Knight: Black Knight’s First Look: Past-Due Mortgages Fall to Third Consecutive Record Low in May; Serious Delinquencies, Foreclosure Starts See Continued Improvement
• The national delinquency rate fell five basis points from April to 2.75% in May, continuing the downward trend in overall delinquencies of the prior two months and marking yet another new lowAccording to Black Knight's First Look report, the percent of loans delinquent decreased 1.9% in May compared to April and decreased 42% year-over-year.
• Following typical seasonal patterns, early-stage delinquencies – borrowers who have missed a single mortgage payment – edged marginally higher (+0.2%) month over month
• While serious delinquencies saw strong improvement, falling 7% from April, the population of such loans (those 90 or more days past due but not yet in foreclosure) remains 45% above pre-pandemic levels
• Despite elevated serious delinquency levels, foreclosure starts dropped 12% from April and continue to hold well below pre-pandemic levels while active foreclosures edged slightly higher
• Prepayment activity fell by 11.1% from the prior month and is now down 59.1% year over year on sharply higher interest rates
emphasis added
Black Knight reported the U.S. mortgage delinquency rate (loans 30 or more days past due, but not in foreclosure) was 2.75% in May, down from 2.80% in April.
The percent of loans in the foreclosure process increased in May to 0.33%, from 0.32% in April. This is increasing from very low levels due to the foreclosure moratoriums.
The number of delinquent properties, but not in foreclosure, is down 1,050,000 properties year-over-year, and the number of properties in the foreclosure process is up 26,000 properties year-over-year.
| Black Knight: Percent Loans Delinquent and in Foreclosure Process | ||||
|---|---|---|---|---|
| May 2022 | Apr 2022 | May 2021 | May 2020 | |
| Delinquent | 2.75% | 2.80% | 4.73% | 7.76% |
| In Foreclosure | 0.33% | 0.32% | 0.28% | 0.38% |
| Number of properties: | ||||
| Number of properties that are delinquent, but not in foreclosure: | 1,461,000 | 1,496,000 | 2,511,000 | 4,123,000 |
| Number of properties in foreclosure pre-sale inventory: | 174,000 | 173,000 | 148,000 | 200,000 |
| Total Properties | 1,635,000 | 1,669,000 | 2,659,000 | 4,323,000 |
Thursday, June 23, 2022
Friday: New Home Sales
by Calculated Risk on 6/23/2022 08:42:00 PM
 Mortgage rates have fallen from 6.28% just over one week ago to 5.75% today.
Friday:
• At 10:00 AM ET, New Home Sales for May from the Census Bureau. The consensus is for 580 thousand SAAR, down from 591 thousand in April.
• Also, at 10:00 AM, University of Michigan's Consumer sentiment index (Final for June). The consensus is for a reading of 50.2.
On COVID (focus on hospitalizations and deaths):
| COVID Metrics | ||||
|---|---|---|---|---|
| Now | Week Ago | Goal | ||
| Percent fully Vaccinated | 66.8% | --- | ≥70.0%1 | |
| Fully Vaccinated (millions) | 221.9 | --- | ≥2321 | |
| New Cases per Day3 | 97,430 | 103,175 | ≤5,0002 | |
| Hospitalized3🚩 | 24,831 | 24,358 | ≤3,0002 | |
| Deaths per Day3 | 255 | 285 | ≤502 | |
| 1 Minimum to achieve "herd immunity" (estimated between 70% and 85%). 2my goals to stop daily posts, 37-day average for Cases, Currently Hospitalized, and Deaths 🚩 Increasing 7-day average week-over-week for Cases, Hospitalized, and Deaths ✅ Goal met. | ||||
 Click on graph for larger image.
This graph shows the daily (columns) and 7-day average (line) of deaths reported.
Average daily deaths bottomed in July 2021 at 214 per day.
Fed: Banks Pass Annual Stress Test
by Calculated Risk on 6/23/2022 04:40:00 PM
From the Federal Reserve: Federal Reserve Board releases results of annual bank stress test, which show that banks continue to have strong capital levels, allowing them to continue lending to households and businesses during a severe recession
The Federal Reserve Board on Thursday released the results of its annual bank stress test, which showed that banks continue to have strong capital levels, allowing them to continue lending to households and businesses during a severe recession.Test results here.
All banks tested remained above their minimum capital requirements, despite total projected losses of $612 billion. Under stress, the aggregate common equity capital ratio—which provides a cushion against losses—is projected to decline by 2.7 percentage points to a minimum of 9.7 percent, which is still more than double the minimum requirement.
Realtor.com Reports Weekly Inventory Up 21% Year-over-year
by Calculated Risk on 6/23/2022 03:01:00 PM
Realtor.com has monthly and weekly data on the existing home market. Here is their weekly report released yesterday from Chief Economist Danielle Hale: Weekly Housing Trends View — Data Week Ending June 18, 2022. Note: They have data on list prices, new listings and more, but this focus is on inventory.
• New listings–a measure of sellers putting homes up for sale–were up 6% above one year ago. Home sellers in many markets across the country continue to benefit from rising home prices and fast-selling homes. That’s prompted a growing number of homeowners to sell homes this year compared to last, giving home shoppers much needed options. We’ve seen more homes come up for sale this year compared to last year in 11 of the last 12 weeks.
• Active inventory continued to grow, rising 21% above one year ago. Inventory was roughly even with last year’s levels at the beginning of May and the gains have mounted each week. Still, our May Housing Trends Report showed that the active listings count remained nearly 50 percent below its level at the beginning of the pandemic. In other words, we’re starting to add more options, but the market needs even more before home shoppers have a selection that’s roughly equivalent to the pre-pandemic housing market.
 Here is a graph of the year-over-year change in inventory according to realtor.com.
 Note the rapid increase in the YoY change, from down 30% at the beginning of the year, to up 21% YoY now. It will be important to watch if that trend continues.
Also note the possible pickup in new listings. This is something I highlighted in Final Look at Local Housing Markets in May


