 RSS Feed
 by Calculated Risk on 6/17/2022 09:01:00 PM
Friday, June 17, 2022
COVID June 17, 2022, Update on Cases, Hospitalizations and Deaths
On COVID (focus on hospitalizations and deaths):
| COVID Metrics | ||||
|---|---|---|---|---|
| Now | Week Ago | Goal | ||
| Percent fully Vaccinated | 66.8% | --- | ≥70.0%1 | |
| Fully Vaccinated (millions) | 221.9 | --- | ≥2321 | |
| New Cases per Day3 | 100,733 | 109,098 | ≤5,0002 | |
| Hospitalized3🚩 | 24,201 | 23,686 | ≤3,0002 | |
| Deaths per Day3 | 266 | 326 | ≤502 | |
| 1 Minimum to achieve "herd immunity" (estimated between 70% and 85%). 2my goals to stop daily posts, 37-day average for Cases, Currently Hospitalized, and Deaths 🚩 Increasing 7-day average week-over-week for Cases, Hospitalized, and Deaths ✅ Goal met. | ||||
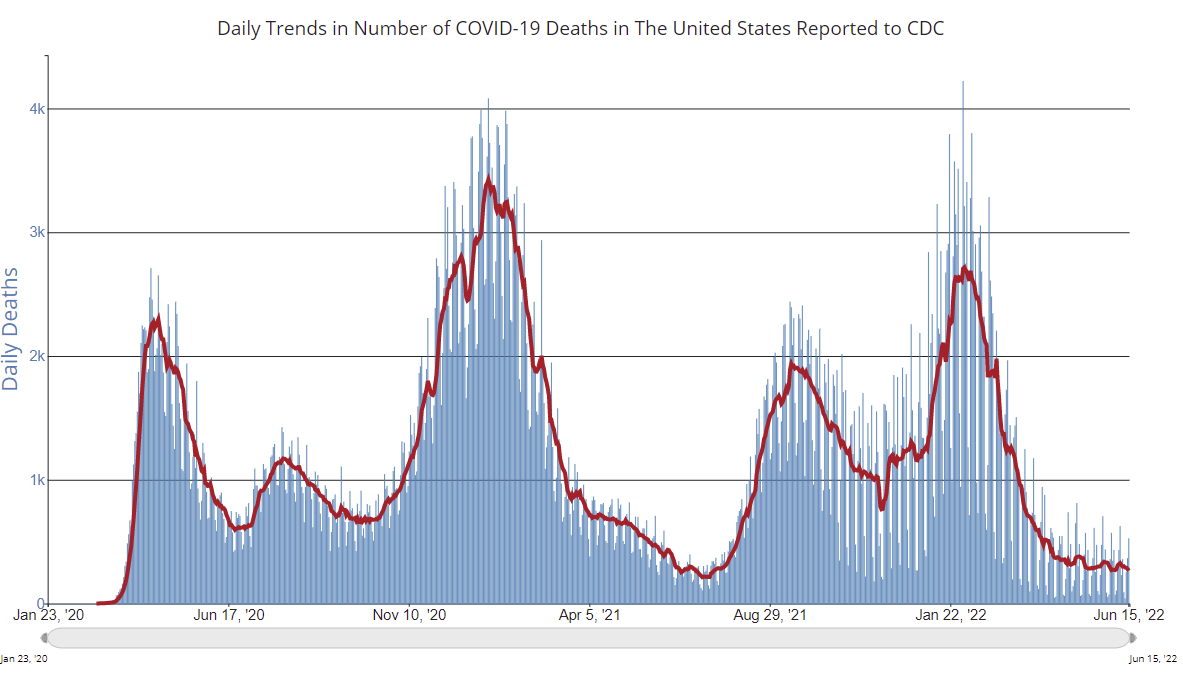 Click on graph for larger image.
This graph shows the daily (columns) and 7-day average (line) of deaths reported.
Average daily deaths bottomed in July 2021 at 214 per day.
Realtor.com Reports Weekly Inventory Up 17% Year-over-year
by Calculated Risk on 6/17/2022 04:16:00 PM
Realtor.com has monthly and weekly data on the existing home market. Here is their weekly report released yesterday from Chief Economist Danielle Hale: Weekly Housing Trends View — Data Week Ending June 11, 2022. Note: They have data on list prices, new listings and more, but this focus is on inventory.
• Active inventory continued to grow, rising 17% above one year ago. Inventory was roughly even with last year’s levels at the beginning of May and the gains have mounted each week. Still, our May Housing Trends Report showed that the active listings count remained nearly 50 percent below its level at the beginning of the pandemic. In other words, we’re starting to add more options, but the market needs even more before home shoppers have a selection that’s roughly equivalent to the pre-pandemic housing market.
 Here is a graph of the year-over-year change in inventory according to realtor.com.
 Note the rapid increase in the YoY change, from down 30% at the beginning of the year, to up 17% YoY now. It will be important to watch if that trend continues.
Q2 GDP Forecasts: Moving Down
by Calculated Risk on 6/17/2022 01:11:00 PM
From BofA:
We are now tracking 1.5% qoq saar growth for 2Q, down from 2.5% qoq saar previously as retail sales were weak in May. [June 17 estimate]From Goldman:
emphasis added
We left our Q2 GDP tracking estimate unchanged at +2.8% (qoq ar). (Lowered it yesterday from 3.0%) [June 17 estimate]And from the Altanta Fed: GDPNow
The GDPNow model estimate for real GDP growth (seasonally adjusted annual rate) in the second quarter of 2022 is 0.0 percent on June 16, unchanged from June 15 after rounding. [June 16 estimate]
Slowdown in Showings, Sharp Decline in California Pending Sales, Inventory Surges
by Calculated Risk on 6/17/2022 10:43:00 AM
Today, in the Calculated Risk Real Estate Newsletter: Slowdown in Showings, Sharp Decline in California Pending Sales, Inventory Surges
A brief excerpt:
The following data is courtesy of David Arbit, Director of Research at the Minneapolis Area REALTORS® and NorthstarMLS (posted with permission). Here is a link to their data.There is much more in the article. You can subscribe at https://calculatedrisk.substack.com/
This graph shows the 7-day average showings for the Twin Cities area for 2019, 2020, 2021, and 2022. The 7-day average showings (red) is currently off 22% from 2019.
There was a huge dip in showings in 2020 (black) at the start of the pandemic, and then showing were well above 2019 (blue) levels for the rest of the year. And showings in 2021 (gold) were very strong in the first half of the year, and then were closer to 2019 in the 2nd half.
Click on graph for larger image.
Note that there were dips in showings during holidays (July 4th, Memorial Day, Thanksgiving and Christmas), and also dips related to protests and curfews related to the deaths of George Floyd and Daunte Wright.
2022 (red) started off solid but is now below the previous three years.

Industrial Production Increased 0.2 Percent in May
by Calculated Risk on 6/17/2022 09:21:00 AM
From the Fed: Industrial Production and Capacity Utilization
Total industrial production moved up 0.2 percent in May. Output has increased in every month of the year so far, with an average monthly gain of nearly 0.8 percent. In May, manufacturing output declined 0.1 percent after three months when growth averaged nearly 1 percent; the indexes for utilities and mining rose 1.0 percent and 1.3 percent, respectively, in May. At 105.7 percent of its 2017 average, total industrial production in May was 5.8 percent above its year-earlier level. Capacity utilization edged up to 79.0 percent, 0.5 percentage point below its long-run (1972–2021) average.
emphasis added
 Click on graph for larger image.
This graph shows Capacity Utilization. This series is up from the record low set in April 2020, and above the level in February 2020 (pre-pandemic).
Capacity utilization at 79.0% is 0.5% below the average from 1972 to 2020. This was below consensus expectations.
Note: y-axis doesn't start at zero to better show the change.
 The second graph shows industrial production since 1967.
Industrial production increased in May to 105.7. This is above the pre-pandemic level.
The change in industrial production was below consensus expectations.
Thursday, June 16, 2022
Friday: Industrial Production
by Calculated Risk on 6/16/2022 09:02:00 PM
Friday:
• At 9:15 AM ET, The Fed will release Industrial Production and Capacity Utilization for May. The consensus is for a 0.4% increase in Industrial Production, and for Capacity Utilization to increase to 79.2%.
• At 10:00 AM, State Employment and Unemployment (Monthly) for May 2022
On COVID (focus on hospitalizations and deaths):
| COVID Metrics | ||||
|---|---|---|---|---|
| Now | Week Ago | Goal | ||
| Percent fully Vaccinated | 66.8% | --- | ≥70.0%1 | |
| Fully Vaccinated (millions) | 221.9 | --- | ≥2321 | |
| New Cases per Day3 | 102,750 | 109,841 | ≤5,0002 | |
| Hospitalized3🚩 | 24,160 | 23,598 | ≤3,0002 | |
| Deaths per Day3 | 265 | 326 | ≤502 | |
| 1 Minimum to achieve "herd immunity" (estimated between 70% and 85%). 2my goals to stop daily posts, 37-day average for Cases, Currently Hospitalized, and Deaths 🚩 Increasing 7-day average week-over-week for Cases, Hospitalized, and Deaths ✅ Goal met. | ||||
Click on graph for larger image.This graph shows the daily (columns) and 7-day average (line) of deaths reported.
Average daily deaths bottomed in July 2021 at 214 per day.
Lawler: Early Read on Existing Home Sales in May
by Calculated Risk on 6/16/2022 03:33:00 PM
From housing economist Tom Lawler:
Based on publicly-available local realtor/MLS reports released across the country through today, I project that existing home sales as estimated by the National Association of Realtors ran at a seasonally adjusted annual rate of 5.35 million in May, down 4.6% from April’s preliminary pace and down 9.6% from last May’s seasonally adjusted pace. Unadjusted sales should show a smaller YOY % decline, reflecting this May’s higher business-day count compared to last May’s.
Local realtor reports, as well as reports from national inventory trackers, suggest that the inventory of existing homes for sale last month was up slightly from a year earlier. However, the NAR’s estimate may not show the same increase as other reports, many of which exclude listings with pending contracts. E.g., the Realtor.com report for May showed that listings excluding those with pending contracts were up 8.0% from last May, while listings including pending contracts were down 3.9% YOY. (Pending listings in the Realtor.com report were down 12.2% from last May.). The NAR’s inventory estimate has tracked the Realtor.com total inventory measure more closely that the “ex-pendings” inventory measure. (Note also that the Realtor.com inventory number reflects average listings during the month, while the NAR inventory number is an end-of-month estimate.)
Finally, local realtor/MLS reports suggest the median existing single-family home sales price last month was up by about 14.7% from last May.
CR Note: The National Association of Realtors (NAR) is scheduled to release May existing home sales on Tuesday, June 21, 2022, at 10:00 AM ET. The consensus is for 5.41 million SAAR.
Hotels: Occupancy Rate Down 4.1% Compared to Same Week in 2019
by Calculated Risk on 6/16/2022 01:42:00 PM
U.S. hotel performance jumped from the previous week, and revenue per available room (RevPAR) reached an all-time weekly high on a nominal basis, according to STR‘s latest data through June 11.The following graph shows the seasonal pattern for the hotel occupancy rate using the four-week average.
June 5-11, 2022 (percentage change from comparable week in 2019*):
• Occupancy: 70.6% (-4.1%)
• Average daily rate (ADR): $155.37 (+15.4%)
• Revenue per available room (RevPAR): $109.76 (+10.7%)
*Due to the pandemic impact, STR is measuring recovery against comparable time periods from 2019.
emphasis added
 Click on graph for larger image.
The red line is for 2022, black is 2020, blue is the median, and dashed light blue is for 2021. Dashed purple is 2019 (STR is comparing to a strong year for hotels).
The 4-week average of the occupancy rate is above the median rate for the previous 20 years (Blue).
Note: Y-axis doesn't start at zero to better show the seasonal change.
The 4-week average of the occupancy rate will increase over the summer.
May Housing Starts: All-Time Record Housing Units Under Construction
by Calculated Risk on 6/16/2022 09:20:00 AM
Today, in the CalculatedRisk Real Estate Newsletter: May Housing Starts: All-Time Record Housing Units Under Construction
Excerpt:
Yesterday, Fed Chair Powell started to mention the record number of housing units under construction, see: Fed Chair Powell: "Homebuyers need a bit of a reset"There is much more in the post. You can subscribe at https://calculatedrisk.substack.com/ (Most content is available for free, so please subscribe).“How much will it affect housing prices? Not really sure. Obviously, we are watching that quite carefully. You’d think over time … There is a tremendous amount of supply in the housing market of unfinished homes … and as those come online …”And then he quickly changed direction. Perhaps he was concerned about spooking homebuyers about the coming increase in new supply.
The fourth graph shows housing starts under construction, Seasonally Adjusted (SA).
Red is single family units. Currently there are 822 thousand single family units under construction (SA). This matches last month as the highest level since November 2006. The reason there are so many homes is probably due to construction delays.
Blue is for 2+ units. Currently there are 843 thousand multi-family units under construction. This is the highest level since April 1974! For multi-family, construction delays are probably also a factor. The completion of these units should help with rent pressure.
Combined, there are a record 1.665 million units under construction. This above the previous record of 1.628 million units that were under construction in 1973 (mostly apartments in 1973 for the baby boom generation).

Housing Starts Decreased to 1.549 million Annual Rate in May
by Calculated Risk on 6/16/2022 08:42:00 AM
From the Census Bureau: Permits, Starts and Completions
Housing Starts:
Privately‐owned housing starts in May were at a seasonally adjusted annual rate of 1,549,000. This is 14.4 percent below the revised April estimate of 1,810,000 and is 3.5 percent below the May 2021 rate of 1,605,000. Single‐family housing starts in May were at a rate of 1,051,000; this is 9.2 percent below the revised April figure of 1,157,000. The May rate for units in buildings with five units or more was 469,000
Building Permits:
Privately‐owned housing units authorized by building permits in May were at a seasonally adjusted annual rate of 1,695,000. This is 7.0 percent below the revised April rate of 1,823,000, but is 0.2 percent above the May 2021 rate of 1,691,000. Single‐family authorizations in May were at a rate of 1,048,000; this is 5.5 percent below the revised April figure of 1,109,000. Authorizations of units in buildings with five units or more were at a rate of 592,000 in May.
emphasis added
 Click on graph for larger image.
The first graph shows single and multi-family housing starts for the last several years.
Multi-family starts (blue, 2+ units) decreased in May compared to April. Multi-family starts were unchanged year-over-year in May.
Single-family starts (red) decreased in May and were down 5.3% year-over-year.
 The second graph shows single and multi-family housing starts since 1968.
 This shows the huge collapse following the housing bubble, and then the eventual recovery (but still not historically high).
Total housing starts in May were well below expectations, however, starts in March and April, were revised up, combined.
I'll have more later …


