 RSS Feed
 by Calculated Risk on 6/14/2022 11:34:00 AM
Tuesday, June 14, 2022
Comparing the Current Housing Market to the 1978 to 1982 period
Today, in the Calculated Risk Real Estate Newsletter: Comparing the Current Housing Market to the 1978 to 1982 period
A brief excerpt:
In the 1978 to 1982 period, demographics were very favorable for homebuying as the baby boomers moved into the first-time homebuying age group (similar to the millennials now).There is much more in the article. You can subscribe at https://calculatedrisk.substack.com/
This graph shows the longer-term trend for three key age groups: 20 to 29, 25 to 34, and 30 to 39 (the groups overlap). This graph is from 1960 to 2060 (all data from Census: current to 2060 is projected).
We can see the surge in the 20 to 29 age group last decade (red). Once this group exceeded the peak in earlier periods, there was an increase in apartment construction. This age group peaked in 2018 / 2019 (until the 2030s), and the 25 to 34 age group (orange, dashed) will peak around 2023.
For buying, the 30 to 39 age group (blue) is important. The population in this age group is increasing and will increase further over this decade.
When we look back at the 1978 to 1982 period, the 30 to 39 age group (blue) was increasing even more than today.

A Very Early Look at 2023 Cost-Of-Living Adjustments and Maximum Contribution Base
by Calculated Risk on 6/14/2022 09:55:00 AM
The BLS reported on Friday:
The Consumer Price Index for Urban Wage Earners and Clerical Workers (CPI-W) increased 9.3 percent over the last 12 months to an index level of 288.022 (1982-84=100). For the month, the index rose 1.2 percent prior to seasonal adjustment.CPI-W is the index that is used to calculate the Cost-Of-Living Adjustments (COLA). The calculation dates have changed over time (see Cost-of-Living Adjustments), but the current calculation uses the average CPI-W for the three months in Q3 (July, August, September) and compares to the average for the highest previous average of Q3 months. Note: this is not the headline CPI-U and is not seasonally adjusted (NSA).
• In 2021, the Q3 average of CPI-W was 268.421.
The 2021 Q3 average was the highest Q3 average, so we only have to compare Q3 this year to last year.
 Click on graph for larger image.
This graph shows CPI-W since January 2000. The red lines are the Q3 average of CPI-W for each year.
Note: The year labeled is for the calculation, and the adjustment is effective for December of that year (received by beneficiaries in January of the following year).
CPI-W was up 9.3% year-over-year in May, and although this is very early - we need the data for July, August and September - my very early guess is COLA will probably be close to 9% this year, the largest increase since 11.2% in 1981.
Contribution and Benefit Base
The contribution base will be adjusted using the National Average Wage Index. This is based on a one-year lag. The National Average Wage Index is not available for 2021 yet, but wages probably increased again in 2021. If wages increased 4% in 2021, then the contribution base next year will increase to around $153,000 in 2023, from the current $147,000.
Remember - this is a very early look. What matters is average CPI-W, NSA, for all three months in Q3 (July, August and September).
BLS: PPI increased 0.8% in May; Core PPI increased 0.5%
by Calculated Risk on 6/14/2022 08:33:00 AM
The Producer Price Index for final demand increased 0.8 percent in May, seasonally adjusted, the U.S. Bureau of Labor Statistics reported today. ... On an unadjusted basis, final demand prices moved up 10.8 percent for the 12 months ended in May.The consensus was for 0.8% increase in PPI, and a 0.6% increase in core PPI. PPI was at expectations, and core PPI was slightly below expectations.
...
Prices for final demand less foods, energy, and trade services moved up 0.5 percent in May after increasing 0.4 percent in April. For the 12 months ended in May, the index for final demand less foods, energy, and trade services rose 6.8 percent.
emphasis added
Monday, June 13, 2022
Goldman Expects 75bp Rate Hike
by Calculated Risk on 6/13/2022 08:48:00 PM
From Goldman Sachs chief economist Jan Hatzius
"We have revised our forecast to include 75bp hikes in June and July. This would quickly reset the level of the funds rate at 2.25-2.5%, the FOMC’s median estimate of the neutral rate."Tuesday:
emphasis added
• At 6:00 AM ET, NFIB Small Business Optimism Index for May.
• At 8:30 AM, The Producer Price Index for May from the BLS. The consensus is for a 0.8% increase in PPI, and a 0.6% increase in core PPI.
On COVID (focus on hospitalizations and deaths):
| COVID Metrics | ||||
|---|---|---|---|---|
| Now | Week Ago | Goal | ||
| Percent fully Vaccinated | 66.8% | --- | ≥70.0%1 | |
| Fully Vaccinated (millions) | 221.7 | --- | ≥2321 | |
| New Cases per Day3🚩 | 103,821 | 99,621 | ≤5,0002 | |
| Hospitalized3 | 21,746 | 22,956 | ≤3,0002 | |
| Deaths per Day3🚩 | 276 | 266 | ≤502 | |
| 1 Minimum to achieve "herd immunity" (estimated between 70% and 85%). 2my goals to stop daily posts, 37-day average for Cases, Currently Hospitalized, and Deaths 🚩 Increasing 7-day average week-over-week for Cases, Hospitalized, and Deaths ✅ Goal met. | ||||
 Click on graph for larger image.
This graph shows the daily (columns) and 7-day average (line) of deaths reported.
Average daily deaths bottomed in July 2021 at 214 per day.
30-Year Mortgage Rates Increase to 6.13%
by Calculated Risk on 6/13/2022 03:21:00 PM
 From Matthew Graham at MortgageNewsDaily: MBS Live Morning: From Bad to Worse as CPI Reaction Continues
Bonds are in the midst of a full-blown capitulation move with 10yr yields currently up over 16bps at 3.32%. MBS are down roughly a full point. These aren't the biggest losses we've ever seen in a day, but they're extraordinarily big losses to be experiencing at the top of trend that has already covered as much ground as the one seen so far in 2022.
...
Long story short, the market is freaked out about what Friday means for the policy outlook. Wednesday continues to be one of the biggest flashpoints for bond volatility we've seen in a long time.
 Click on graph for larger image.
This is a graph from Mortgage News Daily (MND) showing 30-year fixed rates from three sources (MND, MBA, Freddie Mac) over the last year.
The 30-year fixed rate for top tier scenarios was 6.13% today, up from 5.55% last Thursday.
Go to MND and you can adjust the graph for different time periods.
2nd Look at Local Housing Markets in May, New Listings picking up
by Calculated Risk on 6/13/2022 12:10:00 PM
Today, in the Calculated Risk Real Estate Newsletter: 2nd Look at Local Housing Markets in May, New Listings picking up
A brief excerpt:
This is the second look at local markets in May. I’m tracking about 35 local housing markets in the US. Some of the 35 markets are states, and some are metropolitan areas. I’ll update these tables throughout the month as additional data is released.There is much more in the article. You can subscribe at https://calculatedrisk.substack.com/
We are seeing a significant change in inventory, and maybe a pickup in new listings. So far, most of the increase in inventory has been due to softer demand - likely because of higher mortgage rates - but we need to keep an eye on new listings too.
On a national basis, we saw record low inventory levels over the Winter. Last year, inventory didn’t bottom seasonally until early April. This year inventory bottomed in February (normal seasonal timing), and recent data from Altos Research and Realtor.com, indicate active inventory was up year-over-year in May. I expect the local market reports will show inventory up year-over-year in May too.
...
And here is a table for new listings in May. For these areas, new listings were up 5.0% YoY. Last month, new listings in these markets were down 6.2% YoY. This could be a significant change, and the first sign of a pickup in new listings. If new listings increase, combined with less demand, we will see active inventory increase quickly.Notes for all tables:
1) New additions to table in BOLD.
2) Northwest (Seattle), North Texas (Dallas) and Santa Clara (San Jose), Mid-Florida (Tampa, Orlando), Jacksonville, Source: Northeast Florida Association of REALTORS®
3) Totals do not include Denver or Atlanta (included in state totals).

Housing Inventory June 13th Update: Inventory up 15.9% Year-over-year
by Calculated Risk on 6/13/2022 09:53:00 AM
Altos reports inventory is up 15.9% year-over-year.
Inventory usually declines in the winter, and then increases in the spring. Inventory bottomed seasonally at the beginning of March 2022 and is now up 64% since then.
 Click on graph for larger image in graph gallery.
This inventory graph is courtesy of Altos Research.
As of June 10th, inventory was at 396 thousand (7-day average), compared to 375 thousand the prior week. Inventory was up 5.6% from the previous week.
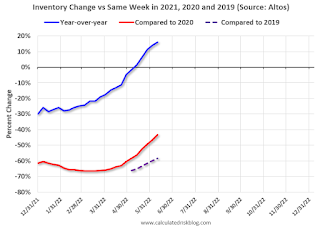
Inventory is still very low. Compared to the same week in 2021, inventory is up 15.9% from 342 thousand, however compared to the same week in 2020 inventory is down 43.2% from 698 thousand. Compared to 3 years ago, inventory is down 58.3% from 950 thousand.
Inventory is still very low. Compared to the same week in 2021, inventory is up 15.9% from 342 thousand, however compared to the same week in 2020 inventory is down 43.2% from 698 thousand. Compared to 3 years ago, inventory is down 58.3% from 950 thousand.
Here are the inventory milestones I’m watching for with the Altos data:
1. The seasonal bottom (happened on March 4th for Altos) ✅
2. Inventory up year-over-year (happened on May 13th for Altos) ✅
3. Inventory up compared to two years ago (currently down 43.2% according to Altos)
4. Inventory up compared to 2019 (currently down 58.2%).
1. The seasonal bottom (happened on March 4th for Altos) ✅
2. Inventory up year-over-year (happened on May 13th for Altos) ✅
3. Inventory up compared to two years ago (currently down 43.2% according to Altos)
4. Inventory up compared to 2019 (currently down 58.2%).

Here is a graph of the inventory change vs 2021, 2020 (milestone 3 above) and 2019 (milestone 4).
The blue line is the year-over-year data, the red line is compared to two years ago, and dashed purple is compared to 2019.
Two years ago (in 2020) inventory was declining all year, so the two-year comparison will get easier all year. My current guess is inventory will be up in Q4 compared to the same week in 2020.
Mike Simonsen discusses this data regularly on Youtube.
Five High Frequency Indicators for the Economy
by Calculated Risk on 6/13/2022 08:26:00 AM
These indicators are mostly for travel and entertainment. It is interesting to watch these sectors recover as the pandemic subsides. Notes: I've added back gasoline supplied to see if there is an impact from higher gasoline prices. Apple has discontinued "Apple mobility", and restaurant traffic is mostly back to normal.
The TSA is providing daily travel numbers.
This data is as of June 12th.
 Click on graph for larger image.
This data shows the 7-day average of daily total traveler throughput from the TSA for 2019 (Light Blue), 2020 (Black), 2021 (Blue) and 2022 (Red).
The dashed line is the percent of 2019 for the seven-day average.
The 7-day average is down 12.6% from the same day in 2019 87.4% of 2019). (Dashed line)
Air travel has been moving sideways over the last several months, off about 10% from 2019.
 This data shows domestic box office for each week and the median for the years 2016 through 2019 (dashed light blue).
 Black is 2020, Blue is 2021 and Red is 2022.
The data is from BoxOfficeMojo through June 9th.
Note that the data is usually noisy week-to-week and depends on when blockbusters are released.
Movie ticket sales were at $185 million last week, down about 26% from the median for the week.
Note that the data is usually noisy week-to-week and depends on when blockbusters are released.
Movie ticket sales were at $185 million last week, down about 26% from the median for the week.
 This graph shows the seasonal pattern for the hotel occupancy rate using the four-week average.
 The red line is for 2022, black is 2020, blue is the median, and dashed light blue is for 2021. Dashed purple is 2019 (STR is comparing to a strong year for hotels).
This data is through June 4th. The occupancy rate was down 12.1% compared to the same week in 2019.
The 4-week average of the occupancy rate is slightly above the median rate for the previous 20 years (Blue).
Notes: Y-axis doesn't start at zero to better show the seasonal change.
Notes: Y-axis doesn't start at zero to better show the seasonal change.
 This graph, based on weekly data from the U.S. Energy Information Administration (EIA), shows gasoline supplied compared to the same week of 2019.
Blue is for 2020. Purple is for 2021, and Red is for 2022.
As of June 3rd, gasoline supplied was down 2.6% compared to the same week in 2019.
Recently gasoline supplied has been running somewhat below 2019 levels.
Here is some interesting data on New York subway usage (HT BR).
 This graph is from Todd W Schneider.
 This graph shows how much MTA traffic has recovered in each borough (Graph starts at first week in January 2020 and 100 = 2019 average).
Manhattan is at about 39% of normal.
This data is through Friday, June 10th.
He notes: "Data updates weekly from the MTA’s public turnstile data, usually on Saturday mornings".
Sunday, June 12, 2022
Sunday Night Futures
by Calculated Risk on 6/12/2022 07:09:00 PM
Weekend:
• Schedule for Week of June 12, 2022
Monday:
• No major economic releases scheduled.
From CNBC: Pre-Market Data and Bloomberg futures S&P 500 futures are down 37, and DOW futures are down 156 (fair value).
Oil prices were mixed over the last week with WTI futures at $118.73 per barrel and Brent at $120.00 per barrel. A year ago, WTI was at $69 and Brent was at $71 - so WTI oil prices are up 70% year-over-year.
Here is a graph from Gasbuddy.com for nationwide gasoline prices. Nationally prices are at $5.01 per gallon. A year ago prices were at $3.07 per gallon, so gasoline prices are up $1.94 per gallon year-over-year.
FOMC Preview: 50bp Hike
by Calculated Risk on 6/12/2022 09:41:00 AM
Update: From Goldman Sachs chief economist Jan Hatzius
"We have revised our forecast to include 75bp hikes in June and July. This would quickly reset the level of the funds rate at 2.25-2.5%, the FOMC’s median estimate of the neutral rate."Expectations are the FOMC will announce a 50bp rate increase in the federal funds rate at the meeting this week.
emphasis added
From Merrill Lynch:
1 Projections of change in real GDP and inflation are from the fourth quarter of the previous year to the fourth quarter of the year indicated.
The unemployment rate was at 3.6% in May. The question is: Will the slowdown in economic growth push up the unemployment rate? Or will the rate continue to decline? The projections for the unemployment rate will likely be mostly unchanged.
2 Projections for the unemployment rate are for the average civilian unemployment rate in the fourth quarter of the year indicated.
As of April 2022, PCE inflation was up 6.3% from April 2021. This was below the cycle high of 6.6%. Based on recent readings, inflation might stay elevated longer than expected. PCE inflation will likely be revised up for 2022.
PCE core inflation was up 4.9% in April year-over-year. This was below the cycle high of 5.3%. Core PCE inflation will also likely be revised up.
"We don’t expect major fireworks at the June FOMC meeting. Chair Powell and the Fed has communicated that they are likely to hike by 50bp at this meeting (as well as at the next meeting in July) and we expect them to deliver. What will be of interest will be the updated Summary of Economic Projections (SEP) and dot plot.Update: From Goldman Sachs:
...
In the press conference, we expect Chair Powell to reiterate that labor market momentum is still too strong, inflation remains a big problem, and that the Fed is committed to restoring price stability. We don’t expect any concrete forward guidance beyond the next meeting, with Powell noting a reassessment in the path of hikes in September dependent on convincing signs that inflation is slowing. If asked about a pause in September, he is likely to outright dismiss the idea."
The FOMC is likely to respond to the firmer inflation print and the rise in long-term inflation expectations with a resolutely hawkish message at the June meeting, in addition to the 50bp rate hike it is set to deliver. This should come across clearly in the statement, the economic projections, and the dots.
We expect the FOMC to revise the policy guidance in its statement to say that the Committee “anticipates that raising the target range expeditiously will be appropriate until it sees clear and convincing evidence that inflation is moderating,” implying a high bar for reverting to 25bp hikes.
Analysts will be looking for comments on the size of future rate hikes.
Projections will be released at this meeting. For review, here are the March projections. In March, most participants expected seven rate hikes in 2022. It appears the FOMC will reach seven 25bp hikes by July, and still have three more meetings to go.
Wall Street forecasts are being revised down for 2022 due to the ongoing negative impacts from the pandemic and the war in Ukraine. So, GDP for 2022 will likely be revised down.
Wall Street forecasts are being revised down for 2022 due to the ongoing negative impacts from the pandemic and the war in Ukraine. So, GDP for 2022 will likely be revised down.
| GDP projections of Federal Reserve Governors and Reserve Bank presidents, Change in Real GDP1 | ||||
|---|---|---|---|---|
| Projection Date | 2022 | 2023 | 2024 | |
| Mar 2022 | 2.5 to 3.0 | 2.1 to 2.5 | 1.8 to 2.0 | |
The unemployment rate was at 3.6% in May. The question is: Will the slowdown in economic growth push up the unemployment rate? Or will the rate continue to decline? The projections for the unemployment rate will likely be mostly unchanged.
| Unemployment projections of Federal Reserve Governors and Reserve Bank presidents, Unemployment Rate2 | ||||
|---|---|---|---|---|
| Projection Date | 2022 | 2023 | 2024 | |
| Mar 2022 | 3.4 to 3.6 | 3.3 to 3.6 | 3.2 to 3.7 | |
As of April 2022, PCE inflation was up 6.3% from April 2021. This was below the cycle high of 6.6%. Based on recent readings, inflation might stay elevated longer than expected. PCE inflation will likely be revised up for 2022.
| Inflation projections of Federal Reserve Governors and Reserve Bank presidents, PCE Inflation1 | ||||
|---|---|---|---|---|
| Projection Date | 2022 | 2023 | 2024 | |
| Mar 2022 | 4.1 to 4.7 | 2.3 to 3.0 | 2.1 to 2.4 | |
PCE core inflation was up 4.9% in April year-over-year. This was below the cycle high of 5.3%. Core PCE inflation will also likely be revised up.
| Core Inflation projections of Federal Reserve Governors and Reserve Bank presidents, Core Inflation1 | ||||
|---|---|---|---|---|
| Projection Date | 2022 | 2023 | 2024 | |
| Mar 2022 | 3.9 to 4.4 | 2.4 to 3.0 | 2.1 to 2.4 | |


