 RSS Feed
 by Calculated Risk on 6/10/2022 09:12:00 PM
Friday, June 10, 2022
COVID June 10, 2022: Cases, Hospitalizations and Deaths Increasing
On COVID (focus on hospitalizations and deaths):
| COVID Metrics | ||||
|---|---|---|---|---|
| Now | Week Ago | Goal | ||
| Percent fully Vaccinated | 66.7% | --- | ≥70.0%1 | |
| Fully Vaccinated (millions) | 221.6 | --- | ≥2321 | |
| New Cases per Day3🚩 | 106,874 | 99,715 | ≤5,0002 | |
| Hospitalized3🚩 | 23,292 | 22,043 | ≤3,0002 | |
| Deaths per Day3🚩 | 291 | 262 | ≤502 | |
| 1 Minimum to achieve "herd immunity" (estimated between 70% and 85%). 2my goals to stop daily posts, 37-day average for Cases, Currently Hospitalized, and Deaths 🚩 Increasing 7-day average week-over-week for Cases, Hospitalized, and Deaths ✅ Goal met. | ||||
 Click on graph for larger image.
This graph shows the daily (columns) and 7-day average (line) of deaths reported.
Average daily deaths bottomed in July 2021 at 214 per day.
30-Year Mortgage Rates increase to 5.85%
by Calculated Risk on 6/10/2022 03:42:00 PM
Today, in the Calculated Risk Real Estate Newsletter: 30-Year Mortgage Rates increase to 5.85%
A brief excerpt:
Mortgagenewsdaily.com reports that as of today, average 30-year fixed mortgage rates are at 5.85% for top tier scenarios. Rates increased today as a result of the inflation report released this morning. Here is a graph from Mortgagenewsdaily.com that shows the 30-year mortgage rate over the last 5 years.There is much more in the article. You can subscribe at https://calculatedrisk.substack.com/
It is the sharp increase in monthly payments - due to sharply higher mortgage rates - that is impacting the housing market.
...
Yesterday, Sam Ro tweeted some analysis from Goldman Sachs on the median monthly payment. This analysis was before the sharp jump in rates today."The median monthly payment of a 30-year mortgage is up 56% year-over-year"

Q2 GDP Forecasts: Close to 3.0%
by Calculated Risk on 6/10/2022 02:29:00 PM
From BofA:
We revised down our 2Q qoq saar growth from 3.0% to 2.5%. [June 10 estimate]From Goldman:
emphasis added
We left our Q2 GDP tracking estimate unchanged at +3.0% (qoq ar). [June 7 estimate]And from the Altanta Fed: GDPNow
The GDPNow model estimate for real GDP growth (seasonally adjusted annual rate) in the second quarter of 2022 is 0.9 percent on June 8, unchanged from June 7 after rounding. [June 8 estimate]
Cleveland Fed: Median CPI increased 0.6% and Trimmed-mean CPI increased 0.8% in May
by Calculated Risk on 6/10/2022 12:13:00 PM
The Cleveland Fed released the median CPI and the trimmed-mean CPI this morning:
According to the Federal Reserve Bank of Cleveland, the median Consumer Price Index rose 0.6% in May. The 16% trimmed-mean Consumer Price Index increased 0.8% in May. "The median CPI and 16% trimmed-mean CPI are measures of core inflation calculated by the Federal Reserve Bank of Cleveland based on data released in the Bureau of Labor Statistics’ (BLS) monthly CPI report".
Note: The Cleveland Fed released the median CPI details here: "Fuel oil and other fuels" increased at 339% annualized rate in May!
Note that Owners' Equivalent Rent and Rent of Primary Residence account for almost 1/3 of median CPI, and these measures were up around 7% annualized in May.
 Click on graph for larger image.
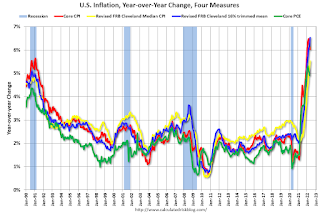
This graph shows the year-over-year change for these four key measures of inflation.
 Click on graph for larger image.
This graph shows the year-over-year change for these four key measures of inflation.
On a year-over-year basis, the median CPI rose 5.5%, the trimmed-mean CPI rose 6.5%, and the CPI less food and energy rose 6.0%. Core PCE is for April and increased 4.9% year-over-year.
Realtor.com Reports Weekly Inventory Up 13% Year-over-year
by Calculated Risk on 6/10/2022 09:43:00 AM
Realtor.com has monthly and weekly data on the existing home market. Here is their weekly report released yesterday from Chief Economist Danielle Hale: Weekly Housing Trends View — Data Week Ending June 4, 2022. Note: They have data on list prices, new listings and more, but this focus is on inventory.
• Active inventory continued to grow, rising 13% above one year ago. The turnaround in the number of homes for sale continues and year over year growth signals that this is more than just a seasonal improvement. Inventory was roughly on par with last year’s levels at the beginning of May and is now up 13% at the beginning of June. Nevertheless, our May Housing Trends Report showed that the active listings count remained nearly 50 percent below its level at the beginning of the pandemic. In other words, we’re starting to add more options, but home shoppers continue to see a relatively low number of homes for sale.
 Here is a graph of the year-over-year change in inventory according to realtor.com. Note: I corrected a sign error in the data for Feb 26, 2022.
Note the rapid increase in the YoY change, from down 30% at the beginning of the year, to up 13% YoY now. It will be important to watch if that trend continues.
BLS: CPI increased 1.0% in May; Core CPI increased 0.6%
by Calculated Risk on 6/10/2022 08:32:00 AM
The Consumer Price Index for All Urban Consumers (CPI-U) increased 1.0 percent in May on a seasonally adjusted basis after rising 0.3 percent in April, the U.S. Bureau of Labor Statistics reported today. Over the last 12 months, the all items index increased 8.6 percent before seasonal adjustment.The consensus was for 0.7% increase in CPI, and a 0.5% increase in core CPI. Both were above expectations. I'll post a graph later today after the Cleveland Fed releases the median and trimmed-mean CPI.
The increase was broad-based, with the indexes for shelter, gasoline, and food being the largest contributors. After declining in April, the energy index rose 3.9 percent over the month with the gasoline index rising 4.1 percent and the other major component indexes also increasing. The food index rose 1.2 percent in May as the food at home index increased 1.4 percent.
The index for all items less food and energy rose 0.6 percent in May, the same increase as in April. While almost all major components increased over the month, the largest contributors were the indexes for shelter, airline fares, used cars and trucks, and new vehicles. The indexes for medical care, household furnishings and operations, recreation, and apparel also increased in May.
The all items index increased 8.6 percent for the 12 months ending May, the largest 12-month increase since the period ending December 1981. The all items less food and energy index rose 6.0 percent over the last 12 months. The energy index rose 34.6 percent over the last year, the largest 12-month increase since the period ending September 2005. The food index increased 10.1 percent for the 12-months ending May, the first increase of 10 percent or more since the period ending March 1981.
emphasis added
Thursday, June 09, 2022
Friday: CPI
by Calculated Risk on 6/09/2022 09:11:00 PM
Friday:
• At 8:30 AM ET, The Consumer Price Index for May from the BLS. The consensus is for 0.7% increase in CPI, and a 0.5% increase in core CPI.
• At 10:00 AM, University of Michigan's Consumer sentiment index (Preliminary for June).
On COVID (focus on hospitalizations and deaths):
| COVID Metrics | ||||
|---|---|---|---|---|
| Now | Week Ago | Goal | ||
| Percent fully Vaccinated | 66.7% | --- | ≥70.0%1 | |
| Fully Vaccinated (millions) | 221.6 | --- | ≥2321 | |
| New Cases per Day3🚩 | 109,032 | 100,915 | ≤5,0002 | |
| Hospitalized3🚩 | 23,341 | 21,693 | ≤3,0002 | |
| Deaths per Day3🚩 | 306 | 258 | ≤502 | |
| 1 Minimum to achieve "herd immunity" (estimated between 70% and 85%). 2my goals to stop daily posts, 37-day average for Cases, Currently Hospitalized, and Deaths 🚩 Increasing 7-day average week-over-week for Cases, Hospitalized, and Deaths ✅ Goal met. | ||||
 Click on graph for larger image.
This graph shows the daily (columns) and 7-day average (line) of deaths reported.
Average daily deaths bottomed in July 2021 at 214 per day.
Hotels: Occupancy Rate Down 12.1% Compared to Same Week in 2019
by Calculated Risk on 6/09/2022 04:17:00 PM
Note: This was lowered by the timing of the holiday.
Reflecting an expected post-Memorial Day holiday slowdown, U.S. hotel performance fell from the previous week, according to STR‘s latest data through June 4.The following graph shows the seasonal pattern for the hotel occupancy rate using the four-week average.
May 29 through June 4, 2022 (percentage change from comparable week in 2019*):
• Occupancy: 63.2% (-12.1%)
• Average daily rate (ADR): $147.35 (+11.3%)
• Revenue per available room (RevPAR): $93.16 (-2.2%)
*Due to the pandemic impact, STR is measuring recovery against comparable time periods from 2019.
emphasis added
 Click on graph for larger image.
The red line is for 2022, black is 2020, blue is the median, and dashed light blue is for 2021. Dashed purple is 2019 (STR is comparing to a strong year for hotels).
The 4-week average of the occupancy rate is above the median rate for the previous 20 years (Blue).
Note: Y-axis doesn't start at zero to better show the seasonal change.
The 4-week average of the occupancy rate will now mostly move sideways seasonally until the summer.
The Home ATM Still Open in Q1 2022; Closing Soon
by Calculated Risk on 6/09/2022 01:37:00 PM
Today, in the Real Estate Newsletter: The Home ATM Still Open in Q1 2022; Closing Soon
Excerpt:
First, here is the quarterly increase in mortgage debt from the Federal Reserve’s report since 2000. In the mid ‘00s, there was a large increase in mortgage debt associated with the housing bubble.There is much more in the article. You can subscribe at https://calculatedrisk.substack.com/ (All ad free, most content free).
In Q1 2022, mortgage debt increased $222 billion, slightly lower than the three previous quarters. Note the almost 7 years of declining mortgage debt as distressed sales (foreclosures and short sales) wiped out a significant amount of debt.
However, some of this debt is being used to increase the housing stock (purchase new homes), so this isn’t all MEW.
...
The bottom line is the recent increase in MEW is not concerning - it is far less as a percent of disposable personal income than during the bubble, and most homeowners have substantial equity.
Also, it is very likely that MEW will decrease sharply in 2022 as refinance activity declines due to higher mortgage rates. I expect significantly lower levels of MEW in the last three quarters of2022.

Fed's Flow of Funds: Household Net Worth Decreased $0.55 Trillion in Q1
by Calculated Risk on 6/09/2022 12:22:00 PM
The Federal Reserve released the Q1 2022 Flow of Funds report today: Financial Accounts of the United States.
The net worth of households and nonprofits fell to $149.3 trillion during the first quarter of 2022. The value of directly and indirectly held corporate equities decreased $3.0 trillion and the value of real estate increased $1.7 trillion.
...
Household debt increased 8.3 percent at an annual rate in the first quarter of 2022. Consumer credit grew at an annual rate of 8.7 percent, while mortgage debt (excluding charge-offs) grew at an annual rate of 8.6 percent.
 Click on graph for larger image.
The first graph shows Households and Nonprofit net worth as a percent of GDP.
Net worth as a percent of GDP is down slightly from the all-time high in Q4.
This includes real estate and financial assets (stocks, bonds, pension reserves, deposits, etc) net of liabilities (mostly mortgages). Note that this does NOT include public debt obligations.
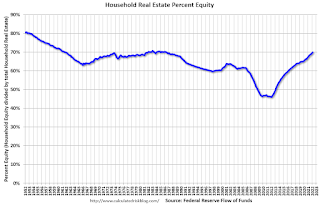 This graph shows homeowner percent equity since 1952.
Household percent equity (as measured by the Fed) collapsed when house prices fell sharply in 2007 and 2008.
In Q1 2022, household percent equity (of household real estate) was at 69.9% - up from 69.2% in Q4, 2021. This is the highest percent equity since the 1980s.
Note: This includes households with no mortage debt.
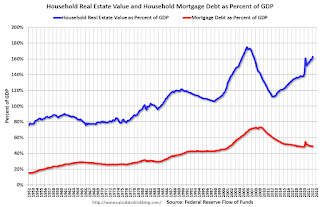 The third graph shows household real estate assets and mortgage debt as a percent of GDP. Note this graph was impacted by the sharp decline in Q2 2020 GDP.
Mortgage debt increased by $222 billion in Q1.
Mortgage debt is up $1.27 trillion from the peak during the housing bubble, but, as a percent of GDP is at 49.1% - up from Q4 - and down from a peak of 73.3% of GDP during the housing bust.
The value of real estate, as a percent of GDP, increased in Q1, and is well above the average of the last 30 years.
 This graph shows homeowner percent equity since 1952.
 Household percent equity (as measured by the Fed) collapsed when house prices fell sharply in 2007 and 2008.
In Q1 2022, household percent equity (of household real estate) was at 69.9% - up from 69.2% in Q4, 2021. This is the highest percent equity since the 1980s.
Note: This includes households with no mortage debt.
 The third graph shows household real estate assets and mortgage debt as a percent of GDP. Note this graph was impacted by the sharp decline in Q2 2020 GDP.
Mortgage debt increased by $222 billion in Q1.
Mortgage debt is up $1.27 trillion from the peak during the housing bubble, but, as a percent of GDP is at 49.1% - up from Q4 - and down from a peak of 73.3% of GDP during the housing bust.
The value of real estate, as a percent of GDP, increased in Q1, and is well above the average of the last 30 years.


