 RSS Feed
 by Calculated Risk on 5/14/2022 02:11:00 PM
Saturday, May 14, 2022
Real Estate Newsletter Articles this Week
At the Calculated Risk Real Estate Newsletter this week:
• What will Happen with House Prices?
• Realtor.com Reports Weekly Inventory Up Slightly Year-over-year
• 2nd Look at Local Housing Markets in April
• Mortgage Originations by Credit Score and Age
• Homebuilder Comments in April: “Demand is slowing", "Investors pulling back" Clear signs of a market shift
• Housing Market: Where it's at. Where it's going.
This is usually published 4 to 6 times a week and provides more in-depth analysis of the housing market.
The blog will continue as always!
You can subscribe at https://calculatedrisk.substack.com/
Most content is available for free (and no Ads), but please subscribe!
Schedule for Week of May 15, 2022
by Calculated Risk on 5/14/2022 08:11:00 AM
The key reports this week are April Retail Sales, Housing Starts and Existing Home Sales.
For manufacturing, April Industrial Production, and the May NY and Philly Fed manufacturing surveys will be released.
Fed Chair Powell speaks on Tuesday.
Note: The Census Bureau is expected to release "National, State, and County housing units" from the 2020 Census sometime in May.
8:30 AM: The New York Fed Empire State manufacturing survey for May. The consensus is for a reading of 17.0, down from 24.6.
 8:30 AM ET: Retail sales for April is scheduled to be released. The consensus is for 0.8% increase in retail sales.
This graph shows retail sales since 1992. This is monthly retail sales and food service, seasonally adjusted (total and ex-gasoline).
Retail sales were up 0.7% in March.
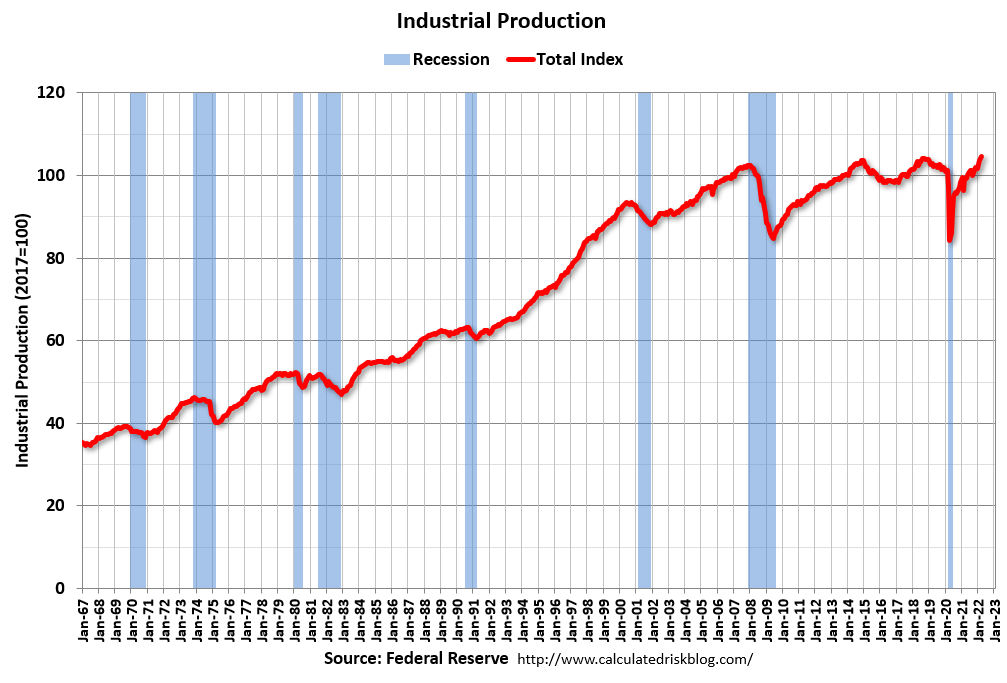 9:15 AM: The Fed will release Industrial Production and Capacity Utilization for April.
This graph shows industrial production since 1967.
The consensus is for a 0.4% increase in Industrial Production, and for Capacity Utilization to increase to 78.5%.
10:00 AM: The May NAHB homebuilder survey. The consensus is for a reading of 75 down from 77 last month. Any number above 50 indicates that more builders view sales conditions as good than poor.
2:00 PM: Discussion, Fed Chair Jerome H. Powell, Conversation with Nick Timiraos, At the Wall Street Journal Future of Everything Festival, New York, New York
7:00 AM ET: The Mortgage Bankers Association (MBA) will release the results for the mortgage purchase applications index.
 8:30 AM ET: Housing Starts for April.
 This graph shows single and total housing starts since 1968.
The consensus is for 1.773 million SAAR, down from 1.793 million SAAR in March.
During the day: The AIA's Architecture Billings Index for April (a leading indicator for commercial real estate).
8:30 AM: The initial weekly unemployment claims report will be released. The consensus is for 210 thousand up from 203 thousand last week.
8:30 AM: the Philly Fed manufacturing survey for May. The consensus is for a reading of 16.7, down from 17.6.
 10:00 AM: Existing Home Sales for April from the National Association of Realtors (NAR). The consensus is for 5.62 million SAAR, down from 5.77 million.
The graph shows existing home sales from 1994 through the report last month.
10:00 AM: State Employment and Unemployment (Monthly) for April 2022
Friday, May 13, 2022
COVID May 13, 2022: New Cases and Hospitalizations Increasing
by Calculated Risk on 5/13/2022 09:11:00 PM
On COVID (focus on hospitalizations and deaths):
| COVID Metrics | ||||
|---|---|---|---|---|
| Now | Week Ago | Goal | ||
| Percent fully Vaccinated | 66.4% | --- | ≥70.0%1 | |
| Fully Vaccinated (millions) | 220.5 | --- | ≥2321 | |
| New Cases per Day3🚩 | 87,382 | 67,403 | ≤5,0002 | |
| Hospitalized3🚩 | 14,604 | 12,795 | ≤3,0002 | |
| Deaths per Day3 | 272 | 322 | ≤502 | |
| 1 Minimum to achieve "herd immunity" (estimated between 70% and 85%). 2my goals to stop daily posts, 37-day average for Cases, Currently Hospitalized, and Deaths 🚩 Increasing 7-day average week-over-week for Cases, Hospitalized, and Deaths ✅ Goal met. | ||||
 Click on graph for larger image.
This graph shows the daily (columns) and 7-day average (line) of deaths reported.
Average daily deaths bottomed in July 2021 at 214 per day.
Hotels: Occupancy Rate Down 6.1% Compared to Same Week in 2019
by Calculated Risk on 5/13/2022 02:31:00 PM
U.S. hotel occupancy declined from the previous week, while average daily rate (ADR) increased slightly, according to STR‘s latest data through May 7.The following graph shows the seasonal pattern for the hotel occupancy rate using the four-week average.
May 1-7, 2022 (percentage change from comparable week in 2019*):
• Occupancy: 63.9% (-6.1%)
• verage daily rate (ADR): $147.24 (+12.0%)
• evenue per available room (RevPAR): $94.10 (+5.1%)
*Due to the pandemic impact, STR is measuring recovery against comparable time periods from 2019.
emphasis added
 Click on graph for larger image.
The red line is for 2022, black is 2020, blue is the median, and dashed light blue is for 2021. Dashed purple is 2019 (STR is comparing to a strong year for hotels).
The 4-week average of the occupancy rate is at the median rate for the previous 20 years (Blue).
Note: Y-axis doesn't start at zero to better show the seasonal change.
The 4-week average of the occupancy rate will now mostly move sideways seasonally until the summer.
What will Happen with House Prices?
by Calculated Risk on 5/13/2022 12:33:00 PM
Today, in the Calculated Risk Real Estate Newsletter: What will Happen with House Prices?
Excerpt:
Now let's look at the year-over-year change for the same period in real terms (inflation adjusted using CPI-less shelter).
Note that in real terms, house prices declined during the stall periods in 1982 and 1991. In the early ‘80s, real prices declined 11% from the peak, even though nominal prices only declined slightly. Homeowners are only concerned with nominal prices, so they didn’t notice the real price decline.
In the early ‘90s, real prices decline almost 14% even though nominal prices declined 3%. Note that real prices were flat for several years in the mid-‘90s.
During the housing bust, real prices declined 35% compared to a 26% decline in nominal prices (this was a low inflation period).
...
The data seems to argue for the slow house price growth scenario, but my view is the most likely scenario is house prices will stall in nominal terms and decline in real terms. I’ve been looking at the 1978 to 1982 period for lessons, and that would suggest a stall in house prices (hopefully we avoid a recession).
Unfortunately, I don’t have the existing home inventory data for that period. However, my guess is the slow growth scenario would suggest inventory in the 4 to 5 months range, and the stall scenario would be close to 6 months of inventory. For the bust scenario, my guess is we’d see existing home inventory at 7+ months.
There is much more in the article. You can subscribe at https://calculatedrisk.substack.com/
Leading Index for Commercial Real Estate "Rises in April"
by Calculated Risk on 5/13/2022 08:51:00 AM
From Dodge Data Analytics: Dodge Momentum Index Rises in April
The Dodge Momentum Index (DMI) moved 6% higher in April to 164.8 (2000=100), up from the revised March reading of 155.0. The Momentum Index, issued by Dodge Construction Network, is a monthly measure of the initial report for nonresidential building projects in planning shown to lead construction spending for nonresidential buildings by a full year. In April, the commercial component of the Momentum Index rose 9%, while the institutional component moved 2% higher.
With the gain in April, the Dodge Momentum Index was just 5% shy of the all-time high set in the fall of 2021. The main impetus behind this trend is the commercial sector, which has been driven by a growing number of data center, warehouse and hotel projects entering the planning queue. The institutional component has made moderate improvements as well, as more education, healthcare and recreation projects begin the planning process. On a year-over-year basis, the Momentum Index was 17% higher than in April 2021. The commercial component was 15% higher, while the institutional component was 22% higher than a year ago.
emphasis added
 Click on graph for larger image.
This graph shows the Dodge Momentum Index since 2002. The index was at 164.8 in April, up from 155.0 in March.
According to Dodge, this index leads "construction spending for nonresidential buildings by a full year". This index suggested a decline in Commercial Real Estate construction through most of 2021, but a solid pickup this year and into 2023.
Thursday, May 12, 2022
Mortgage Rates Move Lower
by Calculated Risk on 5/12/2022 08:11:00 PM
From Matthew Graham at MortgageNewsDaily: Rates Are Actually Lower Today (And This Week)
Rates are actually lower today and significantly lower than last week. In fact, as long as they're still ending the business week on Fridays, this week's rates are significantly lower, with the average lender offering conventional 30yr fixed rates about a quarter of a point below those seen on Friday afternoon.
You'd have to go all the way back to April 27th to see anything as low.
...
The average lender is now quoting conventional 30yr fixed rates in the at 5.375% or lower for top tier scenarios. This is down from 5.625% at the recent highs just a few days ago.
 Click on graph for larger image.
This is a graph from Mortgage News Daily (MND) showing 30-year fixed rates from three sources (MND, MBA, Freddie Mac) since the beginning of 2021.
The 30-year fixed rate for top tier scenarios was 5.35% today, down from the recent high of 5.64%.
Go to MND and you can adjust the graph for different time periods.
Realtor.com Reports Weekly Inventory Up Slightly Year-over-year; First Year-over-year Increase Since 2019
by Calculated Risk on 5/12/2022 10:32:00 AM
Today, in the Calculated Risk Real Estate Newsletter: Realtor.com Reports Weekly Inventory Up Slightly Year-over-year
Excerpt:
Realtor.com has monthly and weekly data on the existing home market. Here is their weekly report released this morning from Chief Economist Danielle Hale: Weekly Housing Trends View — Data Week Ending May 7, 2022. Note: They have data on list prices, new listings and more, but this focus is on inventory.• Active inventory grew for the first time since 2019. While the size of the improvement rounded to 0%, this week’s data [marks] the first time that inventory figures weren’t lower than the previous year since June 2019. Our April Housing Trends Report showed that the active listings count remained 60 percent below its level right at the onset of the pandemic. This means that for every 5 homes available for sale in the earlier period, today there are just 2. In other words, homes for sale are still limited. However, the switch to growth after nearly 3 years of decline is a step in the right direction, even though inventory continues to lag pre-pandemic normal.Here is a graph of the year-over-year change in inventory according to realtor.com. Note: I corrected a sign error in the data for Feb 26, 2022.
Note the rapid increase in the YoY change, from down 30% at the beginning of the year, to unchanged YoY now. It will be important to watch if that trend continues.
The previous week, inventory was down 3.4% YoY according to Realtor.com. That is close to the 1.6% decline that Altos reported for the similar period. I expect Altos to report a year-over-year increase in inventory on Monday.

There is much more in the article. You can subscribe at https://calculatedrisk.substack.com/
Weekly Initial Unemployment Claims Increase to 203,000
by Calculated Risk on 5/12/2022 08:35:00 AM
The DOL reported:
In the week ending May 7, the advance figure for seasonally adjusted initial claims was 203,000, an increase of 1,000 from the previous week's revised level. The previous week's level was revised up by 2,000 from 200,000 to 202,000. The 4-week moving average was 192,750, an increase of 4,250 from the previous week's revised average. The previous week's average was revised up by 500 from 188,000 to 188,500.The following graph shows the 4-week moving average of weekly claims since 1971.
emphasis added
 Click on graph for larger image.
The dashed line on the graph is the current 4-week average. The four-week average of weekly unemployment claims increased to 192,750.
The previous week was revised up.
Weekly claims were lower than the consensus forecast.
Wednesday, May 11, 2022
Thursday: PPI, Unemployment Claims
by Calculated Risk on 5/11/2022 08:50:00 PM
Thursday:
• At 8:30 AM ET, the initial weekly unemployment claims report will be released. The consensus is for 210 thousand up from 200 thousand last week.
• At 8:30 AM, The Producer Price Index for April from the BLS. The consensus is for a 0.5% increase in PPI, and a 0.6% increase in core PPI.
On COVID (focus on hospitalizations and deaths):
| COVID Metrics | ||||
|---|---|---|---|---|
| Now | Week Ago | Goal | ||
| Percent fully Vaccinated | 66.3% | --- | ≥70.0%1 | |
| Fully Vaccinated (millions) | 220.3 | --- | ≥2321 | |
| New Cases per Day3🚩 | 78,236 | 61,715 | ≤5,0002 | |
| Hospitalized3🚩 | 14,104 | 12,291 | ≤3,0002 | |
| Deaths per Day3 | 326 | 332 | ≤502 | |
| 1 Minimum to achieve "herd immunity" (estimated between 70% and 85%). 2my goals to stop daily posts, 37-day average for Cases, Currently Hospitalized, and Deaths 🚩 Increasing 7-day average week-over-week for Cases, Hospitalized, and Deaths ✅ Goal met. | ||||
 Click on graph for larger image.
This graph shows the daily (columns) and 7-day average (line) of deaths reported.
Average daily deaths bottomed in July 2021 at 214 per day.


