 RSS Feed
 by Calculated Risk on 1/25/2022 09:51:00 AM
Tuesday, January 25, 2022
Comments on Case-Shiller and FHFA House Price Increases
Today, in the Calculated Risk Real Estate Newsletter: Case-Shiller National Index up 18.8% Year-over-year in November
Excerpt:
This graph below shows existing home months-of-supply (inverted, from the NAR) vs. the seasonally adjusted month-to-month price change in the Case-Shiller National Index (both since January 1999 through November 2021).
There is a clear relationship, and this is no surprise (but interesting to graph). If months-of-supply is high, prices decline. If months-of-supply is very low (like now), prices rise quickly.
In November, the months-of-supply was at 2.1 months, and the Case-Shiller National Index (SA) increased 1.14% month-over-month. The black arrow points to the November 2021 dot. In the December existing home sales report, the NAR reported months-of-supply decreased to a record low 1.8 months in December.
We are seeing the expected deceleration in house price growth, and this trend will probably continue for at least a few more months. My sense is the Case-Shiller National annual growth rate of 19.99% in August was probably the peak YoY growth rate, however, since the normal level of inventory is probably in the 4 to 6 months range - we’d have to see a significant increase in inventory to sharply slow price increases, and that is why I’m focused on inventory!emphasis added

There is much more in the article. You can subscribe at https://calculatedrisk.substack.com/
Case-Shiller: National House Price Index increased 18.8% year-over-year in November
by Calculated Risk on 1/25/2022 09:15:00 AM
S&P/Case-Shiller released the monthly Home Price Indices for November ("November" is a 3-month average of September, October and November prices).
This release includes prices for 20 individual cities, two composite indices (for 10 cities and 20 cities) and the monthly National index.
From S&P: S&P Corelogic Case-Shiller Index Reports 18.8% Annual Home Price Gain in November
The S&P CoreLogic Case-Shiller U.S. National Home Price NSA Index, covering all nine U.S. census divisions, reported an 18.8% annual gain in November, down from 19.0% in the previous month. The 10-City Composite annual increase came in at 16.8%, down from 17.2% in the previous month. The 20- City Composite posted an 18.3% year-over-year gain, down from 18.5% in the previous month.
Phoenix, Tampa, and Miami reported the highest year-over-year gains among the 20 cities in November. Phoenix led the way with a 32.2% year-over-year price increase, followed by Tampa with a 29.0% increase and Miami with a 26.6% increase. Eleven of the 20 cities reported higher price increases in the year ending November 2021 versus the year ending October 2021.
...
Before seasonal adjustment, the U.S. National Index posted a 0.9% month-over-month increase in November, while the 10-City and 20-City Composites posted increases of 0.9% and 1.0%, respectively.
After seasonal adjustment, the U.S. National Index posted a month-over-month increase of 1.1%, and the 10-City and 20-City Composites posted increases of 1.1% and 1.2%, respectively.
In November, 19 of the 20 cities reported increases before seasonal adjustments while all 20 cities reported increases after seasonal adjustments.
“For the past several months, home prices have been rising at a very high, but decelerating, rate. That trend continued in November 2021,” says Craig J. Lazzara, Managing Director at S&P DJI. “The National Composite Index rose 18.8% from year-ago levels, and the 10- and 20-City Composites gained 16.8% and 18.3%, respectively. In all three cases, November’s gains were less than October’s. Despite this deceleration, it’s important to remember that November’s 18.8% gain was the sixth-highest reading in the 34 years covered by our data (the top five were the months immediately preceding November).
emphasis added
 Click on graph for larger image.
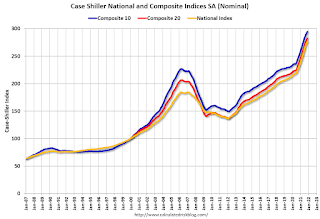
 The first graph shows the nominal seasonally adjusted Composite 10, Composite 20 and National indices (the Composite 20 was started in January 2000).
The Composite 10 index is up 1.1% in November (SA).
The Composite 20 index is up 1.2% (SA) in November.
The National index is 50% above the bubble peak (SA), and up 1.1% (SA) in November. The National index is up 102% from the post-bubble low set in February 2012 (SA).
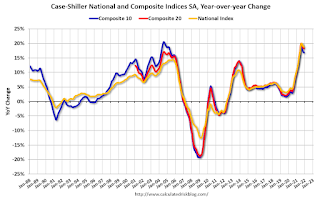 The second graph shows the year-over-year change in all three indices.
The Composite 10 SA is up 16.8% year-over-year. The Composite 20 SA is up 18.3% year-over-year.
The National index SA is up 18.8% year-over-year.
Price increases were close to expectations. I'll have more later.
Monday, January 24, 2022
Tuesday: Case-Shiller House Prices
by Calculated Risk on 1/24/2022 07:41:00 PM
Tuesday:
• At 9:00 AM ET, FHFA House Price Index for November. This was originally a GSE only repeat sales, however there is also an expanded index.
• Also, at 9:00 AM, S&P/Case-Shiller House Price Index for November. The consensus is for a 18.0% year-over-year increase in the Comp 20 index.
• At 10:00 AM, Richmond Fed Survey of Manufacturing Activity for January.
• Also, at 10:00 AM, State Employment and Unemployment (Monthly) for December 2021
On COVID (focus on hospitalizations and deaths):
| COVID Metrics | ||||
|---|---|---|---|---|
| Today | Week Ago | Goal | ||
| Percent fully Vaccinated | 63.4% | --- | ≥70.0%1 | |
| Fully Vaccinated (millions) | 210.5 | --- | ≥2321 | |
| New Cases per Day3 | 663,908 | 788,527 | ≤5,0002 | |
| Hospitalized3 | 136,135 | 141,565 | ≤3,0002 | |
| Deaths per Day3🚩 | 1,936 | 1,886 | ≤502 | |
| 1 Minimum to achieve "herd immunity" (estimated between 70% and 85%). 2my goals to stop daily posts, 37-day average for Cases, Currently Hospitalized, and Deaths 🚩 Increasing 7-day average week-over-week for Cases, Hospitalized, and Deaths ✅ Goal met. | ||||
 Click on graph for larger image.
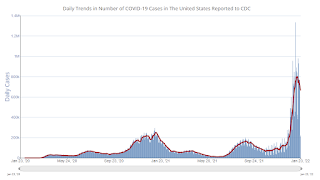
This graph shows the daily (columns) and 7-day average (line) of positive tests reported.
New cases are now declining.
Unfortunately, deaths are still rising, but well below the previous 7-day average record of 3,421 in January 2021.
Final Look at Local Housing Markets in December
by Calculated Risk on 1/24/2022 12:40:00 PM
Today, in the Calculated Risk Real Estate Newsletter: Final Look at Local Housing Markets in December
A brief excerpt:
This update adds Alabama, Columbus, Indiana, Miami, Minneapolis, New York, Phoenix and Rhode Island. ...There is much more in the article. You can subscribe at https://calculatedrisk.substack.com/
Here is a summary of active listings for these housing markets in December. Inventory was down 17.7% in December month-over-month (MoM) from November, and down 31.3% year-over-year (YoY).
Inventory almost always declines seasonally in December, so the MoM decline is not a surprise. Last month, these markets were down 27.4% YoY, so the YoY decline in December is larger than in November. This isn’t indicating a slowing market.
Notes for all tables:
1. New additions to table in BOLD.
2. Northwest (Seattle), North Texas (Dallas), and Santa Clara (San Jose), Jacksonville, Source: Northeast Florida Association of REALTORS®
3. Totals do not include Denver and Minneapolis (included in state totals).
Housing Inventory January 24th Update: Inventory Down 2.4% Week-over-week; New Record Low
by Calculated Risk on 1/24/2022 10:25:00 AM
Tracking existing home inventory is very important in 2022.
Inventory usually declines in the winter, and this is a new record low for this series.
This inventory graph is courtesy of Altos Research.
As of January 21st, inventory was at 277 thousand (7-day average), compared to 380 thousand for the same week a year ago. That is a decline of 27.1%. A week ago, inventory was at 284 thousand, and was down 28.6% YoY. So, the YoY decline was less this week than last week (something to watch).
Inventory was down 2.4% from the previous week.
Compared to the same week in 2020, inventory is down 62.4% from 736 thousand.
Last year, seasonally, inventory bottomed in April 2021 - very late - usually inventory bottoms in January or February. An early key in 2022 will be to watch if inventory bottoms in January or February this year.
Mike Simonsen discusses this data regularly on Youtube.
Six High Frequency Indicators for the Economy
by Calculated Risk on 1/24/2022 08:45:00 AM
These indicators are mostly for travel and entertainment. It is interesting to watch these sectors recover as the pandemic subsides.
There is a clear negative impact from the omicron variant of COVID.
Note: Gasoline consumption returned to pre-pandemic levels.
----- Airlines: Transportation Security Administration -----
The TSA is providing daily travel numbers.
This data is as of January 23rd.
 Click on graph for larger image.
This data shows the 7-day average of daily total traveler throughput from the TSA for 2019 (Light Blue), 2020 (Black), 2021 (Blue) and 2021 (Red).
The dashed line is the percent of 2019 for the seven-day average.
The 7-day average is down 24.7% from the same day in 2019 (75.3% of 2019). (Dashed line)
----- Restaurants: OpenTable -----
The second graph shows the 7-day average of the year-over-year change in diners as tabulated by OpenTable for the US and several selected cities.
----- Movie Tickets: Box Office Mojo -----
 This data shows domestic box office for each week and the median for the years 2016 through 2019 (dashed light blue).
----- Hotel Occupancy: STR -----
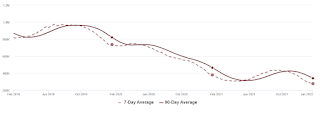
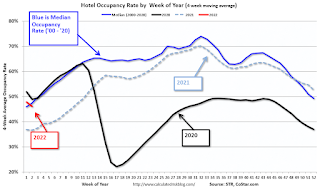 This graph shows the seasonal pattern for the hotel occupancy rate using the four-week average.
The red line is for 2022, black is 2020, blue is the median, and dashed light blue is for 2021.
This data is through January 15th. The occupancy rate was down 16.3% compared to the same week in 2019.
----- Transit: Apple Mobility -----
This graph is from Apple mobility. From Apple: "This data is generated by counting the number of requests made to Apple Maps for directions in select countries/regions, sub-regions, and cities." This is just a general guide - people that regularly commute probably don't ask for directions.
 This data is through January 21st
----- New York City Subway Usage -----
Here is some interesting data on New York subway usage (HT BR).
 This graph is from Todd W Schneider.
This data is through Friday,January 21st.
He notes: "Data updates weekly from the MTA’s public turnstile data, usually on Saturday mornings".
Note: Gasoline consumption returned to pre-pandemic levels.
The TSA is providing daily travel numbers.
This data is as of January 23rd.
Click on graph for larger image.This data shows the 7-day average of daily total traveler throughput from the TSA for 2019 (Light Blue), 2020 (Black), 2021 (Blue) and 2021 (Red).
The dashed line is the percent of 2019 for the seven-day average.
The 7-day average is down 24.7% from the same day in 2019 (75.3% of 2019). (Dashed line)
Air travel had been off about 20% relative to 2019 for most of the second half of 2021 (with some ups and downs) - but picked up over the Thanksgiving and Christmas holidays (solid leisure travel) - and has declined in early 2022 (weak business travel).
The second graph shows the 7-day average of the year-over-year change in diners as tabulated by OpenTable for the US and several selected cities.
IMPORTANT: OpenTable notes: "we’ve updated the data including downloadable dataset from January 1, 2021, onward to compare seated diners from 2021 to 2019, as opposed to year over year." Thanks!
 Thanks to OpenTable for providing this restaurant data:
This data is updated through January 22, 2022.
This data is "a sample of restaurants on the OpenTable network across all channels: online reservations, phone reservations, and walk-ins. For year-over-year comparisons by day, we compare to the same day of the week from the same week in the previous year."
Dining was mostly moving sideways, but there has been some decline recently, probably due to the winter wave of COVID. The 7-day average for the US is down 25% compared to 2019.
Thanks to OpenTable for providing this restaurant data:This data is updated through January 22, 2022.
This data is "a sample of restaurants on the OpenTable network across all channels: online reservations, phone reservations, and walk-ins. For year-over-year comparisons by day, we compare to the same day of the week from the same week in the previous year."
Dining was mostly moving sideways, but there has been some decline recently, probably due to the winter wave of COVID. The 7-day average for the US is down 25% compared to 2019.
This data shows domestic box office for each week and the median for the years 2016 through 2019 (dashed light blue). Black is 2020, Blue is 2021 and Red is 2022.
The data is from BoxOfficeMojo through January 13th.
Note that the data is usually noisy week-to-week and depends on when blockbusters are released.
Movie ticket sales were at $100 million last week, down about 49% from the median for the week.
Note that the data is usually noisy week-to-week and depends on when blockbusters are released.
Movie ticket sales were at $100 million last week, down about 49% from the median for the week.
This graph shows the seasonal pattern for the hotel occupancy rate using the four-week average. The red line is for 2022, black is 2020, blue is the median, and dashed light blue is for 2021.
This data is through January 15th. The occupancy rate was down 16.3% compared to the same week in 2019.
lthough down compared to 2019, the 4-week average of the occupancy rate is close to the median rate for the previous 20 years (Blue).
Notes: Y-axis doesn't start at zero to better show the seasonal change.
Notes: Y-axis doesn't start at zero to better show the seasonal change.
The 4-week average of the occupancy rate will increase seasonally over the next few months. The key question is: How much business travel will return?
This graph is from Apple mobility. From Apple: "This data is generated by counting the number of requests made to Apple Maps for directions in select countries/regions, sub-regions, and cities." This is just a general guide - people that regularly commute probably don't ask for directions.
This data is through January 21st for the United States and several selected cities.
The graph is the running 7-day average to remove the impact of weekends.
IMPORTANT: All data is relative to January 13, 2020. This data is NOT Seasonally Adjusted. People walk and drive more when the weather is nice, so I'm just using the transit data.
According to the Apple data directions requests, public transit in the 7-day average for the US is at 90% of the January 2020 level.
Here is some interesting data on New York subway usage (HT BR).
This graph is from Todd W Schneider. This graph shows how much MTA traffic has recovered in each borough (Graph starts at first week in January 2020 and 100 = 2019 average).
Manhattan is at about 28% of normal.
This data is through Friday,January 21st.
He notes: "Data updates weekly from the MTA’s public turnstile data, usually on Saturday mornings".
Sunday, January 23, 2022
Sunday Night Futures
by Calculated Risk on 1/23/2022 06:56:00 PM
Weekend:
• Schedule for Week of January 23, 2022
• FOMC Preview: Final Asset Purchase Announcement Expected; Hints at "Liftoff" in March
Monday:
• At 8:30 AM ET, Chicago Fed National Activity Index for December. This is a composite index of other data.
From CNBC: Pre-Market Data and Bloomberg futures S&P 500 futures are up 19 and DOW futures are up 106 (fair value).
Oil prices were up over the last week with WTI futures at $85.14 per barrel and Brent at $87.89 per barrel. A year ago, WTI was at $53, and Brent was at $55 - so WTI oil prices are up about 60% year-over-year.
Here is a graph from Gasbuddy.com for nationwide gasoline prices. Nationally prices are at $3.29 per gallon. A year ago prices were at $2.39 per gallon, so gasoline prices are up $0.90 per gallon year-over-year.
FOMC Preview: Final Asset Purchase Announcement Expected; Hints at "Liftoff" in March
by Calculated Risk on 1/23/2022 10:46:00 AM
Expectations are the FOMC will announce their final asset purchases at the meeting this week.
There might be some economic weakness in the first couple months of 2022 related to the pandemic, but the FOMC appears poised to look through that weakness.
From Merrill Lynch:
In November, the FOMC started to taper their purchases. The FOMC announced a reduction in their purchases to "at least $70 billion" Treasury securities per month and of "at least $35 billion" agency MBS per month. They also announced a further reduction in December to "at least $60 billion" Treasury securities per month and of "at least $30 billion" agency MBS per month.
In December, the FOMC announced an acceleration in the taper, and reduced their purchases to "at least $40 billion" Treasury securities per month and of "at least $20 billion" agency MBS per month starting in January. A similar reduction in asset purchases in February (to $20 billion in Treasury securities and $10 billion in agency MBS) seems likely - and that would be the final asset purchases.
From Merrill Lynch:
"The Fed will announce the last round of asset purchases at the January FOMC meeting, which is well anticipated. We believe Chair Powell could continue to pivot hawkishly during the press conference."From Goldman Sachs:
"The FOMC is likely to use its January meeting next week to hint at a March liftoff and to begin formulating a plan for balance sheet reduction. We expect the FOMC to raise interest rates four times this year starting in March and to announce the start of balance sheet reduction in July."For review, for most of last year the FOMC was purchasing "at least $80 billion" Treasury securities per month and "at least $40 billion" agency mortgage‑backed securities (MBS) per month.
In November, the FOMC started to taper their purchases. The FOMC announced a reduction in their purchases to "at least $70 billion" Treasury securities per month and of "at least $35 billion" agency MBS per month. They also announced a further reduction in December to "at least $60 billion" Treasury securities per month and of "at least $30 billion" agency MBS per month.
In December, the FOMC announced an acceleration in the taper, and reduced their purchases to "at least $40 billion" Treasury securities per month and of "at least $20 billion" agency MBS per month starting in January. A similar reduction in asset purchases in February (to $20 billion in Treasury securities and $10 billion in agency MBS) seems likely - and that would be the final asset purchases.
Analysts will be looking for comments on rate hikes (likely in March), runoff of assets (not reinvesting), and possibly even comments on future balance sheet reduction.
Note: No projections will be released at this meeting. However, for review, here are the Here are the December projections. In December, most participants expected 3 rate hikes in 2022.
Wall Street forecasts are for GDP to increase at close to a 6.0% annual rate in Q4 that would put Q4-over-Q4 close to the December projections.
1 Projections of change in real GDP and inflation are from the fourth quarter of the previous year to the fourth quarter of the year indicated.
The unemployment rate was at 3.9% in December. That put Q4 unemployment close to the December projections.
2 Projections for the unemployment rate are for the average civilian unemployment rate in the fourth quarter of the year indicated.
As of November 2021, PCE inflation was up 5.7% from November 2020.
So, inflation was above expectations in Q4.
PCE core inflation was up 4.7% in November year-over-year.
Core inflation was also above expectations in Q4.
Wall Street forecasts are for GDP to increase at close to a 6.0% annual rate in Q4 that would put Q4-over-Q4 close to the December projections.
| GDP projections of Federal Reserve Governors and Reserve Bank presidents, Change in Real GDP1 | ||||
|---|---|---|---|---|
| Projection Date | 2021 | 2022 | 2023 | 2024 |
| Dec 2021 | 5.5 | 3.6 to 4.5 | 2.0 to 2.5 | 1.8 to 2.0 |
| Sept 2021 | 5.8 to 6.0 | 3.4 to 4.5 | 2.2 to 2.5 | 2.0 to 2.2 |
The unemployment rate was at 3.9% in December. That put Q4 unemployment close to the December projections.
| Unemployment projections of Federal Reserve Governors and Reserve Bank presidents, Unemployment Rate2 | ||||
|---|---|---|---|---|
| Projection Date | 2021 | 2022 | 2023 | 2024 |
| Dec 2021 | 4.2 to 4.3 | 3.4 to 3.7 | 3.2 to 3.6 | 3.2 to 3.7 |
| Sept 2021 | 4.6 to 4.8 | 3.6 to 4.0 | 3.3 to 3.7 | 3.3 to 3.6 |
As of November 2021, PCE inflation was up 5.7% from November 2020.
So, inflation was above expectations in Q4.
| Inflation projections of Federal Reserve Governors and Reserve Bank presidents, PCE Inflation1 | ||||
|---|---|---|---|---|
| Projection Date | 2021 | 2022 | 2023 | 2024 |
| Dec 2021 | 5.3 to 5.4 | 2.2 to 3.0 | 2.1 to 2.5 | 2.0 to 2.2 |
| Sept 2021 | 4.0 to 4.3 | 2.0 to 2.5 | 2.0 to 2.3 | 2.0 to 2.2 |
PCE core inflation was up 4.7% in November year-over-year.
Core inflation was also above expectations in Q4.
| Core Inflation projections of Federal Reserve Governors and Reserve Bank presidents, Core Inflation1 | ||||
|---|---|---|---|---|
| Projection Date | 2021 | 2022 | 2023 | 2024 |
| Dec 2021 | 4.4 | 2.5 to 3.0 | 2.1 to 2.4 | 2.0 to 2.2 |
| Sept 2021 | 3.6 to 3.8 | 2.0 to 2.5 | 2.0 to 2.3 | 2.0 to 2.2 |
Saturday, January 22, 2022
Real Estate Newsletter Articles this Week
by Calculated Risk on 1/22/2022 02:11:00 PM
At the Calculated Risk Real Estate Newsletter this week:
• 1.44 million Total Housing Completions in 2021 including Manufactured Homes Most since 2007
• Existing-Home Sales Decreased to 6.18 million in December Inventory down 14.2% year-over-year
• December Housing Starts: Most Housing Units Under Construction Since 1973 Housing Starts Increased to 1.702 million Annual Rate in December
• 4th Look at Local Housing Markets in December
• Altos Research: Existing Home Inventory at Record Low "Investor/speculator activity merits attention"
This is usually published several times a week, and provides more in-depth analysis of the housing market.
The blog will continue as always!
You can subscribe at https://calculatedrisk.substack.com/ Most content is available for free, but please subscribe!.
You can subscribe at https://calculatedrisk.substack.com/ Most content is available for free, but please subscribe!.
Schedule for Week of January 23, 2022
by Calculated Risk on 1/22/2022 08:11:00 AM
The key reports scheduled for this week are the advance estimate of Q4 GDP and December New Home sales. Other key indicators include December Personal Income and Outlays and November Case-Shiller house prices.
For manufacturing, the Richmond and Kansas City Fed manufacturing surveys will be released.
The FOMC meets this week, and they are expected to announce the final asset purchases.
8:30 AM ET: Chicago Fed National Activity Index for December. This is a composite index of other data.
9:00 AM: FHFA House Price Index for November. This was originally a GSE only repeat sales, however there is also an expanded index.
 9:00 AM ET: S&P/Case-Shiller House Price Index for November.
This graph shows the Year over year change in the nominal seasonally adjusted National Index, Composite 10 and Composite 20 indexes through the most recent report (the Composite 20 was started in January 2000).
The consensus is for a 18.0% year-over-year increase in the Comp 20 index.
10:00 AM: Richmond Fed Survey of Manufacturing Activity for January.
10:00 AM: State Employment and Unemployment (Monthly) for December 2021
7:00 AM ET: The Mortgage Bankers Association (MBA) will release the results for the mortgage purchase applications index.
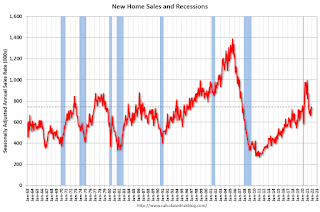 10:00 AM: New Home Sales for December from the Census Bureau.
 This graph shows New Home Sales since 1963.
The dashed line is the sales rate for last month.
The consensus is for 760 thousand SAAR, up from 744 thousand in November.
2:00 PM: FOMC Meeting Statement. The FOMC is expected to announce the final asset purchases.
2:30 PM: Fed Chair Jerome Powell holds a press briefing following the FOMC announcement.
8:30 AM: Gross Domestic Product, 4th quarter 2021 (Advance estimate). The consensus is that real GDP increased 5.4% annualized in Q4.
8:30 AM: The initial weekly unemployment claims report will be released. The consensus is for a decrease to 260 thousand from 286 thousand last week.
8:30 AM: Durable Goods Orders for December. The consensus is for a 0.5% decrease in durable goods.
10:00 AM: Pending Home Sales Index for December. The consensus is for a 0.3% increase in the index.
11:00 AM: the Kansas City Fed manufacturing survey for January. This is the last of regional manufacturing surveys for January.
8:30 AM ET: Personal Income and Outlays for December. The consensus is for a 0.5% increase in personal income, and for a 0.5% decrease in personal spending. And for the Core PCE price index to increase 0.5%.
10:00 AM: University of Michigan's Consumer sentiment index (Final for January). The consensus is for a reading of 68.6.


