 RSS Feed
 by Calculated Risk on 12/30/2021 03:12:00 PM
Thursday, December 30, 2021
Question #8 for 2022: Housing Credit: Will we see easier mortgage lending in 2022?
Today, in the Real Estate Newsletter: Question #8 for 2022: Housing Credit: Will we see easier mortgage lending in 2022?
A brief excerpt:
Earlier I posted some questions on my blog for next year: Ten Economic Questions for 2022. Some of these questions concern real estate (inventory, house prices, housing credit, housing starts, new home sales), and I’ll post those in the newsletter (others like GDP and employment will be on my blog).There is much more in the article. You can subscribe at https://calculatedrisk.substack.com/
I'm adding some thoughts, and maybe some predictions for each question.
...
For Q3 2021, the Net Equity Extraction was $147 billion, or 3.24% of Disposable Personal Income (DPI). The last two quarters have shown a sharp increase in equity extraction compared to recent years, but the level is nothing like the amount of equity extraction during the housing bubble as a percent of DPI. During the housing bubble we saw several quarters with MEW above 8% of DPI.
...
Mortgage equity withdrawal will probably decline in 2022, since fewer homeowners will refinance their mortgages. However, there is some concern about banks easing lending standards, and the rapid increase in non-QM loans.
This will be something to watch in 2022, but overall lending is still solid (unlike during the housing bubble).
Question #9 for 2022: What will happen with house prices in 2022?
by Calculated Risk on 12/30/2021 10:16:00 AM
Today, in the Real Estate Newsletter: Question #9 for 2022: What will happen with house prices in 2022?
A brief excerpt:
Earlier I posted some questions on my blog for next year: Ten Economic Questions for 2022. Some of these questions concern real estate (inventory, house prices, housing credit, housing starts, new home sales), and I’ll post those in the newsletter (others like GDP and employment will be on my blog).There is much more in the article. You can subscribe at https://calculatedrisk.substack.com/
I'm adding some thoughts, and maybe some predictions for each question.
...
If inventory doesn’t increase in 2022, house prices will continue to increase at a double-digit pace. There are several possible reasons for an increase in inventory in 2022. Here are a few:
1. A sharp increase in mortgage rates.
2. Economic problems overseas that spillover into the US.
3. Unregulated areas of finance causing economic problems.
4.Affordability (a combination of higher mortgage rates and higher prices).
A sharp increase in mortgage rates is possible, especially if inflation stays elevated and the pandemic subsides (each wave of the pandemic has pushed down interest rates). And at some point, affordability will start to matter, but in general - with low mortgage rates - houses are still somewhat affordable (see the bottom of this post on affordability).
Weekly Initial Unemployment Claims Decrease to 198,000
by Calculated Risk on 12/30/2021 08:34:00 AM
The DOL reported:
In the week ending December 25, the advance figure for seasonally adjusted initial claims was 198,000, a decrease of 8,000 from the previous week's revised level. The previous week's level was revised up by 1,000 from 205,000 to 206,000. The 4-week moving average was 199,250, a decrease of 7,250 from the previous week's revised average. This is the lowest level for this average since October 25, 1969 when it was 199,250. The previous week's average was revised up by 250 from 206,250 to 206,500.The following graph shows the 4-week moving average of weekly claims since 1971.
emphasis added
 Click on graph for larger image.
The dashed line on the graph is the current 4-week average. The four-week average of weekly unemployment claims increased to 206,000.
The previous week was revised up.
Regular state continued claims decreased to 1,716,000 (SA) from 1,856,000 (SA) the previous week.
Weekly claims were below the consensus forecast.
Wednesday, December 29, 2021
Thursday: Unemployment Claims, Chicago PMI
by Calculated Risk on 12/29/2021 08:18:00 PM
Thursday:
• At 8:30 AM ET, The initial weekly unemployment claims report will be released. Initial claims were 205 thousand last week.
• At 9:45 AM: Chicago Purchasing Managers Index for December.
And on COVID (focus on hospitalizations and deaths):
| COVID Metrics | ||||
|---|---|---|---|---|
| Today | Week Ago | Goal | ||
| Percent fully Vaccinated | 61.9% | --- | ≥70.0%1 | |
| Fully Vaccinated (millions) | 205.6 | --- | ≥2321 | |
| New Cases per Day3🚩 | 277,241 | 162,133 | ≤5,0002 | |
| Hospitalized3🚩 | 64,756 | 61,570 | ≤3,0002 | |
| Deaths per Day3 | 1,085 | 1,227 | ≤502 | |
| 1 Minimum to achieve "herd immunity" (estimated between 70% and 85%). 2my goals to stop daily posts, 37-day average for Cases, Currently Hospitalized, and Deaths 🚩 Increasing 7-day average week-over-week for Cases, Hospitalized, and Deaths ✅ Goal met. | ||||
 Click on graph for larger image.
This graph shows the daily (columns) and 7-day average (line) of positive tests reported.
Las Vegas Visitor Authority for November: Visitor Traffic Down 11.3% Compared to 2019
by Calculated Risk on 12/29/2021 02:16:00 PM
From the Las Vegas Visitor Authority: November 2021 Las Vegas Visitor Statistics
With traditional seasonal decreases after seeing annual peaks in October, November visitation exceeded 3.1M visitors (down ‐8.2% MoM and down ‐11.3% vs. Nov 2019.)
Overall hotel occupancy reached 77.6% for the month (‐4.0 pts MoM) as weekends saw continued strong levels at 90.7% (+0.3 pts MoM) while midweek occupancy ebbed MoM to 71.9% from 77.5% in October.
November room rates approached $156, surpassing Nov 2019 levels by 15.5%, while RevPAR reached $121, up 1.7% vs. Nov 2019.
 Click on graph for larger image.
 Thist graph shows visitor traffic for 2019 (blue), 2020 (orange) and 2021 (red).
Visitor traffic was down 11.3% compared to the same month in 2019.
There was no convention traffic from March 2020 until June 2021 (data still N/A).
I'll add a graph of convention traffic once convention data is available.
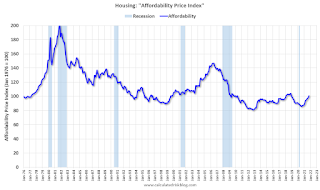
Real House Prices, Price-to-Rent Ratio and Price-to-Median Income in October
by Calculated Risk on 12/29/2021 11:36:00 AM
Today, in the CalculatedRisk Real Estate Newsletter: Real House Prices, Price-to-Rent Ratio and Price-to-Median Income in October
Excerpt:
I’ve put together my own affordability index - since 1976 - that is similar to the FirstAm approach (more of a house price index adjusted by mortgage rates and the median household income).
I used median income from the Census Bureau (estimated 2021), assumed a 15% down payment, and used a 2% estimate for property taxes, insurance and maintenance. This is probably low for high property tax states like New Jersey and Texas, and too high for lower property tax states. If we were including condos, we’d also include HOA fees too (this is excluded).
For house prices, I used the Case-Shiller National Index, Seasonally Adjusted (SA). Also, for the down payment - there wasn’t a significant difference between 15% and 20%. For mortgage rates, I used the Freddie Mac PMMS (30-year fixed rates).
So here is what the index looks like (lower is more affordable like the FirstAm index)
...
In general, this would suggest houses are somewhat affordable right now (due to low mortgage rates). But this says nothing about if “now is a good time to buy” (see the bottom of my post Housing: A Look at "Affordability" Indexes).
Also, in October, the average 30-year mortgage rates were around 3.1%, and currently mortgage rates are close to 3.27% - so we already know the “Affordability Price Index” will increase over the next couple of months (meaning houses are less affordable).
emphasis added
NAR: Pending Home Sales Decreased 2.2% in November
by Calculated Risk on 12/29/2021 10:03:00 AM
From the NAR: Pending Home Sales Subside 2.2% in November
Pending home sales slipped in November, receding slightly after a previous month of gains, according to the National Association of Realtors®. Each of the four major U.S. regions witnessed contract transactions decline month-over-month. Year-over-year activity mostly retreated too, as three regions reported drops and only the Midwest saw an increase.This was well below expectations of a 0.6% increase for this index. Note: Contract signings usually lead sales by about 45 to 60 days, so this would usually be for closed sales in December and January.
The Pending Home Sales Index (PHSI), a forward-looking indicator of home sales based on contract signings, fell 2.2.% to 122.4 in November. Year-over-year, signings slid 2.7%. An index of 100 is equal to the level of contract activity in 2001.
...
Month-over-month, the Northeast PHSI declined 0.1% to 99.4 in November, an 8.5% drop from a year ago. In the Midwest, the index fell 6.3% to 116.8 last month, up 0.2% from November 2020.
Pending home sales transactions in the South ticked down 0.7% to an index of 148.2 in November, down 1.3% from November 2020. The index in the West slipped 2.2% in November to 105.5, down 4.6% from a year prior.
emphasis added
Tuesday, December 28, 2021
Wednesday: Pending Home Sales
by Calculated Risk on 12/28/2021 08:20:00 PM
Wednesday:
• At 7:00 AM ET, The Mortgage Bankers Association (MBA) will release the results for the mortgage purchase applications index.
• At 10:00 AM, Pending Home Sales Index for November. The consensus is for a 0.6% increase in the index.
And on COVID (focus on hospitalizations and deaths):
| COVID Metrics | ||||
|---|---|---|---|---|
| Today | Week Ago | Goal | ||
| Percent fully Vaccinated | 61.8% | --- | ≥70.0%1 | |
| Fully Vaccinated (millions) | 205.2 | --- | ≥2321 | |
| New Cases per Day3🚩 | 240,408 | 150,575 | ≤5,0002 | |
| Hospitalized3🚩 | 63,106 | 61,471 | ≤3,0002 | |
| Deaths per Day3 | 1,096 | 1,181 | ≤502 | |
| 1 Minimum to achieve "herd immunity" (estimated between 70% and 85%). 2my goals to stop daily posts, 37-day average for Cases, Currently Hospitalized, and Deaths 🚩 Increasing 7-day average week-over-week for Cases, Hospitalized, and Deaths ✅ Goal met. | ||||
 Click on graph for larger image.
This graph shows the daily (columns) and 7-day average (line) of positive tests reported.
A few comments on the Seasonal Pattern for House Prices
by Calculated Risk on 12/28/2021 03:19:00 PM
A few key points:
1) There is a clear seasonal pattern for house prices.
2) The surge in distressed sales during the housing bust distorted the seasonal pattern.
3) Even though distressed sales are down significantly, the seasonal factor is based on several years of data - and the factor is now closer to normal (second graph below).
4) Still the seasonal index is probably a better indicator of actual price movements than the Not Seasonally Adjusted (NSA) index.
For in depth description of these issues, see Jed Kolko's article from 2014 (currently Chief Economist at Indeed) "Let’s Improve, Not Ignore, Seasonal Adjustment of Housing Data"
Note: I was one of several people to question the change in the seasonal factor (here is a post in 2009) - and this led to S&P Case-Shiller questioning the seasonal factor too (from April 2010). I still use the seasonal factor (I think it is better than using the NSA data).

This graph shows the month-to-month change in the NSA Case-Shiller National index since 1987 (through October 2021). The seasonal pattern was smaller back in the '90s and early '00s and increased once the bubble burst.
The seasonal swings declined following the bubble, however the recent price surge changed the month-over-month pattern.
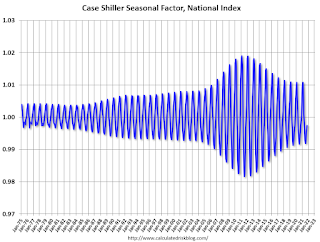
The swings in the seasonal factors have decreased, and the seasonal factors has been moving back towards more normal levels.
Note that the recent price surge hasn't distorted the seasonal factors.
Comments on Case-Shiller and FHFA House Price Increases
by Calculated Risk on 12/28/2021 10:39:00 AM
Today, in the CalculatedRisk Real Estate Newsletter: Case-Shiller National Index up 19.1% Year-over-year in October
Excerpt:
Both the Case-Shiller House Price Index (HPI) and the Federal Housing Finance Agency (FHFA) HPI for October were released today. Here is a graph of the month-over-month (MoM) change in the Case-Shiller National Index Seasonally Adjusted (SA).
The MoM increase in Case-Shiller was at 1.03%; still historically high, but lower than the previous 14 months. House prices started increasing sharply in the Case-Shiller index in August 2020, so the last 15 months have all been historically very strong, but the peak MoM growth is behind us - and the year-over-price growth is starting to decelerate.
...
We are seeing the expected deceleration in house price growth, and this trend will probably continue for at least a few more months (more on this tomorrow). My sense is the Case-Shiller National annual growth rate of 19.99% in August was probably the peak YoY growth rate, however, since the normal level of inventory is probably in the 4 to 6 months range - we’d have to see a significant increase in inventory to sharply slow price increases, and that is why I’m focused on inventory!
emphasis added


