 RSS Feed
 by Calculated Risk on 11/23/2021 09:00:00 PM
Tuesday, November 23, 2021
Wednesday: New Home Sales, GDP, Unemployment Claims, Personal Income & Outlays and More
Wednesday:
• At 7:00 AM ET, The Mortgage Bankers Association (MBA) will release the results for the mortgage purchase applications index.
• At 8:30 AM, The initial weekly unemployment claims report will be released. The consensus is for 270 thousand initial claims, up from 268 thousand last week.
• Also at 8:30 AM, Gross Domestic Product, 3nd quarter 2020 (Second estimate). The consensus is that real GDP increased 2.1% annualized in Q3, up from 2.0% in the advance estimate of GDP.
• Also at 8:30 AM, Durable Goods Orders for October from the Census Bureau. The consensus is for a 0.2% increase in durable goods orders.
• At 10:00 AM, Personal Income and Outlays for October. The consensus is for a 0.2% increase in personal income, and for a 1.0% increase in personal spending. And for the Core PCE price index to increase 0.4%.
• Also at 10:00 AM, New Home Sales for October from the Census Bureau. The consensus is for 801 thousand SAAR, up from 800 thousand in September.
• At 10:00 AM, University of Michigan's Consumer sentiment index (Final for November). The consensus is for a reading of 66.8.
• At 2:00 PM, FOMC Minutes, Meeting of November 2-3, 2021
Freddie Mac: Mortgage Serious Delinquency Rate decreased in October
by Calculated Risk on 11/23/2021 05:43:00 PM
Freddie Mac reported that the Single-Family serious delinquency rate in October was 1.32%, down from 1.46% in September. Freddie's rate is down year-over-year from 2.89% in October 2020.
Freddie's serious delinquency rate peaked in February 2010 at 4.20% following the housing bubble, and peaked at 3.17% in August 2020 during the pandemic.
These are mortgage loans that are "three monthly payments or more past due or in foreclosure".
 Click on graph for larger image
Mortgages in forbearance are being counted as delinquent in this monthly report, but they will not be reported to the credit bureaus.
This is very different from the increase in delinquencies following the housing bubble. Lending standards have been fairly solid over the last decade, and most of these homeowners have equity in their homes - and they will be able to restructure their loans once (if) they are employed.
Also - for multifamily - delinquencies were at 0.10%, down from the peak of 0.20% in April 2021.
November 23rd COVID-19: New Cases and Hospitalizations Increasing
by Calculated Risk on 11/23/2021 05:15:00 PM
The CDC is the source for all data.
According to the CDC, on Vaccinations. Total doses administered: 452,704,982.
| COVID Metrics | ||||
|---|---|---|---|---|
| Today | Week Ago | Goal | ||
| Percent fully Vaccinated | 59.0% | --- | ≥70.0%1 | |
| Fully Vaccinated (millions) | 196.0 | --- | ≥2321 | |
| New Cases per Day3🚩 | 93,668 | 84,051 | ≤5,0002 | |
| Hospitalized3🚩 | 42,841 | 40,688 | ≤3,0002 | |
| Deaths per Day3 | 1,009 | 1,032 | ≤502 | |
| 1 Minimum to achieve "herd immunity" (estimated between 70% and 85%). 2my goals to stop daily posts, 37-day average for Cases, Currently Hospitalized, and Deaths 🚩 Increasing 7-day average week-over-week for Cases, Hospitalized, and Deaths ✅ Goal met. | ||||
IMPORTANT: For "herd immunity" most experts believe we need 70% to 85% of the total population fully vaccinated (or already had COVID). Note: COVID will probably stay endemic (at least for some time).
KUDOS to the residents of the 5 states that have achieved 70% of total population fully vaccinated: Vermont at 72.6%, Rhode Island, Connecticut, Maine, and Massachusetts at 70.8%.
KUDOS also to the residents of the 16 states and D.C. that have achieved 60% of total population fully vaccinated: New York at 68.1%, New Jersey, Maryland, Washington, Virginia, New Hampshire, Oregon, District of Columbia, New Mexico, Colorado, California, Minnesota, Pennsylvania, Illinois, Delaware, Florida, and Hawaii at 60.7%.
The following 19 states have between 50% and 59.9% fully vaccinated: Wisconsin at 59.3%, Nebraska, Iowa, Utah, Michigan, Texas, Kansas, Arizona, Nevada, South Dakota, North Carolina, Alaska, Ohio, Kentucky, Montana, Oklahoma, South Carolina, Missouri and Indiana at 50.5%.
Next up (total population, fully vaccinated according to CDC) are Georgia at 49.3%, Tennessee at 49.3%, Arkansas at 49.0%, Louisiana at 48.6% and North Dakota at 48.6%.
 Click on graph for larger image.
This graph shows the daily (columns) and 7-day average (line) of positive tests reported.
Final Look: Local Housing Markets in October
by Calculated Risk on 11/23/2021 11:19:00 AM
Today, in the Real Estate Newsletter: Final Look: Local Housing Markets in October
Excerpt:
Here is a summary of active listings for the housing markets that have reported in October. For these markets, inventory was down 5.9% in October MoM from September, and down 26.5% YoY.You can subscribe at https://calculatedrisk.substack.com/ (Currently all content is available for free, but please subscribe).
Of these markets, inventories in Jacksonville, Miami and San Diego are at record lows. Sacramento and Washington, D.C. are the only markets with inventory up YoY in October (Austin is essentially unchanged YoY).
Inventory almost always declines seasonally in October, so the MoM decline is not a surprise. Last month, these markets were down 24.5% YoY, so the YoY decline in October is larger than in September. This is not indicating a slowing market.
In California, the C.A.R. reported inventory was down 18.3% YoY, but this isn’t included in the table since C.A.R. doesn’t report monthly numbers.

Update: The Coming Deceleration in House Price Growth
by Calculated Risk on 11/23/2021 09:16:00 AM
Last month, in the Real Estate Newsletter, I wrote: The Coming Deceleration in House Price Growth
Here is an update to the graph:
Not only is Case-Shiller released with a lag (the release next week will be for September, whereas the NAR release yesterday was for October), but the 3-month average means the September release will include sales in July and August too.
Although median prices can be distorted by the mix, and repeat sales indexes (like Case-Shiller and the FHFA) are more accurate measures of house prices, the median price index might provide earlier hints on the direction of prices.
 Click on graph for larger image.
This graph - as of the NAR release in October 2020 (a year ago) - shows median prices started to take off, even though the most recent Case-Shiller report only showed a very modest pickup in prices.
This shows the lag in the Case-Shiller report.
The second graph - as of the NAR release yesterday - shows that Case-Shiller followed the median prices up, and that median prices are now falling.
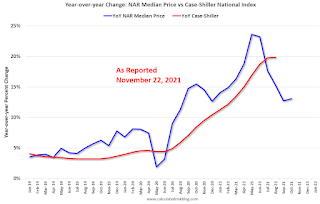 Note: the NAR YoY change in September 2021 was revised down, so there was a slight uptick in October prices YoY.
The second graph - as of the NAR release yesterday - shows that Case-Shiller followed the median prices up, and that median prices are now falling.
 Note: the NAR YoY change in September 2021 was revised down, so there was a slight uptick in October prices YoY.
This suggests that Case-Shiller will start to show some deceleration later this year - but still be up solidly YoY.
Monday, November 22, 2021
"Mortgage Rates Under Pressure After Powell Nomination and Bond Auctions"
by Calculated Risk on 11/22/2021 06:23:00 PM
From Matthew Graham at Mortgage News Daily: Mortgage Rates Under Pressure After Powell Nomination and Bond Auctions
Mortgage rates began the new week on a bad note with the average lender full erasing the improvement seen on Friday. This leaves many lenders at their highest levels since April, but in those cases, it should be noted that today's rates are extremely close to those seen in late October. In other words, we're essentially back in line with the highest levels in more than 7 months. [30 year fixed 3.24%]
emphasis added
November 22nd COVID-19: New Cases and Hospitalizations Increasing
by Calculated Risk on 11/22/2021 03:05:00 PM
The CDC is the source for all data.
According to the CDC, on Vaccinations. Total doses administered: 452,657,967, as of a week ago 442,005,260, or 1.52 million doses per day.
| COVID Metrics | ||||
|---|---|---|---|---|
| Today | Week Ago | Goal | ||
| Percent fully Vaccinated | 59.2% | 58.8% | ≥70.0%1 | |
| Fully Vaccinated (millions) | 196.4 | 195.3 | ≥2321 | |
| New Cases per Day3🚩 | 91,021 | 81,495 | ≤5,0002 | |
| Hospitalized3🚩 | 40,755 | 40,485 | ≤3,0002 | |
| Deaths per Day3 | 985 | 1,042 | ≤502 | |
| 1 Minimum to achieve "herd immunity" (estimated between 70% and 85%). 2my goals to stop daily posts, 37-day average for Cases, Currently Hospitalized, and Deaths 🚩 Increasing 7-day average week-over-week for Cases, Hospitalized, and Deaths ✅ Goal met. | ||||
IMPORTANT: For "herd immunity" most experts believe we need 70% to 85% of the total population fully vaccinated (or already had COVID). Note: COVID will probably stay endemic (at least for some time).
KUDOS to the residents of the 5 states that have achieved 70% of total population fully vaccinated: Vermont at 72.6%, Rhode Island, Connecticut, Maine, and Massachusetts at 70.8%.
KUDOS also to the residents of the 16 states and D.C. that have achieved 60% of total population fully vaccinated: New York at 68.1%, New Jersey, Maryland, Washington, Virginia, New Hampshire, Oregon, District of Columbia, New Mexico, Colorado, California, Minnesota, Pennsylvania, Illinois, Delaware, Florida, and Hawaii at 60.7%.
The following 19 states have between 50% and 59.9% fully vaccinated: Wisconsin at 59.3%, Nebraska, Iowa, Utah, Michigan, Texas, Kansas, Arizona, Nevada, South Dakota, North Carolina, Alaska, Ohio, Kentucky, Montana, Oklahoma, South Carolina, Missouri and Indiana at 50.5%.
Next up (total population, fully vaccinated according to CDC) are Georgia at 49.3%, Tennessee at 49.2%, Arkansas at 49.0%, Louisiana at 48.6% and North Dakota at 48.4%.
 Click on graph for larger image.
This graph shows the daily (columns) and 7-day average (line) of positive tests reported.
More Analysis on Existing Home Sales
by Calculated Risk on 11/22/2021 10:35:00 AM
Today, in the Real Estate Newsletter: Existing-Home Sales Increased to 6.34 million in October
Excerpt:
Sales in October (6.34 million SAAR) were up 0.8% from last month, and were 5.8% below the October 2020 sales rate.You can subscribe at https://calculatedrisk.substack.com/ (Currently all content is available for free, but please subscribe).
Some of the increase in sales since the beginning of the pandemic was probably related to record low mortgage rates, strong second home buying, a strong stock market and favorable demographics.
Also, the delay in the 2020 buying season pushed the seasonally adjusted number to very high levels over the winter. This means there are going to be some difficult year-over-year (YoY) comparisons in the last quarter of 2021.
This graph shows existing home sales by month for 2020 and 2021.
This was the third month this year with sales down year-over-year. This should continue through the rest of the year, since sales averaged 6.7million SAAR over the last three months of 2020.

NAR: Existing-Home Sales Increased to 6.34 million in October
by Calculated Risk on 11/22/2021 10:11:00 AM
From the NAR: Existing-Home Sales Inch Up 0.8% in October
Existing-home sales increased in October, marking two straight months of growth, according to the National Association of Realtors®. Two of the four major U.S. regions saw month-over-month sales climb, one region reported a drop and the fourth area held steady in October. On a year-over-year basis, each region witnessed sales decrease.
Total existing-home sales, completed transactions that include single-family homes, townhomes, condominiums and co-ops, rose 0.8% from September to a seasonally adjusted annual rate of 6.34 million in October. Sales fell 5.8% from a year ago (6.73 million in October 2020).
...
Total housing inventory at the end of October amounted to 1.25 million units, down 0.8% from September and down 12.0% from one year ago (1.42 million). Unsold inventory sits at a 2.4-month supply at the current sales pace, equal to September's supply, and down from 2.5 months in October 2020.
emphasis added
 Click on graph for larger image.
This graph shows existing home sales, on a Seasonally Adjusted Annual Rate (SAAR) basis since 1993.
Sales in October (6.34 million SAAR) were up 0.8% from last month, and were 5.8% below the October 2020 sales rate.
The second graph shows nationwide inventory for existing homes.
 According to the NAR, inventory decreased to 1.25 million in October from 1.26 million in September.
Headline inventory is not seasonally adjusted, and inventory usually decreases to the seasonal lows in December and January, and peaks in mid-to-late summer.
The last graph shows the year-over-year (YoY) change in reported existing home inventory and months-of-supply. Since inventory is not seasonally adjusted, it really helps to look at the YoY change. Note: Months-of-supply is based on the seasonally adjusted sales and not seasonally adjusted inventory.
 Inventory was down 12.0% year-over-year in October compared to October 2020.
Months of supply was unchanged at 2.4 months in October from 2.4 months in September.
This was above the consensus forecast. I'll have more later.
The last graph shows the year-over-year (YoY) change in reported existing home inventory and months-of-supply. Since inventory is not seasonally adjusted, it really helps to look at the YoY change. Note: Months-of-supply is based on the seasonally adjusted sales and not seasonally adjusted inventory.
 Inventory was down 12.0% year-over-year in October compared to October 2020.
 Months of supply was unchanged at 2.4 months in October from 2.4 months in September.
This was above the consensus forecast. I'll have more later.
Housing Inventory Nov 22nd Update: Inventory Down 2.3% Week-over-week
by Calculated Risk on 11/22/2021 09:46:00 AM
Tracking existing home inventory will be very important this year.
 Click on graph for larger image in graph gallery.
This inventory graph is courtesy of Altos Research.
As of November 19th, inventory was at 385 thousand (7 day average), compared to 514 thousand for the same week a year ago. That is a decline of 25.2%.
Compared to the same week in 2019, inventory is down 56.1% from 877 thousand. A week ago, inventory was at 394 thousand, and was down 25.0% YoY.
Seasonally, inventory bottomed in April (usually inventory bottoms in January or February). Inventory was about 26% above the record low in early April.
Inventory peaked for the year in early September. Eleven weeks ago inventory was at 437 thousand (the peak for the year), so inventory is currently off about 12.0% from the peak for the year.
Mike Simonsen discusses this data regularly on Youtube.
Altos Research has also seen a significant pickup in price decreases - now well above the level of a year ago - but still below a normal rate for November.


