by Calculated Risk on 11/17/2021 09:02:00 AM
Wednesday, November 17, 2021
Most Housing Units Under Construction Since 1974
Today, in the Real Estate Newsletter: Most Housing Units Under Construction Since 1974
Excerpt:
The fourth graph shows starts under construction, Seasonally Adjusted (SA).You can subscribe at https://calculatedrisk.substack.com/ (Currently all content is available for free, but please subscribe).
Red is single family units. Currently there are 726 thousand single family units under construction (SA). This is the highest level since 2007.
For single family, most of these homes are already sold (Census counts sales when contract is signed). The reason there are so many homes is probably due to construction delays. Since most of these are already sold, it is unlikely this is “overbuilding”, or that this will impact prices.
Blue is for 2+ units. Currently there are 725 thousand multi-family units under construction. This is the highest level since 1974! For multi-family, construction delays are probably also a factor. The completion of these units should help with rent pressure.
Census will release data next year on the length of time from start to completion, and that will probably show long delays in 2021. In 2020, it took an average of 6.8 months from start to completion for single family homes, and 15.4 months for buildings with 2 or more units.
Combined, there are 1.451 million units under construction. This is the most since 1974.
Housing Starts Decreased to 1.520 Million Annual Rate in October
by Calculated Risk on 11/17/2021 08:37:00 AM
From the Census Bureau: Permits, Starts and Completions
Housing Starts:
Privately‐owned housing starts in October were at a seasonally adjusted annual rate of 1,520,000. This is 0.7 percent below the revised September estimate of 1,530,000, but is 0.4 percent above the October 2020 rate of 1,514,000. Single‐family housing starts in October were at a rate of 1,039,000; this is 3.9 percent below the revised September figure of 1,081,000. The October rate for units in buildings with five units or more was 470,000.
Building Permits:
Privately‐owned housing units authorized by building permits in October were at a seasonally adjusted annual rate of 1,650,000. This is 4.0 percent above the revised September rate of 1,586,000 and is 3.4 percent above the October 2020 rate of 1,595,000. Single‐family authorizations in October were at a rate of 1,069,000; this is 2.7 percent above the revised September figure of 1,041,000. Authorizations of units in buildings with five units or more were at a rate of 528,000 in October.
emphasis added
 Click on graph for larger image.
The first graph shows single and multi-family housing starts for the last several years.
Multi-family starts (blue, 2+ units) increased in October compared to September. Multi-family starts were up 37% year-over-year in October.
Single-family starts (red) decreased in October, and were down 10.6% year-over-year.
 The second graph shows single and multi-family housing starts since 1968.
 This shows the huge collapse following the housing bubble, and then the eventual recovery (but still not historically high).
Total housing starts in October were below expectations, and starts in August and September were revised down, combined.
I'll have more later …
MBA: Mortgage Applications Decrease in Latest Weekly Survey
by Calculated Risk on 11/17/2021 07:00:00 AM
From the MBA: Mortgage Applications Decrease in Latest MBA Weekly Survey
Mortgage applications decreased 2.8 percent from one week earlier, according to data from the Mortgage Bankers Association’s (MBA) Weekly Mortgage Applications Survey for the week ending November 12, 2021.
... The Refinance Index decreased 5 percent from the previous week and was 31 percent lower than the same week one year ago. The seasonally adjusted Purchase Index increased 2 percent from one week earlier. The unadjusted Purchase Index decreased 2 percent compared with the previous week and was 6 percent lower than the same week one year ago.
“Refinance applications decreased for the seventh time in eight weeks, as mortgage rates moved higher after two weeks of declines. Activity has been particularly sensitive to rate movements, and last week’s decline was driven by a drop in conventional and FHA refinance applications, which offset an increase in VA refinance applications. All mortgage rates in MBA’s survey increased, with the 30-year fixed rate climbing to 3.2 percent.” said Joel Kan, MBA’s Associate Vice President of Economic and Industry Forecasting. “Purchase applications increased for both conventional and government loan segments, as housing demand continues to show resiliency at a time – late fall – when home buying activity typically slows. The second straight increase in purchase applications suggests that stronger sales activity may continue in the weeks to come. Despite elevated demand, purchase applications were 5.7 percent lower than a year ago.”
...
The average contract interest rate for 30-year fixed-rate mortgages with conforming loan balances ($548,250 or less) increased to 3.20 percent from 3.16 percent, with points increasing to 0.43 from 0.34 (including the origination fee) for 80 percent loan-to-value ratio (LTV) loans.
emphasis added
 Click on graph for larger image.
The first graph shows the refinance index since 1990.
With relatively low rates, the index remains somewhat elevated.
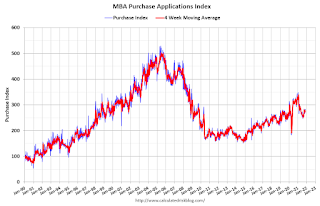
The second graph shows the MBA mortgage purchase index
 According to the MBA, purchase activity is down 6% year-over-year unadjusted.
Note: Red is a four-week average (blue is weekly).
Tuesday, November 16, 2021
Wednesday: Housing Starts, Architecture Billings Index
by Calculated Risk on 11/16/2021 08:16:00 PM
Wednesday:
• At 7:00 AM ET, The Mortgage Bankers Association (MBA) will release the results for the mortgage purchase applications index.
• At 8:30 AM, Housing Starts for October. The consensus is for 1.580 million SAAR, up from 1.555 million SAAR.
• During the day, The AIA's Architecture Billings Index for October (a leading indicator for commercial real estate).
November 16th COVID-19: New Cases Increasing, Above 83K per Day
by Calculated Risk on 11/16/2021 04:15:00 PM
| COVID Metrics | ||||
|---|---|---|---|---|
| Today | Week Ago | Goal | ||
| Percent fully Vaccinated | 58.9% | 58.4% | ≥70.0%1 | |
| Fully Vaccinated (millions) | 195.4 | 193.8 | ≥2321 | |
| New Cases per Day3🚩 | 83,671 | 73,349 | ≤5,0002 | |
| Hospitalized3 | 39,884 | 40,419 | ≤3,0002 | |
| Deaths per Day3 | 1,029 | 1,072 | ≤502 | |
| 1 Minimum to achieve "herd immunity" (estimated between 70% and 85%). 2my goals to stop daily posts, 37 day average for Cases, Currently Hospitalized, and Deaths 🚩 Increasing 7 day average week-over-week for Cases, Hospitalized, and Deaths ✅ Goal met. | ||||
IMPORTANT: For "herd immunity" most experts believe we need 70% to 85% of the total population fully vaccinated (or already had COVID). Note: COVID will probably stay endemic (at least for some time).
The following 19 states have between 50% and 59.9% fully vaccinated: Wisconsin at 59.0%, Nebraska, Iowa, Utah, Michigan, Texas, Kansas, Arizona, Nevada, South Dakota, North Carolina, Alaska, Ohio, Kentucky, Montana, Oklahoma, South Carolina, Missouri and Indiana at 50.3%.
Next up (total population, fully vaccinated according to CDC) are Georgia at 49.0%, Tennessee at 48.9%, Arkansas at 48.8%, Louisiana at 48.3% and North Dakota at 48.2%.
 Click on graph for larger image.
This graph shows the daily (columns) and 7 day average (line) of positive tests reported.
October California Home Sales
by Calculated Risk on 11/16/2021 02:04:00 PM
Today, in the Real Estate Newsletter: October California Home Sales
Excerpt:
Sales Down 10.4% YoY. Active Listings down 18.3%You can subscribe at https://calculatedrisk.substack.com/ (Currently all content is available for free, but please subscribe).
...
California is a key market, and sometimes we see trends in California early. Unfortunately the C.A.R. doesn’t release monthly sales or inventory numbers. Not Seasonally Adjusted (NSA).
...
"October’s sales pace dipped 0.9 percent on a monthly basis from 438,190 in September and was down 10.4 percent from a year ago, when 484,510 homes were sold on an annualized basis."
"California’s Unsold Inventory Index (UII) dipped on a month-to-month basis for the first time in four months, as active listings fell 18.3 percent from last year."
NAHB: Builder Confidence Increased to 83 in November
by Calculated Risk on 11/16/2021 10:07:00 AM
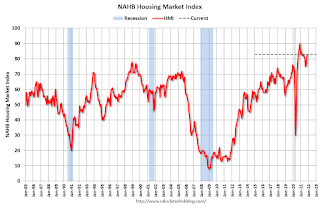
The National Association of Home Builders (NAHB) reported the housing market index (HMI) was at 83, up from 80 in October. Any number above 50 indicates that more builders view sales conditions as good than poor.
From the NAHB: Builder Confidence Up on Strong Demand Even as Supply Side Challenges Persist
Low existing inventories and strong buyer demand helped push builder confidence higher for the third consecutive month even as supply-side challenges — including building material bottlenecks and lot and labor shortages — remain stubbornly persistent. Builder sentiment in the market for newly built single-family homes moved three points higher to 83 in November, according to the NAHB/Wells Fargo Housing Market Index (HMI) released today.
“The solid market for home building continued in November despite ongoing supply-side challenges,” said NAHB Chairman Chuck Fowke. “Lack of resale inventory combined with strong consumer demand continues to boost single-family home building.”
“In addition to well publicized concerns over building materials and the national supply chain, labor and building lot access are key constraints for housing supply,” said NAHB Chief Economist Robert Dietz. “Lot availability is at multi-decade lows and the construction industry currently has more than 330,000 open positions. Policymakers need to focus on resolving these issues to help builders produce more housing to meet strong market demand.”
...
The HMI index gauging current sales conditions rose three points to 89 and the gauge charting traffic of prospective buyers also posted a three-point gain to 68. The component measuring sales expectations in the next six months held steady at 84.
Looking at the three-month moving averages for regional HMI scores, the Midwest rose four points to 72, the South registered a four-point gain to 84 and the West rose one point to 84. The Northeast fell two points to 70.
 Click on graph for larger image.
This graph show the NAHB index since Jan 1985.
This was above the consensus forecast, and a strong reading.
Industrial Production Increased 1.6 Percent in October; Back to Pre-pandemic Levels
by Calculated Risk on 11/16/2021 09:22:00 AM
From the Fed: Industrial Production and Capacity Utilization
Industrial production rose 1.6 percent in October after falling 1.3 percent in September; about half of the gain in October reflected a recovery from the effects of Hurricane Ida. Manufacturing output increased 1.2 percent in October; excluding a large gain in the production of motor vehicles and parts, factory output moved up 0.6 percent. The output of utilities rose 1.2 percent, and mining output stepped up 4.1 percent.
At 101.6 percent of its 2017 average, total industrial production in October was 5.1 percent above its year-earlier level and at its highest reading since December 2019. In October, capacity utilization for the industrial sector increased 1.2 percentage points to 76.4 percent; even so, it was still 3.2 percentage points below its long-run (1972–2020) average.
emphasis added
 Click on graph for larger image.
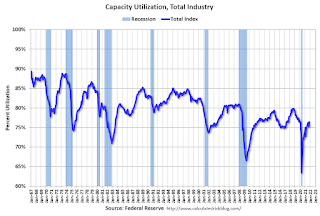
This graph shows Capacity Utilization. This series is up from the record low set in April 2020, and back to the level in February 2020 (pre-pandemic).
Capacity utilization at 76.4% is 3.2% below the average from 1972 to 2020. This was above consensus expectations.
Note: y-axis doesn't start at zero to better show the change.
 The second graph shows industrial production since 1967.
Industrial production increased in October to 100.0. This is slightly above the February 2020 level.
The change in industrial production was above consensus expectations.
Retail Sales Increased 1.7% in October
by Calculated Risk on 11/16/2021 08:37:00 AM
On a monthly basis, retail sales were increased 1.7% from September to October (seasonally adjusted), and sales were up 16.3 percent from October 2020.
From the Census Bureau report:
Advance estimates of U.S. retail and food services sales for October 2021, adjusted for seasonal variation and holiday and trading-day differences, but not for price changes, were $638.2 billion, an increase of 1.7 percent from the previous month, and 16.3 percent above October 2020.
emphasis added
 Click on graph for larger image.
This graph shows retail sales since 1992. This is monthly retail sales and food service, seasonally adjusted (total and ex-gasoline).
Retail sales ex-gasoline were up 1.5% in October.
The second graph shows the year-over-year change in retail sales and food service (ex-gasoline) since 1993.
 Retail and Food service sales, ex-gasoline, increased by 13.9% on a YoY basis.
Sales in October were above expectations, and sales in August and September were revised up.
Monday, November 15, 2021
Tuesday: Retail Sales, Industrial Production, Homebuilder Survey
by Calculated Risk on 11/15/2021 07:36:00 PM
From Matthew Graham at Mortgage News Daily: Upward Momentum Continues For Mortgage Rates
After hitting the lowest levels in over a month last Tuesday, mortgage rates have been moving higher fairly quickly each day since then. Most of the damage occurred on Wednesday and Friday of last week (markets were closed on Thursday), but today got progressively worse as the hours ticked by. [30 year fixed 3.23%]Tuesday:
emphasis added
• At 8:30 AM ET, Retail sales for October will be released. The consensus is for a 1.1% increase in retail sales.
• At 9:15 AM, The Fed will release Industrial Production and Capacity Utilization for October. The consensus is for a 0.7% increase in Industrial Production, and for Capacity Utilization to increase to 75.7%.
• At 10:00 AM, The November NAHB homebuilder survey. The consensus is for a reading of 80, unchanged from 80. Any number above 50 indicates that more builders view sales conditions as good than poor.


