 RSS Feed
 by Calculated Risk on 7/29/2021 09:00:00 PM
Thursday, July 29, 2021
Friday: Personal Income and Outlays
Friday:
• At 8:30 AM ET,: Personal Income and Outlays, June 2020. The consensus is for a 0.3% decrease in personal income, and for a 0.7% increase in personal spending. And for the Core PCE price index to increase 0.6%.
• At 9:45 AM, Chicago Purchasing Managers Index for July.
• At 10:00 AM, University of Michigan's Consumer sentiment index (Final for July). The consensus is for a reading of 80.8.
July 29th COVID-19, New Cases, Hospitalizations, Vaccinations
by Calculated Risk on 7/29/2021 03:49:00 PM
The 7-day average cases is the highest since April 18th.
The 7-day average hospitalizations is the highest since May 9th.
This data is from the CDC.
According to the CDC, on Vaccinations.
Total doses administered: 344,071,595, as of a week ago 339,763,765. Average doses last week: 0.62 million per day.
| COVID Metrics | ||||
|---|---|---|---|---|
| Today | Yesterday | Week Ago | Goal | |
| Percent over 18, One Dose | 69.4% | 69.3% | 68.6% | ≥70.0%1,2 |
| Fully Vaccinated✅ (millions) | 163.9 | 163.6 | 162.2 | ≥1601 |
| New Cases per Day3🚩 | 66,606 | 62,231 | 40,596 | ≤5,0002 |
| Hospitalized3🚩 | 31,148 | 29,541 | 21,464 | ≤3,0002 |
| Deaths per Day3🚩 | 296 | 296 | 222 | ≤502 |
| 1 America's Short Term Goals, 2my goals to stop daily posts, 37 day average for Cases, Hospitalized, and Deaths 🚩 Increasing 7 day average week-over-week for Cases, Hospitalized, and Deaths ✅ Goal met (even if late). | ||||
KUDOS to the residents of the 20 states and D.C. that have achieved the 70% goal (percent over 18 with at least one dose): Vermont, Hawaii, Massachusetts and Connecticut are at 80%+, and Maine, New Mexico, New Jersey, Rhode Island, Pennsylvania, California, Maryland, Washington, New Hampshire, New York, Illinois, Virginia, Delaware, Minnesota, Oregon, Colorado and D.C. are all over 70%.
Next up are Florida at 68.2%, Utah at 67.7%, Wisconsin at 67.1%, Nebraska at 67.1%, South Dakota at 66.1%, Kansas at 66.0%, Iowa at 65.5%, and Nevada at 65.2%.
 Click on graph for larger image.
This graph shows the daily (columns) and 7 day average (line) of positive tests reported.
This data is from the CDC.
Las Vegas Visitor Authority for June: Convention Attendance N/A, Visitor Traffic Down 18% Compared to 2019
by Calculated Risk on 7/29/2021 02:44:00 PM
From the Las Vegas Visitor Authority: June 2021 Las Vegas Visitor Statistics
Marking the sixth consecutive month of MoM gains, June saw the destination host more than 2.9 million visitors, +3.2% MoM and down ‐17.6% vs. June 2019.
While convention and group data continue to be gathered, the return of several conventions including World of Concrete, Surfaces, Nightclub & Bar and the Int'l Esthetics, Cosmetics & Spa Conference helped support midweek business.
Hotel occupancy continued to improve, reaching 75.9% (up 5.0 pts MoM, down ‐15.8 pts vs. June 2019), as Weekend occupancy neared 90% (89.4%) and Midweek occupancy reached 70.9% (up 8.1 pts MoM, down ‐18.8 pts vs. June 2019.)
 Click on graph for larger image.
 The first graph shows visitor traffic for 2019 (blue), 2020 (orange) and 2021 (red).
Visitor traffic was down 17.6% compared to the same month in 2019.
There had been no convention traffic since March 2020, but there were a few conventions in June (data not available yet).
I'll add a graph of convention traffic once convention data is available.
Note: Conventions started again in June, but the data isn't available yet.
Hotels: Occupancy Rate Down 8% Compared to Same Week in 2019
by Calculated Risk on 7/29/2021 11:44:00 AM
Note: The year-over-year occupancy comparisons are easy, since occupancy declined sharply at the onset of the pandemic. So STR is comparing to the same week in 2019.
The occupancy rate is down 7.8% compared to the same week in 2019.
U.S. weekly hotel occupancy reached its highest level since October 2019, while room rates hit an all-time high, according to STR‘s latest data through July 24.The following graph shows the seasonal pattern for the hotel occupancy rate using the four week average.
July 18-24, 2021 (percentage change from comparable week in 2019*):
• Occupancy: 71.4% (-7.8%)
• Average daily rate (ADR): $141.75 (+4.0%)
• Revenue per available room (RevPAR): $101.24 (-4.2%)
Historically, the middle weeks of July are the country’s highest occupancy weeks each year, and 2021 has been no different even as demand slows week to week.
emphasis added
 Click on graph for larger image.
The red line is for 2021, black is 2020, blue is the median, dashed purple is 2019, and dashed light blue is for 2009 (the worst year on record for hotels prior to 2020).
Occupancy is well above the horrible 2009 levels and weekend occupancy (leisure) has been solid.
Note: Y-axis doesn't start at zero to better show the seasonal change.
Note: Y-axis doesn't start at zero to better show the seasonal change.
With solid leisure travel, the Summer months have had decent occupancy - but it is uncertain what will happen in the Fall with business travel.
NAR: Pending Home Sales Decreased 1.9% in June
by Calculated Risk on 7/29/2021 10:04:00 AM
From the NAR: Pending Home Sales Fall 1.9% in June
Pending home sales declined marginally in June after recording a notable gain in May, the National Association of Realtors® reported. Contract activity was split in the four major U.S. regions from both a year-over-year and month-over-month perspective. The Northeast recorded the only yearly gains in June.This was below expectations of a 0.5% increase for this index. Note: Contract signings usually lead sales by about 45 to 60 days, so this would usually be for closed sales in July and August.
The Pending Home Sales Index (PHSI), a forward-looking indicator of home sales based on contract signings, fell 1.9% to 112.8 in June. Year-over-year, signings also slipped 1.9%. An index of 100 is equal to the level of contract activity in 2001.
...
The Northeast PHSI increased 0.5% to 98.5 in June, an 8.7% rise from a year ago. In the Midwest, the index grew 0.6% to 108.3 last month, down 2.4% from June 2020.
Pending home sales transactions in the South fell 3.0% to an index of 132.4 in June, down 4.7% from June 2020. The index in the West decreased 3.8% in June to 98.1, down 2.6% from a year prior.
emphasis added
A Few Comments on Q2 GDP
by Calculated Risk on 7/29/2021 09:14:00 AM
Earlier from the BEA: Gross Domestic Product, Second Quarter 2021 (Advance Estimate) and Annual Update
Real gross domestic product (GDP) increased at an annual rate of 6.5 percent in the second quarter of 2021, according to the "advance" estimate released by the Bureau of Economic Analysis. In the first quarter, real GDP increased 6.3 percent (revised).On a Q2-over-Q2 basis, GDP was up 16.7% (Q2 2020 was the depth of pandemic recession).
emphasis added
 Click on graph for larger image.
This graph shows the percent decline in real GDP from the previous peak (the previous peak was in Q4 2019).
This graph is through Q1 2022, and real GDP is now at a new peak; 0.8% above the previous peak.
The advance Q2 GDP report, at 6.5% annualized, was below expectations, due to several factors - a decline in private inventories, a decline in residential investment, a decline in government expenditures and a negative contribution from trade.
Personal consumption expenditures (PCE) increased at a 11.8% annualized rate in Q2, due, in part, to the American Rescue Plan Act.
The second graph below shows the contribution to GDP from residential investment, equipment and software, and nonresidential structures (3 quarter trailing average). This is important to follow because residential investment tends to lead the economy, equipment and software is generally coincident, and nonresidential structure investment trails the economy.
In the graph, red is residential, green is equipment and software, and blue is investment in non-residential structures. So the usual pattern - both into and out of recessions is - red, green, blue.
Of course - with the sudden economic stop due to COVID-19 - the usual pattern doesn't apply.
The dashed gray line is the contribution from the change in private inventories.
 Residential investment (RI) decreased at a 9.8% annual rate in Q2. Equipment investment increased at a 13.0% annual rate, and investment in non-residential structures decreased at a 7.0% annual rate (after getting crushed over the previous year)..
The contribution to Q2 GDP from investment in private inventories was -1.13 percentage points (this will likely be a positive in the second half of 2021).
On a 3 quarter trailing average basis, RI (red) is still up solidly, equipment (green) is up sharply, and nonresidential structures (blue) is still down.
On a 3 quarter trailing average basis, RI (red) is still up solidly, equipment (green) is up sharply, and nonresidential structures (blue) is still down.
I'll post more on the components of non-residential investment once the supplemental data is released.
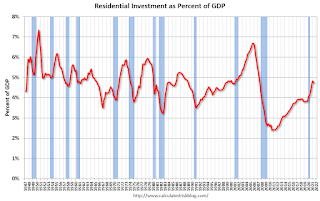 The third graph shows residential investment as a percent of GDP.
Residential Investment as a percent of GDP decreased in Q2, after increasing sharply for several quarters.
I'll break down Residential Investment into components after the GDP details are released.
Note: Residential investment (RI) includes new single family structures, multifamily structures, home improvement, broker's commissions, and a few minor categories.
 The fourth graph shows non-residential investment in
structures, equipment and "intellectual property products".
The fourth graph shows non-residential investment in
structures, equipment and "intellectual property products".
Investment in non-residential structures declined in Q2 as a percent GDP, and will probably be weak for some time (hotel occupancy is still low, office and mall vacancy rates are high).
Weekly Initial Unemployment Claims decrease to 400,000
by Calculated Risk on 7/29/2021 08:38:00 AM
The DOL reported:
In the week ending July 24, the advance figure for seasonally adjusted initial claims was 400,000, a decrease of 24,000 from the previous week's revised level. The previous week's level was revised up by 5,000 from 419,000 to 424,000. The 4-week moving average was 394,500, an increase of 8,000 from the previous week's revised average. The previous week's average was revised up by 1,250 from 385,250 to 386,500.This does not include the 95,166 initial claims for Pandemic Unemployment Assistance (PUA) that was down from 109,868 the previous week.
emphasis added
The following graph shows the 4-week moving average of weekly claims since 1971.
 Click on graph for larger image.
The dashed line on the graph is the current 4-week average. The four-week average of weekly unemployment claims increased to 394,500.
The previous week was revised up.
Regular state continued claims increased to 3,269,000 (SA) from 3,262,000 (SA) the previous week.
Note: There are an additional 5,246,162 receiving Pandemic Unemployment Assistance (PUA) that increased from 5,133,938 the previous week (there are questions about these numbers). This is a special program for business owners, self-employed, independent contractors or gig workers not receiving other unemployment insurance. And an additional 4,233,883 receiving Pandemic Emergency Unemployment Compensation (PEUC) down from 4,134,716.
Weekly claims were at the consensus forecast.
BEA: Real GDP increased at 6.5% Annualized Rate in Q2
by Calculated Risk on 7/29/2021 08:32:00 AM
From the BEA: Gross Domestic Product, Second Quarter 2021 (Advance Estimate) and Annual Update
Real gross domestic product (GDP) increased at an annual rate of 6.5 percent in the second quarter of 2021, according to the "advance" estimate released by the Bureau of Economic Analysis. In the first quarter, real GDP increased 6.3 percent (revised). ...The advance Q2 GDP report, with 6.5% annualized growth, was well below expectations.
The increase in real GDP in the second quarter reflected increases in personal consumption expenditures (PCE), nonresidential fixed investment, exports, and state and local government spending that were partly offset by decreases in private inventory investment, residential fixed investment, and federal government spending. Imports, which are a subtraction in the calculation of GDP, increased.
emphasis added
I'll have more later ...
Wednesday, July 28, 2021
Thursday: GDP, Unemployment Claims, Pending Home Sales
by Calculated Risk on 7/28/2021 09:00:00 PM
Thursday:
• At 8:30 AM ET, Gross Domestic Product, 2nd quarter (advance estimate), and annual update. The consensus is that real GDP increased 8.6% annualized in Q2, up from 6.4% in Q1.
• At 8:30 AM, The initial weekly unemployment claims report will be released. The consensus is for a decrease to 400 thousand from 419 thousand last week.
• At 10:00 AM, Pending Home Sales Index for June. The consensus is for a 0.5% increase in the index.
July 28th COVID-19, New Cases, Hospitalizations, Vaccinations
by Calculated Risk on 7/28/2021 03:32:00 PM
The 7-day average cases is the highest since April 20th.
The 7-day average hospitalizations is the highest since May 12th.
This data is from the CDC.
According to the CDC, on Vaccinations.
Total doses administered: 343,361,524, as of a week ago 339,102,867. Average doses last week: 0.61 million per day.
| COVID Metrics | ||||
|---|---|---|---|---|
| Today | Yesterday | Week Ago | Goal | |
| Percent over 18, One Dose | 69.3% | 69.1% | 68.4% | ≥70.0%1,2 |
| Fully Vaccinated✅ (millions) | 163.6 | 163.3 | 161.9 | ≥1601 |
| New Cases per Day3🚩 | 61,976 | 56,777 | 37,769 | ≤5,0002 |
| Hospitalized3🚩 | 29,383 | 27,973 | 20,395 | ≤3,0002 |
| Deaths per Day3🚩 | 300 | 277 | 206 | ≤502 |
| 1 America's Short Term Goals, 2my goals to stop daily posts, 37 day average for Cases, Hospitalized, and Deaths 🚩 Increasing 7 day average week-over-week for Cases, Hospitalized, and Deaths ✅ Goal met (even if late). | ||||
KUDOS to the residents of the 20 states and D.C. that have achieved the 70% goal (percent over 18 with at least one dose): Vermont, Hawaii, Massachusetts and Connecticut are at 80%+, and Maine, New Mexico, New Jersey, Rhode Island, Pennsylvania, California, Maryland, Washington, New Hampshire, New York, Illinois, Virginia, Delaware, Minnesota, Oregon, Colorado and D.C. are all over 70%.
Next up are Florida at 68.0%, Utah at 67.7%, Wisconsin at 67.0%, Nebraska at 67.0%, South Dakota at 66.0%, Kansas at 65.8%, Iowa at 65.4%, Nevada at 65.0% and Arizona at 64.2%.
 Click on graph for larger image.
This graph shows the daily (columns) and 7 day average (line) of positive tests reported.
This data is from the CDC.


