by Calculated Risk on 7/15/2021 09:23:00 AM
Thursday, July 15, 2021
Industrial Production Increased 0.4 Percent in June
From the Fed: Industrial Production and Capacity Utilization
Industrial production increased 0.4 percent in June after moving up 0.7 percent in May. In June, manufacturing output edged down 0.1 percent, as an ongoing shortage of semiconductors contributed to a decrease of 6.6 percent in the production of motor vehicles and parts. Excluding motor vehicles and parts, factory output increased 0.4 percent. The output of utilities advanced 2.7 percent, reflecting heightened demand for air conditioning, as much of the country experienced a heat wave in June. The index for mining increased 1.4 percent.
For the second quarter as a whole, total industrial production rose at an annual rate of 5.5 percent. Manufacturing output increased at an annual rate of 3.7 percent despite a drop of 22.5 percent for motor vehicles and parts.
At 100.1 percent of its 2017 average, total industrial production in June was 9.8 percent above its year-earlier level but 1.2 percent below its pre-pandemic (February 2020) level. Capacity utilization for the industrial sector rose 0.3 percentage point in June to 75.4 percent, a rate that is 4.2 percentage points below its long-run (1972–2020) average.
emphasis added
 Click on graph for larger image.
This graph shows Capacity Utilization. This series is up from the record low set in April 2020, but still below the level in February 2020.
Capacity utilization at 75.4% is 4.2% below the average from 1972 to 2020.
Note: y-axis doesn't start at zero to better show the change.
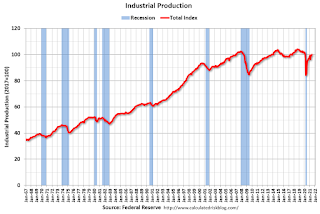
 The second graph shows industrial production since 1967.
Industrial production increased in June to 100.1. This is 1.2% below the February 2020 level.
The change in industrial production was below consensus expectations.
Weekly Initial Unemployment Claims decrease to 360,000
by Calculated Risk on 7/15/2021 08:35:00 AM
The DOL reported:
In the week ending July 10, the advance figure for seasonally adjusted initial claims was 360,000, a decrease of 26,000 from the previous week's revised level. This is the lowest level for initial claims since March 14, 2020 when it was 256,000. The previous week's level was revised up by 13,000 from 373,000 to 386,000. The 4-week moving average was 382,500, a decrease of 14,500 from the previous week's revised average. This is the lowest level for this average since March 14, 2020 when it was 225,500. The previous week's average was revised up by 2,500 from 394,500 to 397,000.This does not include the 96,362 initial claims for Pandemic Unemployment Assistance (PUA) that was down from 100,590 the previous week.
emphasis added
The following graph shows the 4-week moving average of weekly claims since 1971.
 Click on graph for larger image.
The dashed line on the graph is the current 4-week average. The four-week average of weekly unemployment claims increased to 392,750.
The previous week was revised up.
Regular state continued claims decreased to 3,241,000 (SA) from 3,367,000 (SA) the previous week.
Note: There are an additional 5,687,188 receiving Pandemic Unemployment Assistance (PUA) that decreased from 5,824,831 the previous week (there are questions about these numbers). This is a special program for business owners, self-employed, independent contractors or gig workers not receiving other unemployment insurance. And an additional 4,710,359 receiving Pandemic Emergency Unemployment Compensation (PEUC) down from 4,908,107.
Weekly claims were higher than the consensus forecast.
Wednesday, July 14, 2021
Thursday: Unemployment Claims, NY and Philly Fed Mfg, Industrial Production, Fed Chair Powell
by Calculated Risk on 7/14/2021 09:01:00 PM
Thursday:
• At 8:30 AM ET, The initial weekly unemployment claims report will be released. The consensus is for a decrease to 350 thousand from 373 thousand last week.
• Also at 8:30 AM, The New York Fed Empire State manufacturing survey for July. The consensus is for a reading of 18.7, up from 17.4.
• Also at 8:30 AM, the Philly Fed manufacturing survey for July. The consensus is for a reading of 28.0, down from 30.7.
• At 9:15 AM, The Fed will release Industrial Production and Capacity Utilization for June. The consensus is for a 0.7% increase in Industrial Production, and for Capacity Utilization to increase to 75.6%.
• At 9:30 AM, Testimony, Fed Chair Jerome Powell, Semiannual Monetary Policy Report to the Congress, Before the Committee on Banking, Housing, and Urban Affairs, U.S. Senate
Preliminary Existing Home Inventory June: Local Markets
by Calculated Risk on 7/14/2021 04:45:00 PM
I'm gathering existing home data for many local markets, and I'm watching inventory very closely this year.
As I noted in Some thoughts on Housing Inventory
The key for housing in 2021 will be inventory. If inventory stays extremely low, there will be more housing starts and a larger increase in house prices. However, if inventory increases significantly, there will be fewer starts and less price appreciation.Although inventory in these areas is down about 44% year-over-year, inventory is up 13% month-to-month. Seasonally we'd usually expect an increase in inventory from May to June - so this increase is probably seasonal (as opposed to a shift in the market).
| Existing Home Inventory | |||||
|---|---|---|---|---|---|
| Jun-21 | May-21 | Jun-20 | YoY | MoM | |
| Atlanta | 7,787 | 7,530 | 17,596 | -55.7% | 3.4% |
| Boston | 3,822 | 3,418 | 4,697 | -18.6% | 11.8% |
| Colorado | 9,191 | 7,034 | 22,230 | -58.7% | 30.7% |
| Denver | 3,122 | 2,075 | 6,383 | -51.1% | 50.5% |
| Houston | 24,225 | 22,607 | 35,281 | -31.3% | 7.2% |
| Las Vegas | 3,029 | 2,560 | 6,695 | -54.8% | 18.3% |
| Maryland | 8,550 | 7,490 | 15,558 | -45.0% | 14.2% |
| Minnesota | 10,227 | 8,953 | 17,285 | -40.8% | 14.2% |
| New Hampshire | 2,505 | 1,959 | 3,613 | -30.7% | 27.9% |
| North Texas | 9,747 | 8,126 | 19,406 | -49.8% | 19.9% |
| Northwest | 6,358 | 5,533 | 9,670 | -34.3% | 14.9% |
| Portland | 2,722 | 2,339 | 4,109 | -33.8% | 16.4% |
| Rhode Island | 1,985 | 1,143 | 2,966 | -33.1% | 73.7% |
| South Carolina | 11,578 | 11,278 | 22,676 | -48.9% | 2.7% |
| Total1 | 101,726 | 89,970 | 181,782 | -44.0% | 13.1% |
| 1excluding Denver (included in Colorado) | |||||
July 14th COVID-19, New Cases, Hospitalizations, Vaccinations
by Calculated Risk on 7/14/2021 04:11:00 PM
According to the CDC, on Vaccinations.
Total doses administered: 335,487,779, as of a week ago 331,651,464. Average doses last week: 0.55 million per day.
| COVID Metrics | ||||
|---|---|---|---|---|
| Today | Yesterday | Week Ago | Goal | |
| Percent over 18, One Dose | 67.8% | 67.7% | 67.2% | ≥70.0%1,2 |
| Fully Vaccinated✅ (millions) | 160.1 | 159.7 | 157.9 | ≥1601 |
| New Cases per Day3🚩 | 24,141 | 21,379 | 14,554 | ≤5,0002 |
| Hospitalized3🚩 | 15,069 | 14,308 | 12,419 | ≤3,0002 |
| Deaths per Day3🚩 | 206 | 176 | 161 | ≤502 |
| 1 America's Short Term Goals, 2my goals to stop daily posts, 37 day average for Cases, Hospitalized, and Deaths 🚩 Increasing 7 day average week-over-week for Cases, Hospitalized, and Deaths ✅ Goal met (even if late). | ||||
KUDOS to the residents of the 20 states and D.C. that have already achieved the 70% goal (percent over 18 with at least one dose): Vermont, Hawaii, Massachusetts and Connecticut are at 80%+, and Maine, New Mexico, New Jersey, Rhode Island, Pennsylvania, California, Maryland, Washington, New Hampshire, New York, Illinois, Virginia, Delaware, Minnesota, Oregon, Colorado and D.C. are all over 70%.
Next up are Utah at 66.2%, Wisconsin at 66.1%, Florida at 65.9%, Nebraska at 65.9%, South Dakota at 64.8%, and Iowa at 64.4%.
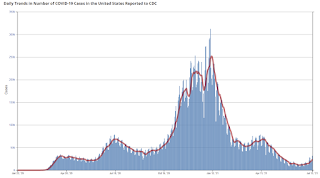
 Click on graph for larger image.
This graph shows the daily (columns) and 7 day average (line) of positive tests reported.
This data is from the CDC.
Houston Real Estate in June: Sales Up 17% YoY, Inventory Down 31% YoY
by Calculated Risk on 7/14/2021 03:07:00 PM
I'm tracking sales and inventory for many local markets.
From the HAR: Houston’s Real Estate Buying Blitz Persists in June
Houston real estate held to record territory in June with buyers continuing to seize upon historically low interest rates as they purchased homes from among a limited supply. Despite the strong buying activity, the pace was slightly slower in the year-over-year comparison.Single family inventory declined 31.3% year-over-year from 35,281 in June 2020 to 24,225 in June 2021. This is just 1.5 months of supply compared to 3.0 months in June 2020.
According to the latest Houston Association of Realtors (HAR) Market Update, single-family homes sales were up 13.6 percent compared to last June, with 10,638 units sold versus 9,362 a year earlier. That becomes the market’s thirteenth consecutive positive month of sales. On a year-to-date basis, home sales remain 25.9 percent ahead of 2020’s record pace.
Once again, homes priced from $750,000 and above dominated in sales volume with a 136.5 percent year-over-year increase. That was followed by the $500,000 to $750,000 segment, which soared 87.0 percent. The surge in high-dollar homebuying again pushed pricing to record-setting levels. The single-family home average price rose 23.7 percent to $395,316 and the median price increased 20.0 percent to $314,500.
Sales of all property types totaled 13,090 – the greatest volume of all time. That is up 16.9 percent from June 2020. Total dollar volume for the month climbed 43.8 percent to a record-setting $4.8 billion.
“The Houston housing market is in overdrive right now, and we know anecdotally that out-of-town investors have contributed to the frenzy,” said HAR Chairman Richard Miranda with Keller Williams Platinum. “We saw similar investment activity following Hurricane Harvey, and within a few months, the market stabilized. We expect stability to return this time around, so anyone in the market for a home who is frustrated by current market conditions needs to be patient.”
emphasis added
Note that inventory was up 7.2% compared to the previous month.
Maryland Real Estate in June: Sales Up 24% YoY, Inventory Down 45% YoY
by Calculated Risk on 7/14/2021 02:30:00 PM
Note: I'm tracking data for many local markets around the U.S. I think it is especially important to watch inventory this year.
From the Maryland Realtors for the entire state:
Closed sales in June 2021 were 10,790, up 24.2% from 8,686 in June 2020.
Active Listings in June 2021 were 8,550, down 45.0% from 15,558 in June 2020.
Inventory in June was up 14.2% from last month, and up 38% from the all time low in March 2021.
Months of Supply was 1.0 Months in June 2021, compared to 2.2 Months in June 2020.
Rhode Island Real Estate in June: Sales Up 31% YoY, Inventory Down 33% YoY
by Calculated Risk on 7/14/2021 11:51:00 AM
Note: I'm tracking data for many local markets around the U.S. I think it is especially important to watch inventory this year.
For for the entire state of Rhode Island:
Closed sales (single family and condos) in June 2021 were 1,473, up 31.2% from 1,123 in June 2020.
Active Listings (single family and condos) in June 2021 were 1,985, down 33.1% from 2,966 in June 2020.
Inventory in June was up 74% from last month.
Fed Chair Powell: Semiannual Monetary Policy Report to the Congress
by Calculated Risk on 7/14/2021 10:22:00 AM
This testimony will be live here at 12PM ET.
From Fed Chair Powell: Semiannual Monetary Policy Report to the Congress. An excerpt on inflation:
Inflation has increased notably and will likely remain elevated in coming months before moderating. Inflation is being temporarily boosted by base effects, as the sharp pandemic-related price declines from last spring drop out of the 12-month calculation. In addition, strong demand in sectors where production bottlenecks or other supply constraints have limited production has led to especially rapid price increases for some goods and services, which should partially reverse as the effects of the bottlenecks unwind. Prices for services that were hard hit by the pandemic have also jumped in recent months as demand for these services has surged with the reopening of the economy.
First Look at 2022 Cost-Of-Living Adjustments and Maximum Contribution Base
by Calculated Risk on 7/14/2021 10:12:00 AM
The BLS reported yesterday morning:
The Consumer Price Index for Urban Wage Earners and Clerical Workers (CPI-W) increased 6.1 percent over the last 12 months to an index level of 266.412 (1982-84=100). For the month, the index rose 1.1 percent prior to seasonal adjustment.CPI-W is the index that is used to calculate the Cost-Of-Living Adjustments (COLA). The calculation dates have changed over time (see Cost-of-Living Adjustments), but the current calculation uses the average CPI-W for the three months in Q3 (July, August, September) and compares to the average for the highest previous average of Q3 months. Note: this is not the headline CPI-U, and is not seasonally adjusted (NSA).
• In 2020, the Q3 average of CPI-W was 253.412.
The 2020 Q3 average was the highest Q3 average, so we only have to compare Q3 this year to last year.
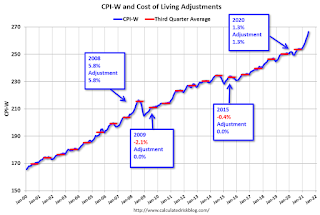
 Click on graph for larger image.
This graph shows CPI-W since January 2000. The red lines are the Q3 average of CPI-W for each year.
Note: The year labeled for the calculation, and the adjustment is effective for December of that year (received by beneficiaries in January of the following year).
CPI-W was up 6.1% year-over-year in June, and although this is very early - we need the data for July, August and September - my current guess is COLA will probably be around 5.5% this year, the largest increase since 5.8% in 2008 - and it is possible this will be the largest increase since 1982 (7.4%).
Contribution and Benefit Base
The contribution base will be adjusted using the National Average Wage Index. This is based on a one year lag. The National Average Wage Index is not available for 2020 yet, but wages probably increased again in 2020. If wages increased the same as in 2019, then the contribution base next year will increase to around $148,200 in 2022, from the current $142,800.
Remember - this is an early look. What matters is average CPI-W, NSA, for all three months in Q3 (July, August and September).


