by Calculated Risk on 6/16/2021 10:22:00 AM
Wednesday, June 16, 2021
Comments on May Housing Starts
Earlier: Housing Starts increased to 1.572 Million Annual Rate in May
The housing starts report showed total starts were up 3.6% in May compared to the previous month, and total starts were up 50.3% year-over-year compared to May 2020.
The first graph shows the month to month comparison for total starts between 2020 (blue) and 2021 (red).
 Click on graph for larger image.
Starts were up 50.3% in May compared to May 2020. The year-over-year comparison will be easy again in June, but will be more difficult starting in July.
2020 was off to a strong start before the pandemic, and with low interest rates, and little competing existing home inventory, starts finished 2020 strong.
These graphs use a 12 month rolling total for NSA starts and completions.
 The blue line is for multifamily starts and the red line is for multifamily completions.
 The rolling 12 month total for starts (blue line) increased steadily for several years following the great recession - then mostly moved sideways. Completions (red line) had lagged behind - then completions caught up with starts- then starts picked up a little again late last year, but have fallen off with the pandemic.
 The last graph shows single family starts and completions. It usually only takes about 6 months between starting a single family home and completion - so the lines are much closer. The blue line is for single family starts and the red line is for single family completions.
Single family starts are getting back to more normal levels, but I still expect some further increases in single family starts and completions on a rolling 12 month basis - especially given the low level of existing home inventory.
Housing Starts increased to 1.572 Million Annual Rate in May
by Calculated Risk on 6/16/2021 08:37:00 AM
From the Census Bureau: Permits, Starts and Completions
Housing Starts:
Privately‐owned housing starts in May were at a seasonally adjusted annual rate of 1,572,000. This is 3.6 percent above the revised April estimate of 1,517,000 and is 50.3 percent above the May 2020 rate of 1,046,000. Single‐family housing starts in May were at a rate of 1,098,000; this is 4.2 percent above the revised April figure of 1,054,000. The May rate for units in buildings with five units or more was 465,000.
Building Permits:
Privately‐owned housing units authorized by building permits in May were at a seasonally adjusted annual rate of 1,681,000. This is 3.0 percent below the revised April rate of 1,733,000, but is 34.9 percent above the May 2020 rate of 1,246,000. Single‐family authorizations in May were at a rate of 1,130,000; this is 1.6 percent below the revised April figure of 1,148,000. Authorizations of units in buildings with five units or more were at a rate of 494,000 in May.
emphasis added
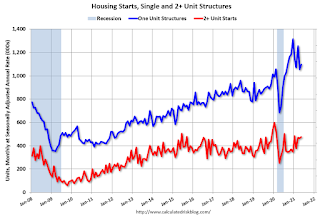 Click on graph for larger image.
The first graph shows single and multi-family housing starts for the last several years.
Multi-family starts (red, 2+ units) increased slightly in May compared to April. Multi-family starts were up 50% year-over-year in May.
Single-family starts (blue) increased in May, and were up 51% year-over-year (starts slumped at the beginning of the pandemic).
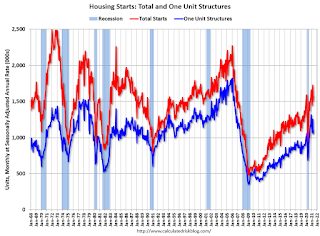 The second graph shows total and single unit starts since 1968.
 The second graph shows the huge collapse following the housing bubble, and then the eventual recovery (but still not historically high).
Total housing starts in May were below expectations, and starts in March and April were revised down.
I'll have more later …
MBA: Mortgage Applications Increase in Latest Weekly Survey
by Calculated Risk on 6/16/2021 07:00:00 AM
From the MBA: Mortgage Applications Increase in Latest MBA Weekly Survey
Mortgage applications increased 4.2 percent from one week earlier, according to data from the Mortgage Bankers Association’s (MBA) Weekly Mortgage Applications Survey for the week ending June 11, 2021. The previous week’s results included an adjustment for the Memorial Day holiday.
... The Refinance Index increased 6 percent from the previous week and was 22 percent lower than the same week one year ago. The seasonally adjusted Purchase Index increased 2 percent from one week earlier. The unadjusted Purchase Index increased 11 percent compared with the previous week and was 17 percent lower than the same week one year ago.
“Mortgage applications bounced back after three weeks of declines, increasing over 4 percent last week. Both purchase and refinance applications were up, including a 5.5 percent gain in refinances. The jump in refinances was the result of the 30-year fixed rate falling for the third straight week to 3.11 percent – the lowest since early May. U.S. Treasury yields have slid because of the uncertainty in the financial markets regarding inflation and how the Federal Reserve may act over the next few months,” said Joel Kan, MBA’s Associate Vice President of Economic and Industry Forecasting. “Purchase activity also rebounded, even as supply constraints continue to slow the housing market. An almost 5 percent increase in government purchase applications drove most of last week’s gain while also tempering the recent growth in loan sizes. Purchase applications were still down 17 percent from a year ago, which was when the mortgage market started seeing large post-shutdown increases in activity.”
...
The average contract interest rate for 30-year fixed-rate mortgages with conforming loan balances ($548,250 or less) decreased to 3.11 percent from 3.15 percent, with points increasing to 0.36 from 0.34 (including the origination fee) for 80 percent loan-to-value ratio (LTV) loans.
emphasis added
 Click on graph for larger image.
The first graph shows the refinance index since 1990.
With low rates, the index remains elevated, and picked up this week as rates declined.
The second graph shows the MBA mortgage purchase index
 According to the MBA, purchase activity is down 17% year-over-year unadjusted.
Note: The year ago comparisons for the unadjusted purchase index are now more difficult since purchase activity picked up in late May 2020.
Note: Red is a four-week average (blue is weekly).
Tuesday, June 15, 2021
Wednesday: Housing Starts, FOMC Statement
by Calculated Risk on 6/15/2021 08:48:00 PM
Wednesday:
• At 7:00 AM ET, The Mortgage Bankers Association (MBA) will release the results for the mortgage purchase applications index.
• At 8:30 AM, Housing Starts for May. The consensus is for 1.630 million SAAR, up from 1.569 million SAAR in April.
• At 2:00 PM, FOMC Meeting Announcement. No change to policy is expected at this meeting.
• At 2:00 PM, FOMC Forecasts This will include the Federal Open Market Committee (FOMC) participants' projections of the appropriate target federal funds rate along with the quarterly economic projections.
• At 2:30 PM, Fed Chair Jerome Powell holds a press briefing following the FOMC announcement.
Second Home Market: South Lake Tahoe in May
by Calculated Risk on 6/15/2021 03:59:00 PM
Three months ago, from Jann Swanson at MortgageNewsDaily: Fannie Warns Lenders on Investment Properties and 2nd Homes. This action will result in higher interest rates on 2nd home and investment property mortgages.
I'm looking at data for some second home markets - and will track those markets to see if there is an impact from the lending changes.
This graph is for South Lake Tahoe since 2004 through May 2021, and shows inventory (blue), and the year-over-year (YoY) change in the median price (12 month average).
Note: The median price is distorted by the mix, but this is the available data.
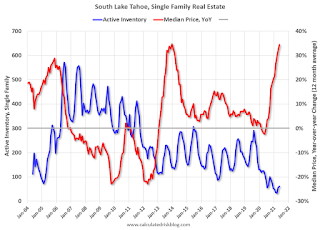
Following the housing bubble, prices declined for several years in South Lake Tahoe, with the median price falling about 50% from the bubble peak.
Note that inventory was high while prices were declining - and significantly lower inventory in 2012 suggested the bust was over. (Tracking inventory helped me call the bottom for housing way back in February 2012, see:The Housing Bottom is Here)
Currently inventory is just above the record low set two months ago, and prices are up sharply YoY. This will be interesting to watch.
June 15th COVID-19 New Cases, Vaccinations, Hospitalizations
by Calculated Risk on 6/15/2021 03:42:00 PM
This data is from the CDC.
According to the CDC, on Vaccinations.
Total doses administered: 311,886,674, as of yesterday 310,645,827. Daily: 1.24 million.
| COVID Metrics | |||
|---|---|---|---|
| Current | Yesterday | Goal | |
| Percent over 18, One Dose | 64.6% | 64.5% | ≥70.0%1,2 |
| Fully Vaccinated (millions) | 145.8 | 144.9 | ≥1601 |
| New Cases per Day3 | 12,415 | 12,676 | ≤5,0002 |
| Hospitalized3 | 14,232 | 13,944 | ≤3,0002 |
| Deaths per Day3 | 292 | 325 | ≤502 |
| 1 America's Goal by July 4th, 2my goals to stop daily posts, 37 day average for Cases, Hospitalized, and Deaths | |||
KUDOS to the residents of the 14 states and D.C. that have already achieved the 70% goal: Vermont, Hawaii and Massachusetts are at 80%+, and Connecticut, New Jersey, Maine, Rhode Island, Pennsylvania, New Mexico, California, New Hampshire, Maryland, Washington, New York and D.C. are all over 70%.
Next up are Illinois at 69.7%, Virginia at 69.3%, Minnesota at 68.7%, Delaware at 68.4%, Colorado at 68.0%, Oregon at 68.0% and Wisconsin at 64.2%.
 Click on graph for larger image.
This graph shows the daily (columns) and 7 day average (line) of positive tests reported.
This data is from the CDC.
LA Area Port Traffic: Record Imports in May
by Calculated Risk on 6/15/2021 02:26:00 PM
Note: The expansion to the Panama Canal was completed in 2016 (As I noted a few years ago), and some of the traffic that used the ports of Los Angeles and Long Beach is probably going through the canal. This might be impacting TEUs on the West Coast.
Container traffic gives us an idea about the volume of goods being exported and imported - and usually some hints about the trade report since LA area ports handle about 40% of the nation's container port traffic.
The following graphs are for inbound and outbound traffic at the ports of Los Angeles and Long Beach in TEUs (TEUs: 20-foot equivalent units or 20-foot-long cargo container).
To remove the strong seasonal component for inbound traffic, the first graph shows the rolling 12 month average.
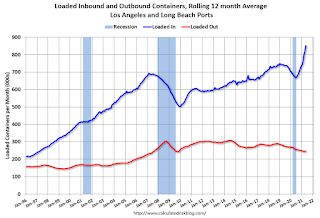
On a rolling 12 month basis, inbound traffic was up 3.7% in May compared to the rolling 12 months ending in April. Outbound traffic was up 0.2% compared to the rolling 12 months ending the previous month.
The 2nd graph is the monthly data (with a strong seasonal pattern for imports).
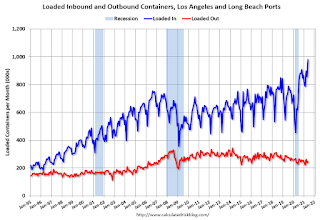
Imports were up 58% YoY in May (collapsed last year due to pandemic), and exports were up 2.6% YoY.
NAHB: Builder Confidence Declined to 81 in May
by Calculated Risk on 6/15/2021 10:09:00 AM
The National Association of Home Builders (NAHB) reported the housing market index (HMI) was at 81, down from 83 in April. Any number above 50 indicates that more builders view sales conditions as good than poor.
From the NAHB: Rising Material Challenges, Declining Builder Sentiment
Rising material prices and supply chain shortages resulted in builder confidence dipping to its lowest level since August 2020. The latest National Association of Home Builders (NAHB)/Wells Fargo Housing Market Index (HMI) released today shows that builder confidence in the market for newly built single-family homes fell two points to 81 in June. Despite the monthly decline, the reading above 80 is still a signal of strong demand in a housing market lacking inventory.
“Higher costs and declining availability for softwood lumber and other building materials pushed down builder sentiment in June,” said NAHB Chairman Chuck Fowke. “These higher costs have moved some new homes beyond the budget of prospective buyers, which has slowed the strong pace of home building. Policymakers need to focus on supply-chain issues in order to allow the economic recovery to continue.”
“While builders have adopted a variety of business strategies including price escalation clauses to deal with scarce building materials, labor and lots, unavoidable increases for new home prices are pushing some buyers to the sidelines,” said NAHB Chief Economist Robert Dietz. “Moreover, these supply-constraints are resulting in insufficient appraisals and making it more difficult for builders to access construction loans.”
...
All three of the major HMI indices posted declines in June: current sales conditions fell two points to 86; sales expectations in the next six months posted a two-point decline to 79; and traffic of prospective buyers dropped two points to 71.
Looking at the three-month moving averages for regional HMI scores: the South rose one point to 85; the West fell one point to 89; the Midwest dropped three points to 72; and the Northeast posted a five-point decline to 78.
 Click on graph for larger image.
This graph show the NAHB index since Jan 1985.
This was below the consensus forecast, but still a very strong reading - and lumber prices have fallen sharply recently.
Industrial Production Increased 0.8 Percent in May
by Calculated Risk on 6/15/2021 09:32:00 AM
From the Fed: Industrial Production and Capacity Utilization
Total industrial production increased 0.8 percent in May. Manufacturing production advanced 0.9 percent, reflecting, in part, a large gain in motor vehicle assemblies; factory output excluding motor vehicles and parts increased 0.5 percent. The indexes for mining and utilities rose 1.2 percent and 0.2 percent, respectively.
In May, at 99.9 percent of its 2017 average, total industrial production was 16.3 percent higher than it was a year earlier but 1.4 percent lower than its pre-pandemic (February 2020) level. Capacity utilization for the industrial sector rose 0.6 percentage point in May to 75.2 percent, a rate that is 4.4 percentage points below its long-run (1972–2020) average.
emphasis added
 Click on graph for larger image.
This graph shows Capacity Utilization. This series is up from the record low set in April, but still below the level in February 2020.
Capacity utilization at 75.2% is 4.4% below the average from 1972 to 2020.
Note: y-axis doesn't start at zero to better show the change.
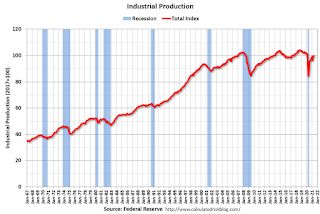 The second graph shows industrial production since 1967.
Industrial production increased in May to 106.3. This is 1.4% below the February 2020 level.
The change in industrial production was below consensus expectations.
Retail Sales Decreased 1.3% in May
by Calculated Risk on 6/15/2021 08:44:00 AM
On a monthly basis, retail sales were decreased 1.3% from April to May (seasonally adjusted), and sales were up 28.1 percent from May 2020.
From the Census Bureau report:
Advance estimates of U.S. retail and food services sales for May 2021, adjusted for seasonal variation and holiday and trading-day differences, but not for price changes, were $620.2 billion, a decrease of 1.3% from the previous month, but 28.1 percent above May 2020. ... The March 2021 to April 2021 percent change was revised from virtually unchanged to up 0.9 percent.
emphasis added
 Click on graph for larger image.
This graph shows retail sales since 1992. This is monthly retail sales and food service, seasonally adjusted (total and ex-gasoline).
Retail sales ex-gasoline were down 1.5% in May.
The second graph shows the year-over-year change in retail sales and food service (ex-gasoline) since 1993.
 Retail and Food service sales, ex-gasoline, increased by 26.1% on a YoY basis.
Sales in May were below expectations, however sales in March and April were revised up.


