 RSS Feed
 by Calculated Risk on 5/13/2021 05:27:00 PM
Thursday, May 13, 2021
May 13th COVID-19 New Cases, Hospitalizations
"If you’ve been fully vaccinated: You can resume activities that you did prior to the pandemic. You can resume activities without wearing a mask or staying 6 feet apart, except where required by federal, state, local, tribal, or territorial laws, rules, and regulations, including local business and workplace guidance."Get vaccinated!
According to the CDC, on Vaccinations. Total administered: 266,596,486, as of yesterday: 264,680,844. Day: 1.92 million. (U.S. Capacity is around 4 million per day)
1) 58.9% of the population over 18 has had at least one dose (70% goal by July 4th).
2) 119.0 million Americans are fully vaccinated (160 million goal by July 4th)
Note: I'll stop posting this daily once all three of these criteria are met:
1) 70% of the population over 18 has had at least one dose of vaccine, and
2) new cases are under 5,000 per day, and
3) hospitalizations are below 3,000.
And check out COVID Act Now to see how each state is doing.
Over 7,000 US deaths were reported so far in May due to COVID.
 Click on graph for larger image.
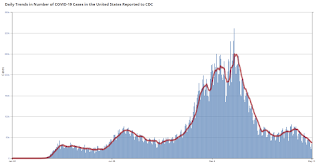
This graph shows the daily (columns) 7 day average (line) of positive tests reported.
This data is from the CDC.
 Click on graph for larger image.
This graph shows the daily (columns) 7 day average (line) of positive tests reported.
This data is from the CDC.
The 7-day average is 35,442, down from 36,853 yesterday, and down sharply from the recent peak of 69,881 on April 13, 2021. This is the lowest since September 13, 2020, but still above the post-summer surge low of 34,668.
The second graph shows the number of people hospitalized.
 This data is also from the CDC.
The CDC cautions that due to reporting delays, the area in grey will probably increase.
The current 7-day average is 30,244, down from 30,718 reported yesterday, but still above the post-summer surge low of 23,000.
Existing Home Inventory Might Have Bottomed
by Calculated Risk on 5/13/2021 04:04:00 PM
I'm gathering existing home data for many local markets, and I'm watching inventory very closely this year.
As I noted in Some thoughts on Housing Inventory
The key for housing in 2021 will be inventory. If inventory stays extremely low, there will be more housing starts and a larger increase in house prices. However, if inventory increases significantly, there will be fewer starts and less price appreciation.The table below shows some early data for April.
Although inventory in these areas is down about 56% year-over-year, inventory is up month-to-month in most areas, and up 3.1% in total compared to March.
It is still early, but existing home inventory might have bottomed in March.
| Existing Home Inventory | |||||
|---|---|---|---|---|---|
| Apr-21 | Mar-21 | Apr-20 | YoY | MoM | |
| Atlanta | 6,964 | 7,418 | 19,697 | -64.6% | -6.1% |
| Boston | 3,788 | 3,201 | 3,467 | 9.3% | 18.3% |
| Colorado | 7,872 | 6,732 | 23,106 | -65.9% | 16.9% |
| Denver | 2,594 | 1,921 | 6,855 | -62.2% | 35.0% |
| Houston | 22,794 | 22,602 | 39,906 | -42.9% | 0.8% |
| Las Vegas | 2,346 | 2,369 | 7,815 | -70.0% | -1.0% |
| Maryland | 7,167 | 6,202 | 18,563 | -61.4% | 15.6% |
| New Hampshire | 1,852 | 1,576 | 4,295 | -56.9% | 17.5% |
| North Texas | 8,084 | 8,123 | 23,046 | -64.9% | -0.5% |
| Portland | 2,222 | 1,943 | 4,757 | -53.3% | 14.4% |
| Sacramento | 1,006 | 918 | 1,823 | -44.8% | 9.6% |
| South Carolina | 12,019 | 12,754 | 27,024 | -55.5% | -5.8% |
| Total1 | 76,114 | 73,838 | 173,499 | -56.1% | 3.1% |
| 1excluding Denver (included in Colorado) | |||||
Sacramento Real Estate in April: Sales up 52% YoY, Active Inventory down 45% YoY
by Calculated Risk on 5/13/2021 01:03:00 PM
Note: I'm tracking data for many local markets around the U.S. I think it is especially important to watch inventory this year. Remember sales were weak in April 2020 due to the pandemic, so the YoY sales comparison is easy.
From SacRealtor.org: County median sales price nears $490,000, sales volume up 19%
April ended with 1,540 sales, up 19.2% from the 1,292 sales in March. Compared to one year ago (1,013), the current figure is up 52%.
...
The Active Listing Inventory increased 9.6% from March to April, from 918 units to 1,006 units. Compared with April 2020 (1,823), inventory is down 44.8%. The Months of Inventory remained at .7 Months.
...
The Median DOM (days on market) remained at 6 and the Average DOM decreased from 13 to 11. “Days on market” represents the days between the initial listing of the home as “active” and the day it goes “pending.” Of the 1,540 sales this month, 93.4% (1,439) were on the market for 30 days or less and 97.2% (1,498) were on the market for 60 days or less.
emphasis added
 Click on graph for larger image.
This graph from the Sacramento Association of REALTORS® shows single family sales and inventory since March 2018. Usually inventory (red) was higher than sales (blue), but now there are more sales each month than inventory. Inventory declined sharply during the pandemic.
Note that inventory in April was up 9.6% from last month.
Hotels: Occupancy Rate Down 17% Compared to Same Week in 2019
by Calculated Risk on 5/13/2021 10:51:00 AM
Note: The year-over-year occupancy comparisons are easy, since occupancy declined sharply at the onset of the pandemic. However, occupancy is still down significantly from normal levels.
The occupancy rate is down 17% compared to the same week in 2019.
Due to more supply in the marketplace, U.S. hotel occupancy fell slightly from the previous week, according to STR's latest data through May 8.The following graph shows the seasonal pattern for the hotel occupancy rate using the four week average.
May 2-8, 2021:
• Occupancy: 56.7%
• Average daily rate (ADR): US$110.19
• Revenue per available room (RevPAR): US$62.50
Demand was up week over week, but an increase in supply from both reopenings and new properties pulled national occupancy down. Major markets, such as New York City and San Francisco, are showing the most movement with properties coming back online.
emphasis added
 Click on graph for larger image.
The red line is for 2021, black is 2020, blue is the median, and dashed light blue is for 2009 (the worst year on record for hotels prior to 2020).
Occupancy is now slightly above the horrible 2009 levels.
Note: Y-axis doesn't start at zero to better show the seasonal change.
Note: Y-axis doesn't start at zero to better show the seasonal change.
Maryland Real Estate in April: Sales Up 27% YoY, Inventory Down 61% YoY
by Calculated Risk on 5/13/2021 10:21:00 AM
Note: I'm tracking data for many local markets around the U.S. I think it is especially important to watch inventory this year. Remember sales were weak in April 2020 due to the pandemic, so the YoY sales comparison is easy.
From the Maryland Realtors for the entire state:
Closed sales in April 2021 were 8,566, up 27.1% from 6,739 in April 2020.
Active Listings in April 2021 were 7,167, down 61.4% from 18,563 in April 2020.
Inventory in April was up 15.6% from last month.
Months of Supply was 0.8 Months in April 2021, compared to 2.5 Months in April 2020.
Weekly Initial Unemployment Claims decrease to 473,000
by Calculated Risk on 5/13/2021 08:38:00 AM
The DOL reported:
In the week ending May 8, the advance figure for seasonally adjusted initial claims was 473,000, a decrease of 34,000 from the previous week's revised level. This is the lowest level for initial claims since March 14, 2020 when it was 256,000. The previous week's level was revised up by 9,000 from 498,000 to 507,000. The 4-week moving average was 534,000, a decrease of 28,250 from the previous week's revised average. This is the lowest level for this average since March 14, 2020 when it was 225,500. The previous week's average was revised up by 2,250 from 560,000 to 562,250.This does not include the 103,571 initial claims for Pandemic Unemployment Assistance (PUA) that was up from 101,815 the previous week.
emphasis added
The following graph shows the 4-week moving average of weekly claims since 1971.
 Click on graph for larger image.
The dashed line on the graph is the current 4-week average. The four-week average of weekly unemployment claims decreased to 534,000.
The previous week was revised up.
Regular state continued claims decreased to 3,655,000 (SA) from 3,700,000 (SA) the previous week.
Note: There are an additional 7,283,703 receiving Pandemic Unemployment Assistance (PUA) that increased from 6,863,451 the previous week (there are questions about these numbers). This is a special program for business owners, self-employed, independent contractors or gig workers not receiving other unemployment insurance. And an additional 5,265,193 receiving Pandemic Emergency Unemployment Compensation (PEUC) up from 4,973,804.
Weekly claims were close to the consensus forecast.
Wednesday, May 12, 2021
Thursday: Unemployment Claims, PPI
by Calculated Risk on 5/12/2021 09:02:00 PM
Thursday:
• At 8:30 AM ET, The initial weekly unemployment claims report will be released. The consensus is for a decrease to 480 thousand from 498 thousand last week.
• Also at 8:30 AM, The Producer Price Index for April from the BLS. The consensus is for a 0.3% increase in PPI, and a 0.4% increase in core PPI.
May 12th COVID-19 New Cases, Hospitalizations; Vaccinations at 40% of Capacity
by Calculated Risk on 5/12/2021 04:00:00 PM
According to the CDC, on Vaccinations. Total administered: 264,680,844, as of yesterday: 263,132,561. Day: 1.55 million. (U.S. Capacity is around 4 million per day)
1) 58.7% of the population over 18 has had at least one dose (70% goal by July 4th).
2) 116.4 million Americans are fully vaccinated (160 million goal)
Note: I'll stop posting this daily once all three of these criteria are met:
1) 70% of the population over 18 has had at least one dose of vaccine, and
2) new cases are under 5,000 per day, and
3) hospitalizations are below 3,000.
And check out COVID Act Now to see how each state is doing.
Almost 6,500 US deaths were reported so far in May due to COVID.
 Click on graph for larger image.
This graph shows the daily (columns) 7 day average (line) of positive tests reported.
Note: The ups and downs during the Winter surge were related to reporting delays due to the Thanksgiving and Christmas holidays.
This data is from the CDC.
 Click on graph for larger image.
This graph shows the daily (columns) 7 day average (line) of positive tests reported.
Note: The ups and downs during the Winter surge were related to reporting delays due to the Thanksgiving and Christmas holidays.
This data is from the CDC.
The 7-day average is 36,832, down from 38,265 yesterday, and down sharply from the recent peak of 69,881 on April 13, 2021. This is the lowest since September 14, 2020, but still above the post-summer surge low of 34,668.
The second graph shows the number of people hospitalized.
 This data is also from the CDC.
The CDC cautions that due to reporting delays, the area in grey will probably increase.
The current 7-day average is 30,718, down from 31,210 reported yesterday, but still above the post-summer surge low of 23,000.
Colorado Real Estate in April: Sales Up 41% YoY, Inventory Down 66% YoY
by Calculated Risk on 5/12/2021 02:29:00 PM
Note: Remember sales were weak in April 2020 due to the pandemic, so the YoY comparison is easy. I'm tracking data for many local markets around the U.S. I think it is especially important to watch inventory this year.
From the Colorado Association of REALTORS® for the entire state:
Closed sales for Single Family and Townhouse-Condo in April 2021 were 11,022, up 40.5% from 7,843 in April 2020.
Active Listings for Single Family and Townhouse-Condo in April 2021 were 7,872, down 65.9% from 23,106 in April 2020.
Inventory in April was up 16.9% from last month.
Months of Supply was 0.7 Months in April 2021, compared to 2.4 Months in April 2020.
Houston Real Estate in April: Sales Up 58% YoY, Inventory Down 43% YoY
by Calculated Risk on 5/12/2021 02:06:00 PM
From the HAR: Houston Real Estate Tears Through April at a Record Pace
Low interest rates inspired consumers to snap up high-end homes in April at a pace never before seen, sending prices to new highs while keeping home inventory at historic lows. It must be noted that, as in March, some figures contained in this latest housing report are distorted because they compare to the same month last year when real estate was just beginning its recovery from coronavirus-related lockdown orders that halted most of the business.Inventory declined 42.9% year-over-year from 39,906 in April 2020 to 22,794 in April 2021. This is just 1.4 months of supply.
According to the latest Houston Association of Realtors (HAR) Market Update, single-family homes sales were up 47.4 percent compared to last April with 9,105 units sold versus 6,175 a year earlier. That represents the biggest one-month year-over-year sales volume increase of all time and is the market’s eleventh consecutive positive month of sales. On a year-to-date basis, home sales are 24.4 percent ahead of 2020’s record pace.
Homes priced from $750,000 and above led the charge in sales volume in April with a staggering 164.3 percent year-over-year surge. That was followed by the $500,000 to $750,000 segment, which soared 132.2 percent. With high-end homebuying overshadowing the marketplace, pricing climbed to new record levels. The single-family home average price rose 20.0 percent to $371,854 and the median price increased 17.6 percent to $295,000.
Sales of all property types totaled 11,348. That is up 58.3 percent from April 2020. Total dollar volume for the month rocketed 85.9 percent to just under $4 billion.
emphasis added
Note that inventory was up less than 1% in April compared to the previous month (March 2021).


