 RSS Feed
 by Calculated Risk on 5/13/2021 08:38:00 AM
Thursday, May 13, 2021
Weekly Initial Unemployment Claims decrease to 473,000
The DOL reported:
In the week ending May 8, the advance figure for seasonally adjusted initial claims was 473,000, a decrease of 34,000 from the previous week's revised level. This is the lowest level for initial claims since March 14, 2020 when it was 256,000. The previous week's level was revised up by 9,000 from 498,000 to 507,000. The 4-week moving average was 534,000, a decrease of 28,250 from the previous week's revised average. This is the lowest level for this average since March 14, 2020 when it was 225,500. The previous week's average was revised up by 2,250 from 560,000 to 562,250.This does not include the 103,571 initial claims for Pandemic Unemployment Assistance (PUA) that was up from 101,815 the previous week.
emphasis added
The following graph shows the 4-week moving average of weekly claims since 1971.
 Click on graph for larger image.
The dashed line on the graph is the current 4-week average. The four-week average of weekly unemployment claims decreased to 534,000.
The previous week was revised up.
Regular state continued claims decreased to 3,655,000 (SA) from 3,700,000 (SA) the previous week.
Note: There are an additional 7,283,703 receiving Pandemic Unemployment Assistance (PUA) that increased from 6,863,451 the previous week (there are questions about these numbers). This is a special program for business owners, self-employed, independent contractors or gig workers not receiving other unemployment insurance. And an additional 5,265,193 receiving Pandemic Emergency Unemployment Compensation (PEUC) up from 4,973,804.
Weekly claims were close to the consensus forecast.
Wednesday, May 12, 2021
Thursday: Unemployment Claims, PPI
by Calculated Risk on 5/12/2021 09:02:00 PM
Thursday:
• At 8:30 AM ET, The initial weekly unemployment claims report will be released. The consensus is for a decrease to 480 thousand from 498 thousand last week.
• Also at 8:30 AM, The Producer Price Index for April from the BLS. The consensus is for a 0.3% increase in PPI, and a 0.4% increase in core PPI.
May 12th COVID-19 New Cases, Hospitalizations; Vaccinations at 40% of Capacity
by Calculated Risk on 5/12/2021 04:00:00 PM
According to the CDC, on Vaccinations. Total administered: 264,680,844, as of yesterday: 263,132,561. Day: 1.55 million. (U.S. Capacity is around 4 million per day)
1) 58.7% of the population over 18 has had at least one dose (70% goal by July 4th).
2) 116.4 million Americans are fully vaccinated (160 million goal)
Note: I'll stop posting this daily once all three of these criteria are met:
1) 70% of the population over 18 has had at least one dose of vaccine, and
2) new cases are under 5,000 per day, and
3) hospitalizations are below 3,000.
And check out COVID Act Now to see how each state is doing.
Almost 6,500 US deaths were reported so far in May due to COVID.
 Click on graph for larger image.
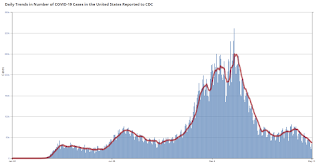
This graph shows the daily (columns) 7 day average (line) of positive tests reported.
Note: The ups and downs during the Winter surge were related to reporting delays due to the Thanksgiving and Christmas holidays.
This data is from the CDC.
 Click on graph for larger image.
This graph shows the daily (columns) 7 day average (line) of positive tests reported.
Note: The ups and downs during the Winter surge were related to reporting delays due to the Thanksgiving and Christmas holidays.
This data is from the CDC.
The 7-day average is 36,832, down from 38,265 yesterday, and down sharply from the recent peak of 69,881 on April 13, 2021. This is the lowest since September 14, 2020, but still above the post-summer surge low of 34,668.
The second graph shows the number of people hospitalized.
 This data is also from the CDC.
The CDC cautions that due to reporting delays, the area in grey will probably increase.
The current 7-day average is 30,718, down from 31,210 reported yesterday, but still above the post-summer surge low of 23,000.
Colorado Real Estate in April: Sales Up 41% YoY, Inventory Down 66% YoY
by Calculated Risk on 5/12/2021 02:29:00 PM
Note: Remember sales were weak in April 2020 due to the pandemic, so the YoY comparison is easy. I'm tracking data for many local markets around the U.S. I think it is especially important to watch inventory this year.
From the Colorado Association of REALTORS® for the entire state:
Closed sales for Single Family and Townhouse-Condo in April 2021 were 11,022, up 40.5% from 7,843 in April 2020.
Active Listings for Single Family and Townhouse-Condo in April 2021 were 7,872, down 65.9% from 23,106 in April 2020.
Inventory in April was up 16.9% from last month.
Months of Supply was 0.7 Months in April 2021, compared to 2.4 Months in April 2020.
Houston Real Estate in April: Sales Up 58% YoY, Inventory Down 43% YoY
by Calculated Risk on 5/12/2021 02:06:00 PM
From the HAR: Houston Real Estate Tears Through April at a Record Pace
Low interest rates inspired consumers to snap up high-end homes in April at a pace never before seen, sending prices to new highs while keeping home inventory at historic lows. It must be noted that, as in March, some figures contained in this latest housing report are distorted because they compare to the same month last year when real estate was just beginning its recovery from coronavirus-related lockdown orders that halted most of the business.Inventory declined 42.9% year-over-year from 39,906 in April 2020 to 22,794 in April 2021. This is just 1.4 months of supply.
According to the latest Houston Association of Realtors (HAR) Market Update, single-family homes sales were up 47.4 percent compared to last April with 9,105 units sold versus 6,175 a year earlier. That represents the biggest one-month year-over-year sales volume increase of all time and is the market’s eleventh consecutive positive month of sales. On a year-to-date basis, home sales are 24.4 percent ahead of 2020’s record pace.
Homes priced from $750,000 and above led the charge in sales volume in April with a staggering 164.3 percent year-over-year surge. That was followed by the $500,000 to $750,000 segment, which soared 132.2 percent. With high-end homebuying overshadowing the marketplace, pricing climbed to new record levels. The single-family home average price rose 20.0 percent to $371,854 and the median price increased 17.6 percent to $295,000.
Sales of all property types totaled 11,348. That is up 58.3 percent from April 2020. Total dollar volume for the month rocketed 85.9 percent to just under $4 billion.
emphasis added
Note that inventory was up less than 1% in April compared to the previous month (March 2021).
NY Fed Q1 Report: Total Household Debt Increased in Q1 2021, Mortgage Origination Credit Scores Edged Up
by Calculated Risk on 5/12/2021 11:37:00 AM
The Federal Reserve Bank of New York's Center for Microeconomic Data today issued its Quarterly Report on Household Debt and Credit. The report shows that total household debt increased by $85 billion (0.6%) to $14.64 trillion in the first quarter of 2021. The total debt balance is now $344 billion higher than the year prior. While mortgage, auto loan, and student loan balances have continued to increase, credit card balances have substantially decreased. The Report is based on data from the New York Fed's Consumer Credit Panel, a nationally representative random sample of individual- and household-level debt and credit records drawn from anonymized Equifax credit data.
Mortgage balances—the largest component of household debt—rose by $117 billion in the first quarter of 2021 and stood at $10.16 trillion at the end of March. Credit card balances declined by $49 billion in the first quarter, a substantial drop and the second largest quarterly decline in card balances in the history of the data (since 1999). Credit card balances are $157 billion lower than they had been at the end of 2019, consistent with both paydowns among borrowers and constrained consumption opportunities.
...
New extensions of credit were strong in 2021Q1 in both mortgages and auto loans. Mortgage originations, which include mortgage refinances, reached $1.1 trillion, only slightly below the record high seen in 2020Q4. Auto loan originations, which includes both loans and leases, edged down slightly but remain high at $153 billion. Only 15% of the $153 billion of newly originated auto loans were originated to borrowers with credit scores below 620, the lowest share seen in the history of the data..
emphasis added
 Click on graph for larger image.
Here are two graphs from the report:
The first graph shows aggregate consumer debt increased in Q1. Household debt previously peaked in 2008, and bottomed in Q3 2013. Unlike following the great recession, there wasn't a huge decline in debt during the pandemic.
From the NY Fed:
Aggregate household debt balances increased by $85 billion in the first quarter of 2021, a 0.6% rise from 2020Q4, and now stand at $14.64 trillion. Balances are $499 billion higher than at the end of 2019.
 The second graph shows the percent of debt in delinquency.
The overall delinquency rate decreased in Q1. From the NY Fed:
Aggregate delinquency rates have continued to decline since the beginning of the pandemic recession, reflecting an uptake in forbearances (provided by both the CARES Act and voluntarily offered by lenders), which protect borrowers’ credit records from the reporting of skipped or deferred payments. As of late March, 3.1% of outstanding debt was in some stage of delinquency, a 0.1 percentage point decrease from the fourth quarter, and 1.5 percentage points lower than the rate observed in the first quarter of 2020, just as the Covid pandemic hit the United States. Of the $448 billion of debt that is delinquent, $343 billion is seriously delinquent (at least 90 days late or “severely derogatory”, which includes some debts that have been removed from lenders’ books but upon which they continue to attempt collection).
 The third graph shows Mortgage Originations by Credit Score.
From the NY Fed:
Median mortgage origination credit scores edged up, with the median credit score of newly originated mortgages at 788, reflecting both a high share of refinances and tightening of underwriting standards. The median credit score on newly originated auto loans also rose, up to 720, reflecting declining subprime shares of overall originations. Only 15% of the $153 billion of newly originated auto loans were originated to borrowers with credit scores below 620, the lowest share seen in the history of our data.There is much more in the report.
Cleveland Fed: Key Measures Show Inflation Increased in April
by Calculated Risk on 5/12/2021 11:17:00 AM
The Cleveland Fed released the median CPI and the trimmed-mean CPI this morning:
According to the Federal Reserve Bank of Cleveland, the median Consumer Price Index rose 0.2% April. The 16% trimmed-mean Consumer Price Index rose 0.4% in April. "The median CPI and 16% trimmed-mean CPI are measures of core inflation calculated by the Federal Reserve Bank of Cleveland based on data released in the Bureau of Labor Statistics’ (BLS) monthly CPI report".
Note: The Cleveland Fed released the median CPI details for April here. Car and truck rental was up 505% annualized! Used cars and trucks were up 215% annualized.
 Click on graph for larger image.
This graph shows the year-over-year change for these four key measures of inflation. On a year-over-year basis, the median CPI rose 2.1%, the trimmed-mean CPI rose 2.4%, and the CPI less food and energy rose 3.0%. Core PCE is for March and increased 1.8% year-over-year.
Note: We saw negative Month-to-month (MoM) core CPI and CPI readings in March, April and May 2020. We also saw negative MoM PCE and core PCE reading in March and April 2020. Although inflation picked up in April, the year-over-year change was impacted the base effect (decline last year).
South Carolina Real Estate in April: Sales Up 41% YoY, Inventory Down 56% YoY
by Calculated Risk on 5/12/2021 09:48:00 AM
Note: Remember sales were weak in April 2020 due to the pandemic, so the YoY comparison is easy. I'm tracking data for many local markets around the U.S. I think it is especially important to watch inventory this year.
From the South Carolina Realtors for the entire state:
Closed sales in April 2021 were 9,900, up 41.4% from 7,000 in April 2020.
Active Listings in April 2021 were 12,019, down 55.5% from 27,024 in April 2020.
Inventory in April was down less than 1% from last month.
Months of Supply was 1.3 Months in April 2021, compared to 3.4 Months in April 2020.
BLS: CPI increased 0.8% in April, Core CPI increased 0.9%
by Calculated Risk on 5/12/2021 08:32:00 AM
The Consumer Price Index for All Urban Consumers (CPI-U) increased 0.8 percent in April on a seasonally adjusted basis after rising 0.6 percent in March, the U.S. Bureau of Labor Statistics reported today. Over the last 12 months, the all items index increased 4.2 percent before seasonal adjustment. This is the largest 12-month increase since a 4.9-percent increase for the period ending September 2008.CPI and core CPI were well above expectations. I'll post a graph later today after the Cleveland Fed releases the median and trimmed-mean CPI.
...
The index for all items less food and energy rose 0.9 percent in April, its largest monthly increase since April 1982. Nearly all major component indexes increased in April. Along with the index for used cars and trucks, the indexes for shelter, airline fares, recreation, motor vehicle insurance, and household furnishings and operations were among the indexes with a large impact on the overall increase.
The all items index rose 4.2 percent for the 12 months ending April, a larger increase than the 2.6- percent increase for the period ending March. Similarly, the index for all items less food and energy rose 3.0 percent over the last 12 months, a larger increase than the 1.6-percent rise over the 12 month period ending in March. The energy index rose 25.1 percent over the last 12-months, and the food index increased 2.4 percent.
emphasis added
MBA: Mortgage Applications Increase in Latest Weekly Survey
by Calculated Risk on 5/12/2021 07:00:00 AM
From the MBA: Mortgage Applications Increase in Latest MBA Weekly Survey
Mortgage applications increased 2.1 percent from one week earlier, according to data from the Mortgage Bankers Association’s (MBA) Weekly Mortgage Applications Survey for the week ending May 7, 2021.
... The Refinance Index increased 3 percent from the previous week and was 12 percent lower than the same week one year ago. The seasonally adjusted Purchase Index increased 1 percent from one week earlier. The unadjusted Purchase Index increased 1 percent compared with the previous week and was 13 percent higher than the same week one year ago.
“Mortgage rates fell last week to the lowest levels since February, tracking the dip in Treasury yields. The decline in rates helped the refinance index reach its highest level in eight weeks, driven by a 4 percent increase in conventional refinances. Additionally, refinance loan balances increased for the fourth straight week, an indication that higher-balance borrowers acted to take quick advantage of lower rates,” said Joel Kan, MBA’s Associate Vice President of Economic and Industry Forecasting. “The first week of May was also strong for the purchase market. Applications were up 13 percent from a year ago, which was around the time the housing market awakened from the pandemic-induced stall in activity. Most markets this spring continue to see robust demand, but activity continues to be constrained by insufficient inventory levels, as well as homebuilder challenges related to the ongoing shortages and price increases for building materials.”
...
The average contract interest rate for 30-year fixed-rate mortgages with conforming loan balances ($548,250 or less) decreased to 3.11 percent from 3.18 percent, with points decreasing to 0.32 from 0.34 (including the origination fee) for 80 percent loan-to-value ratio (LTV) loans.
emphasis added
 Click on graph for larger image.
The first graph shows the refinance index since 1990.
With low rates, the index remains elevated, but below recent levels since mortgage rates have moved up from the record lows.
The second graph shows the MBA mortgage purchase index
 According to the MBA, purchase activity is up 13% year-over-year unadjusted.
Note: The unadjusted MBA purchase index will be up year-over-year for another week or so, since purchase activity collapsed in the early weeks of the pandemic - but then the comparisons will be more difficult.
Note: Red is a four-week average (blue is weekly).


