 RSS Feed
 by Calculated Risk on 5/09/2021 07:45:00 PM
Sunday, May 09, 2021
Sunday Night Futures
Weekend:
• Schedule for Week of May 9, 2021
• Second Home Market: South Lake Tahoe in April
• North Texas Real Estate in April: Sales Up 33% YoY, Inventory Down 65% YoY
Monday:
• No major economic releases scheduled.
From CNBC: Pre-Market Data and Bloomberg futures S&P 500 are up 4, and DOW futures are up 34 (fair value).
Oil prices were up over the last week with WTI futures at $65.41 per barrel and Brent at $68.88 per barrel. A year ago, WTI was at $24, and Brent was at $25 - so WTI oil prices are UP sharply year-over-year (oil prices collapsed at the beginning of the pandemic).
Here is a graph from Gasbuddy.com for nationwide gasoline prices. Nationally prices are at $2.95 per gallon. A year ago prices were at $1.83 per gallon, so gasoline prices are up $1.12 per gallon year-over-year.
May 9th COVID-19 Vaccinations, New Cases, Hospitalizations
by Calculated Risk on 5/09/2021 03:50:00 PM
President Biden has set two vaccinations goals to achieve by July 4th:
1) 70% of the population over 18 has had at least one dose of vaccine, and
2) 160 million Americans fully vaccinated.
According to the CDC, on Vaccinations. Total administered: 259,716,989. Yesterday: 257,347,205. Daily: 2.37 million.
1) 58.0% of the population over 18 has had at least one dose.
2) 113.2 million Americans are fully vaccinated.
Note: I'll stop posting this daily once all three of these criteria are met:
1) 70% of the population over 18 has had at least one dose of vaccine, and
2) new cases are under 5,000 per day, and
3) hospitalizations are below 3,000.
And check out COVID Act Now to see how each state is doing.
Over 4,500 US deaths were reported so far in May due to COVID.
 Click on graph for larger image.
This graph shows the daily (columns) 7 day average (line) of positive tests reported.
Note: The ups and downs during the Winter surge were related to reporting delays due to the Thanksgiving and Christmas holidays.
This data is from the CDC.
 Click on graph for larger image.
This graph shows the daily (columns) 7 day average (line) of positive tests reported.
Note: The ups and downs during the Winter surge were related to reporting delays due to the Thanksgiving and Christmas holidays.
This data is from the CDC.
The 7-day average is 40,098, down from 42,446 yesterday, and down sharply from the recent peak of 69,881 on April 13, 2021. This is the lowest since September 18, 2020, but still above the post-summer surge low of 34,668.
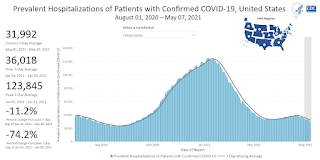
The second graph shows the number of people hospitalized.
 This data is also from the CDC.
The CDC cautions that due to reporting delays, the area in grey will probably increase.
The current 7-day average is 31,992, down from 32,887 reported yesterday, and well above the post-summer surge low of 23,000.
Second Home Market: South Lake Tahoe in April
by Calculated Risk on 5/09/2021 10:18:00 AM
Two months ago, from Jann Swanson at MortgageNewsDaily: Fannie Warns Lenders on Investment Properties and 2nd Homes. This action will result in higher interest rates on 2nd home and investment property mortgages.
I'm looking at data for some second home markets - and will track those markets to see if there is an impact from the lending changes.
This graph is for South Lake Tahoe since 2004 through April 2021, and shows inventory (blue), and the year-over-year change in the median price (12 month average).
Note: The median price is distorted by the mix, but this is the available data.
 Click on graph for larger image.
Following the housing bubble, prices declined for several years in South Lake Tahoe, with the median price falling about 50% from the bubble peak.
Note that inventory was high while prices were declining - and significantly lower inventory in 2012 suggested the bust was over. (Tracking inventory helped me call the bottom for housing way back in February 2012, see:The Housing Bottom is Here)
Currently inventory is just above the record low set last month, and prices are up sharply. This will be interesting to watch.
Saturday, May 08, 2021
North Texas Real Estate in April: Sales Up 33% YoY, Inventory Down 65% YoY
by Calculated Risk on 5/08/2021 08:13:00 PM
Note: Remember, sales were weak in April last year. I'm posting data for many local markets around the U.S. The story is the same everywhere ... inventory is very low.
From the NTREIS for North Texas (including Dallas/Ft. Worth):
Single Family Homes sold in April 2021 were 10,152, up 28.3% from 7,913 in April 2020.
Condos and Townhomes sold in April 2021 were 925, up 124.5% from 412 in April 2020.
Combined, sales were up 33.1% year-over-year.
Single Family Active Listings in April 2021 were 6,967, down 66.6% from 20,881 in April 2020.
Combined, sales were up 33.1% year-over-year.
Single Family Active Listings in April 2021 were 6,967, down 66.6% from 20,881 in April 2020.
For Condos and Townhomes, Active Listings in April 2021 were 1,117, down 48.4% from 2,165 in April 2020.
Combined, active listings declined 64.9% year-over-year.
Combined, active listings declined 64.9% year-over-year.
Although down sharply year-over-year, active inventory was up 12.9% compared to last month.
May 8th COVID-19 Vaccinations, New Cases, Hospitalizations; Lowest 7-Day Average Cases Since Sept 2020
by Calculated Risk on 5/08/2021 07:49:00 PM
President Biden has set two vaccinations goals to achieve by July 4th:
1) 70% of the population over 18 has had at least one dose of vaccine, and
2) 160 million Americans fully vaccinated.
According to the CDC, on Vaccinations. Total administered: 257,347,205.
1) 57.7% of the population over 18 has had at least one dose.
2) 111.6 million Americans are fully vaccinated.
Note: I'll stop posting this daily once all three of these criteria are met:
1) 70% of the population over 18 has had at least one dose of vaccine, and
2) new cases are under 5,000 per day, and
3) hospitalizations are below 3,000.
And check out COVID Act Now to see how each state is doing.
Over 4,500 US deaths were reported so far in May due to COVID.
 Click on graph for larger image.
This graph shows the daily (columns) 7 day average (line) of positive tests reported.
Note: The ups and downs during the Winter surge were related to reporting delays due to the Thanksgiving and Christmas holidays.
This data is from the CDC.
 Click on graph for larger image.
This graph shows the daily (columns) 7 day average (line) of positive tests reported.
Note: The ups and downs during the Winter surge were related to reporting delays due to the Thanksgiving and Christmas holidays.
This data is from the CDC.
The 7-day average is 42,432, down from 43,914 yesterday, and down sharply from the recent peak of 69,881 on April 13, 2021. This is the lowest since September 29, 2020, but still above the post-summer surge low of 34,668.
The second graph shows the number of people hospitalized.
 This data is also from the CDC.
The CDC cautions that due to reporting delays, the area in grey will probably increase.
The current 7-day average is 32,887, down from 33,265 reported yesterday, and well above the post-summer surge low of 23,000.
Schedule for Week of May 9, 2021
by Calculated Risk on 5/08/2021 08:11:00 AM
The key reports this week are April CPI and retail sales.
For manufacturing, the April Industrial Production report will be released on Friday.
No major economic releases scheduled.
6:00 AM ET: NFIB Small Business Optimism Index for April.
 10:00 AM: Job Openings and Labor Turnover Survey for March from the BLS.
 This graph shows job openings (yellow line), hires (purple), Layoff, Discharges and other (red column), and Quits (light blue column) from the JOLTS.
Jobs openings increased in February to 7.367 million from 7.099 million in January. This is close to the series maximum of 7.574 million.
The number of job openings (yellow) were up 5.1% year-over-year, and Quits were down 2.1% year-over-year.
7:00 AM ET: The Mortgage Bankers Association (MBA) will release the results for the mortgage purchase applications index.
8:30 AM: The Consumer Price Index for April from the BLS. The consensus is for 0.2% increase in CPI, and a 0.3% increase in core CPI.
11:00 AM: NY Fed: Q1 Quarterly Report on Household Debt and Credit
8:30 AM: The initial weekly unemployment claims report will be released. The consensus is for a decrease to 480 thousand from 498 thousand last week.
8:30 AM: The Producer Price Index for April from the BLS. The consensus is for a 0.3% increase in PPI, and a 0.4% increase in core PPI.
 8:30 AM ET: Retail sales for April is scheduled to be released. The consensus is for 1.0% increase in retail sales.
This graph shows retail sales since 1992. This is monthly retail sales and food service, seasonally adjusted (total and ex-gasoline).
Retail sales ex-gasoline were up 9.7% in March.
 9:15 AM: The Fed will release Industrial Production and Capacity Utilization for April.
This graph shows industrial production since 1967.
The consensus is for a 1.2% increase in Industrial Production, and for Capacity Utilization to increase to 75.2%.
10:00 AM: University of Michigan's Consumer sentiment index (Preliminary for May).
Friday, May 07, 2021
May 7th COVID-19 Vaccinations, New Cases, Hospitalizations
by Calculated Risk on 5/07/2021 05:20:00 PM
President Biden has set two vaccinations goals to achieve by July 4th:
1) 70% of the population over 18 has had at least one dose of vaccine, and
2) 160 million Americans fully vaccinated.
According to the CDC, on Vaccinations
1) 57.4% of the population over 18 has had at least one dose.
2) 109.9 million Americans are fully vaccinated.
Note: I'll stop posting this daily once all three of these criteria are met:
1) 70% of the population over 18 has had at least one dose of vaccine, and
2) new cases are under 5,000 per day, and
3) hospitalizations are below 3,000.
And check out COVID Act Now to see how each state is doing.
Almost 4,000 US deaths were reported so far in May due to COVID.
 Click on graph for larger image.
This graph shows the daily (columns) 7 day average (line) of positive tests reported.
Note: The ups and downs during the Winter surge were related to reporting delays due to the Thanksgiving and Christmas holidays.
This data is from the CDC.
 Click on graph for larger image.
This graph shows the daily (columns) 7 day average (line) of positive tests reported.
Note: The ups and downs during the Winter surge were related to reporting delays due to the Thanksgiving and Christmas holidays.
This data is from the CDC.
The 7-day average is 43,879, down from 46,083 yesterday, and down from the recent peak of 69,881 on April 13, 2021. This is the lowest since October 4, 2020, but still above the post-summer surge low of 34,668.
The second graph shows the number of people hospitalized.
 This data is also from the CDC.
The CDC cautions that due to reporting delays, the area in grey will probably increase.
The current 7-day average is 33,265, down from 33,808 reported yesterday, and well above the post-summer surge low of 23,000.
AAR: April Rail Carloads down 10.1%, Intermodal Up 10.4% Compared to 2019
by Calculated Risk on 5/07/2021 03:17:00 PM
From the Association of American Railroads (AAR) Rail Time Indicators. Graphs and excerpts reprinted with permission.
Numerous U.S. rail traffic categories have completely recovered the ground lost during the pandemic or are very close to doing so.
For example, April saw a new all-time record for U.S. intermodal shipments, driven by surging international trade and strong consumer spending. The weekly average for intermodal for April was 293,488 containers and trailers, breaking the record of 293,305 set in January 2021. ...
Meanwhile, U.S. carloads of grain, food, lumber, paper, scrap metal, and several other categories were higher in April 2021 than they were in both April 2020 and in April 2019. Carloads of chemicals and steel in April 2021 were much higher than April 2020 levels and just shy of April 2019 levels. In April 2021, 17 of the 20 carload categories the AAR tracks were higher than in April 2020; nine carload categories were higher than in April 2019.
emphasis added
 Click on graph for larger image.
This graph from the Rail Time Indicators report shows the six week average of U.S. Carloads in 2019, 2020 and 2021:
U.S. railroads originated 951,840 total carloads in April 2021, up 23.7%, or 182,060 carloads, over April 2020 and down 10.1% from April 2019. Total carloads averaged 237,960 per week in April 2021, the most since November 2019. For the first four months of 2021, total carloads were up 2.8% over last year.
 The second graph shows the six week average of U.S. intermodal in 2019, 2020 and 2021: (using intermodal or shipping containers):
U.S. railroads originated 1.17 million intermodal containers and trailers in April 2021, an average of 293.488 units per week. That’s up 33.8% over April 2020, up 10.4% over April 2019, and the biggest weekly average for intermodal for any month in history (breaking the record of 293,305 set in January 2021).
Black Knight: Number of Homeowners in COVID-19-Related Forbearance Plans Decreased
by Calculated Risk on 5/07/2021 01:07:00 PM
Note: Both Black Knight and the MBA (Mortgage Bankers Association) are putting out weekly estimates of mortgages in forbearance.
This data is as of May 4th.
From Black Knight: Forbearance Volumes Fall by More Than 100K
May continued the strong trend of early forbearance improvements seen each month – the first week of the month saw volumes fall by 105,000 (-4.5%). Declines were seen across the board, with GSE forbearance volumes falling by 39,000 (-5.3%), FHA/VA plan volumes improving by 44,000 (-4.7%) and PLS/portfolio forbearances declining by 22,000 (-3.4%) on the week.
As of May 4, just over 2.2 million (4.2% of) homeowners remain in COVID-19 related forbearance plans, including 2.5% of GSE, 7.4% of FHA/VA and 4.8% of portfolio/PLS loans.
Click on graph for larger image.
Some 73,000 plans are still listed with April 2021 expirations, suggesting opportunity may still remain in coming days for additional moderate improvements to be made. Another 350,000 plans are set to be reviewed for extension/removal in May. That number climbs to nearly 900,000 in June, the final quarterly review before early forbearance entrants begin to reach their 18-month plan expirations later this year.
emphasis added

MBA: "Mortgage Delinquencies Decrease in the First Quarter of 2021"
by Calculated Risk on 5/07/2021 11:13:00 AM
From the MBA: Mortgage Delinquencies Decrease in the First Quarter of 2021
The delinquency rate for mortgage loans on one-to-four-unit residential properties decreased to a seasonally adjusted rate of 6.38 percent of all loans outstanding at the end of the first quarter of 2021, according to the Mortgage Bankers Association's (MBA) National Delinquency Survey.
For the purposes of the survey, MBA asks servicers to report loans in forbearance as delinquent if the payment was not made based on the original terms of the mortgage. The delinquency rate was down 35 basis points from the fourth quarter of 2020, and up 202 basis points from one year ago.
"Mortgage delinquency rates continued to decrease in the first quarter of 2021, as a rebounding job market and stimulus checks helped borrowers stay current on their mortgage payments," said Marina Walsh, MBA's Vice President of Industry Analysis. "Mortgage delinquencies track closely to the U.S. unemployment rate, and with unemployment dropping from last year's spike, many households appear to be doing better."
...
Walsh noted that in the history of MBA's National Delinquency Survey, there has never been such a substantial decline in the delinquency rate over such a short period of time. The mortgage delinquency rate peaked at 8.22 percent in the second quarter of 2020 and within three quarters has dropped by 184 basis points to 6.38 percent. In addition, this quarter's earliest stage delinquencies - the 30-day and 60-day delinquencies combined - dropped to the lowest levels since the inception of the survey in 1979.
emphasis added
 Click on graph for larger image.
This graph shows the percent of loans delinquent by days past due. Overall delinquencies decreased in Q1.
The decrease was in 30 and 60 day buckets, and in foreclosure. 90 delinquencies increased slightly (mostly loans in forbearance).
From the MBA:
The percent of loans in the foreclosure process declined further, and was at the lowest level since 1982.
Compared to last quarter, the seasonally adjusted mortgage delinquency rate decreased for all loans outstanding. By stage, the 30-day delinquency rate decreased 32 basis points to 1.46 percent, the lowest rate since the survey began in 1979. The 60-day delinquency rate decreased 10 basis points to 0.67 percent, the lowest rate since the second quarter of 2000. The 90-day delinquency bucket increased 7 basis points to 4.25 percent.This sharp increase last year in the 90-day bucket was due to loans in forbearance (included as delinquent, but not reported to the credit bureaus).
The delinquency rate includes loans that are at least one payment past due but does not include loans in the process of foreclosure. The percentage of loans on which foreclosure actions were started in the first quarter rose by 1 basis point to 0.04 percent. The percentage of loans in the foreclosure process at the end of the first quarter was 0.54 percent, down 2 basis points from the fourth quarter of 2020 and 19 basis points from one year ago. This is the lowest foreclosure inventory rate since the first quarter of 1982.
The percent of loans in the foreclosure process declined further, and was at the lowest level since 1982.


