 RSS Feed
 by Calculated Risk on 5/06/2021 01:07:00 PM
Thursday, May 06, 2021
Hotels: Occupancy Rate Down 17% Compared to Same Week in 2019
Note: The year-over-year occupancy comparisons are easy, since occupancy declined sharply at the onset of the pandemic. However, occupancy is still down significantly from normal levels.
The occupancy rate is down 17% compared to the same week in 2019.
U.S. hotel occupancy remained relatively flat compared with the previous week, according to STR‘s latest data through May 1.The following graph shows the seasonal pattern for the hotel occupancy rate using the four week average.
April 25 through May 1, 2021:
• Occupancy: 57.1%
• Average daily rate (ADR): US$108.80
• Revenue per available room (RevPAR): US$62.13
While the overall weekly data was stagnant, weekend occupancy rose modestly and came in above 70% for the fourth straight week. However, the Top 25 Markets showed a lower occupancy level in aggregate with more properties reopening on top of lower demand.
emphasis added
 Click on graph for larger image.
The red line is for 2021, black is 2020, blue is the median, and dashed light blue is for 2009 (the worst year on record for hotels prior to 2020).
Occupancy is now slightly above the horrible 2009 levels.
Note: Y-axis doesn't start at zero to better show the seasonal change.
Note: Y-axis doesn't start at zero to better show the seasonal change.
April Employment Preview
by Calculated Risk on 5/06/2021 12:31:00 PM
On Friday at 8:30 AM ET, the BLS will release the employment report for April. The consensus is for 978 thousand jobs added, and for the unemployment rate to decrease to 5.7%.
Some analysts think this will be a very strong report with maybe 1.5 to 2.1 million jobs added.
 • First, currently there are still about 8.4 million fewer jobs than in February 2020 (before the pandemic).
This graph shows the job losses from the start of the employment recession, in percentage terms.
The current employment recession was by far the worst recession since WWII in percentage terms, and is now slightly better than the worst of the "Great Recession".
• ADP Report: The ADP employment report showed a gain of 742,000 private sector jobs, below the consensus estimate of 830,000 jobs added. The ADP report hasn't been very useful in predicting the BLS report, but this suggests the BLS report could be close to expectations.
• ISM Surveys: Note that the ISM services are diffusion indexes based on the number of firms hiring (not the number of hires). The ISM® manufacturing employment index decreased in April to 55.1%, down from 59.6% last month. This would suggest approximately 10,000 manufacturing jobs added in April. ADP showed 55,000 manufacturing jobs added.
The ISM® Services employment index increased in April to 58.8%, up from 57.7% last month. This would suggest over 300,000 service jobs added in April. ADP showed 636,000 service jobs added.
• Unemployment Claims: The weekly claims report showed a sharp decline in the number of initial unemployment claims during the reference week (include the 12th of the month) from 765,000 in March to 566,000 in April. This would usually suggest a pickup in hiring, although this might not be very useful right now. If we did a "Rip Van Winkle", and saw the weekly claims report this morning, we'd still think the economy was in a deep recession! In general, weekly claims have been lower than expectations.
• Weather: The SF Fed estimated that weather boosted employment by about 100 thousand in March, after reducing employment by 100 thousand in February. Weather is probably not a factor for April, but when we compare to March, we have to remember employment was boosted by weather last month.
 • Permanent Job Losers: Something to watch in the employment report will be "Permanent job losers". While there has been a strong bounce back in total employment, from the shutdown in March and April, permanent job losers had been flat over the last several months.
This graph shows permanent job losers as a percent of the pre-recession peak in employment through the December report.
This data is only available back to 1994, so there is only data for three recessions. n March, the number of permanent job losers decreased slightly to 3.432 million from 3.497 million in February.
• Conclusion: Most of the indicators suggest another strong report in April and many analysts are upgrading their forecasts to over 1 million jobs added. However, my guess is the report will be at or below the consensus.
Las Vegas Real Estate in April: Sales up 89% YoY, Inventory down 70% YoY
by Calculated Risk on 5/06/2021 10:12:00 AM
This report is for closed sales in April; sales are counted at the close of escrow, so the contracts for these homes were mostly signed in February and March.
The Las Vegas Realtors reported Another month, another record for Southern Nevada home prices; LVR housing statistics for April 2021
“These April statistics benefit from a comparison to the same month last year, when our housing market was hit hard by the beginning of this pandemic,” said 2021 LVR President Aldo Martinez. “It’s still striking to see how home prices here and nationwide continue to rise to record levels. April did signify the first month this year when single-family home sales did not exceed the previous month. ...”1) Overall sales (single family and condos) were up 88.8% year-over-year from 2,411 in April 2020 to 4,552 in April 2021.
LVR reported a total of 4,552 existing local homes, condos and townhomes sold during April. Compared to the same time last year, April sales were up 79.0% for homes and up 132.7% for condos and townhomes. So far this year, local home sales are on pace to exceed last year’s total.
…
By the end of April, LVR reported 1,827 single-family homes listed for sale without any sort of offer. Although down from the same period last year, Martinez said “it’s the second straight month where we ended up with more inventory without offers – 3.1% more. The same cannot be said for condos and townhomes. The 519 properties listed without offers in April represent a 13.1% decrease from the previous month and the fifth straight month this year where that inventory continues to decline. This just shows how consumers are adjusting their sights when it comes to affordable housing.”
...
Despite the pandemic, the number of so-called distressed sales remains near historically low levels. LVR reported that short sales and foreclosures combined accounted for just 0.9% of all existing local property sales in April. That compares to 1.5% of all sales one year ago, 3.0% of all sales two years ago, 2.5% three years ago and 8.4% four years ago. Martinez suggested that these percentages may rise slightly as some homeowners “may have difficulty coming out of forbearance programs – however nowhere near what we had seen in the last recession.”
emphasis added
2) Active inventory (single-family and condos) is down from a year ago, from a total of 7,815 in April 2020 to 2,346 in April 2021. Note: Total inventory was down 70.0% year-over-year. And months of inventory is extremely low.
3) Very low level of distressed sales.
Weekly Initial Unemployment Claims decrease to 498,000
by Calculated Risk on 5/06/2021 08:37:00 AM
The DOL reported:
In the week ending May 1, the advance figure for seasonally adjusted initial claims was 498,000, a decrease of 92,000 from the previous week's revised level. This is the lowest level for initial claims since March 14, 2020 when it was 256,000. The previous week's level was revised up by 37,000 from 553,000 to 590,000. The 4-week moving average was 560,000, a decrease of 61,000 from the previous week's revised average. This is the lowest level for this average since March 14, 2020 when it was 225,500. The previous week's average was revised up by 9,250 from 611,750 to 621,000.This does not include the 101,214 initial claims for Pandemic Unemployment Assistance (PUA) that was down from 121,414 the previous week.
emphasis added
The following graph shows the 4-week moving average of weekly claims since 1971.
 Click on graph for larger image.
The dashed line on the graph is the current 4-week average. The four-week average of weekly unemployment claims decreased to 560,000.
The previous week was revised up.
Regular state continued claims increased to 3,690,000 (SA) from 3,653,000 (SA) the previous week.
Note: There are an additional 6,862,705 receiving Pandemic Unemployment Assistance (PUA) that decreased from 6,974,909 the previous week (there are questions about these numbers). This is a special program for business owners, self-employed, independent contractors or gig workers not receiving other unemployment insurance. And an additional 4,972,507 receiving Pandemic Emergency Unemployment Compensation (PEUC) down from 5,194,099.
Weekly claims were lower than the consensus forecast.
Wednesday, May 05, 2021
Northwest Real Estate in April: Sales up 50% YoY, Inventory down 45% YoY
by Calculated Risk on 5/05/2021 08:15:00 PM
Note: Inventory is down sharply in the Northwest almost everywhere except Seattle. And inventory is low in Seattle too, but was even lower a year ago.
Remember - sales slumped in April 2020, so the year-over-year sales comparisons are crazy.
The Northwest Multiple Listing Service reported Brokers detect good news for home buyers, citing gains in listings and moderating prices
In King County, sales were up 64.1% year-over-year, and active inventory was down 32.0% year-over-year.
In Seattle, sales were up 85.3% year-over-year, and inventory was UP 3.0% year-over-year. (inventory in Seattle was extremely low last year). This puts the months-of-supply in Seattle at just 0.96 months.
The Northwest Multiple Listing Service reported Brokers detect good news for home buyers, citing gains in listings and moderating prices
Finally, some good news for home buyers! Sizeable increases in new listings compared to a year ago and reports of moderating prices "might mean we are seeing some relief for buyers," suggested John Deely, a board member at Northwest Multiple Listing Service.The press release is for the Northwest MLS area. There were 8,791 closed sales in April 2021, up 49.9% from 5,866 sales in April 2020. Active inventory for the Northwest is down 45.4%.
In commenting on the latest statistics from Northwest MLS summarizing April activity, Deely said the market remains hot while emphasizing active listing numbers do not always reflect actual overall activity. "With a market like ours, and the velocity of new listings moving to pending status, active listing data tend to get more attention," stated Deely, the vice president of operations at Coldwell Banker Bain.
April's month-end inventory of 5,616 listings was a year-over-year (YOY) drop of 45%; a year ago, there were 10,282 active listings in the MLS database.
emphasis added
In King County, sales were up 64.1% year-over-year, and active inventory was down 32.0% year-over-year.
In Seattle, sales were up 85.3% year-over-year, and inventory was UP 3.0% year-over-year. (inventory in Seattle was extremely low last year). This puts the months-of-supply in Seattle at just 0.96 months.
May 5th COVID-19 Vaccinations, New Cases, Hospitalizations
by Calculated Risk on 5/05/2021 04:54:00 PM
President Biden has set two vaccinations goals to achieve by July 4th:
1) 70% of the population over 18 has had at least one dose of vaccine, and
2) 160 million Americans fully vaccinated.
According to the CDC, on Vaccinations
1) 56.7% of the population over 18 has had at least one dose.
2) 106.5 million Americans are fully vaccinated.
Note: I'll stop posting this daily once all three of these criteria are met:
1) 70% of the population over 18 has had at least one dose of vaccine, and
2) new cases are under 5,000 per day, and
3) hospitalizations are below 3,000.
And check out COVID Act Now to see how each state is doing.
Over 2,000 US deaths were reported so far in May due to COVID.
 Click on graph for larger image.
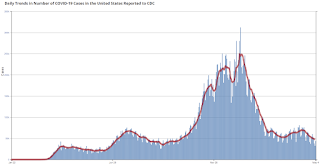
This graph shows the daily (columns) 7 day average (line) of positive tests reported.
Note: The ups and downs during the Winter surge were related to reporting delays due to the Thanksgiving and Christmas holidays.
This data is from the CDC.
 Click on graph for larger image.
This graph shows the daily (columns) 7 day average (line) of positive tests reported.
Note: The ups and downs during the Winter surge were related to reporting delays due to the Thanksgiving and Christmas holidays.
This data is from the CDC.
The 7-day average is 47,603, down from 48,585 yesterday, and down from the recent peak of 69,881 on April 13, 2021. This is the lowest since October 8, 2020, but well above the post-summer surge low of 34,668.
The second graph shows the number of people hospitalized.
 This data is also from the CDC.
The CDC cautions that due to reporting delays, the area in grey will probably increase.
The second graph shows the number of people hospitalized.
 This data is also from the CDC.
The CDC cautions that due to reporting delays, the area in grey will probably increase.
Denver Real Estate in April: Sales Up 29% YoY, Active Inventory Down 62%
by Calculated Risk on 5/05/2021 02:29:00 PM
Note: I'm tracking data for many local markets around the U.S. I think it is especially important to watch inventory this year.
From the DMAR: Monthly Indicators, April 2021
Total Residential Units Sold in April 2021 were 5,088, up 28.5% from 3,961 in April 2020.
Active Residential Listings in April 2021 were 2,594, up from 1,921 last month, and down 62.2% from 6,855 in April 2020.
Inventory in Denver had been fairly steady over the last 6 or 7 years, but declined sharply in 2020. There was a seasonal increase from March to April, but this is still the lowest level of inventory for April on record.
Interesting - In April, half the homes listed were sold (under contract) within four days!
U.S. Births decreased in 2020, "Lowest number of births since 1979"
by Calculated Risk on 5/05/2021 12:10:00 PM
Note: This is even lower than housing economist Tom Lawler's projection, see: Lawler: The Dismal Demographics of 2020. Demographics are still positive for housing, but nothing like the projections from a decade ago.
The Census projections were dropping all decade:
2014 Census projections for April 2020: 334.5 million
2017 projections: 332.6 million
Actual: 331.4 million
I'll have more on this as the 2020 Census data is released.
From the National Center for Health Statistics: Births: Provisional Data for 2020. The NCHS reports:
The provisional number of births for the United States in 2020 was 3,605,201, down 4% from the number in 2019 (3,747,540). This is the sixth consecutive year that the number of births has declined after an increase in 2014, down an average of 2% per year, and the lowest number of births since 1979.Here is a long term graph of annual U.S. births through 2020.
The provisional general fertility rate (GFR) for the United States in 2020 was 55.8 births per 1,000 women aged 15–44, down 4% from the rate in 2019 (58.3), another record low for the nation. From 2014 to 2020, the GFR declined by an average of 2% per year
…
The provisional birth rate for teenagers in 2020 was 15.3 births per 1,000 females aged 15–19, down 8% from 2019 (16.7), reaching another record low for this age group. The rate has declined by 63% since 2007 (41.5), the most recent period of continued decline, and 75% since 1991, the most recent peak.
 Click on graph for larger image.
Births have declined for six consecutive years following increases in 2013 and 2014.
Note the amazing decline in teenage births.
With fewer births, and less net migration, demographics are not be as favorable as once expected.
There is much more in the report.
ISM® Services Index decreased to 62.7% in April
by Calculated Risk on 5/05/2021 10:04:00 AM
(Posted with permission). The March ISM® Services index was at 62.7%, down from 63.7% last month. The employment index increased to 58.8%, from 57.7%. Note: Above 50 indicates expansion, below 50 contraction.
From the Institute for Supply Management: April 2021 Services ISM® Report On Business®
Economic activity in the services sector grew in April for the 11th month in a row, say the nation's purchasing and supply executives in the latest Services ISM® Report On Business.The employment index increased to 58.8% from 57.2% in March.
The report was issued today by Anthony Nieves, CPSM, C.P.M., A.P.P., CFPM, Chair of the Institute for Supply Management® (ISM®) Services Business Survey Committee: “The Services PMI® registered 62.7 percent, which is 1 percentage point lower than last month’s all-time high of 63.7 percent. The April reading indicates the 11th straight month of growth for the services sector, which has expanded for all but two of the last 135 months.
“The Supplier Deliveries Index registered 66.1 percent, up 5.1 percentage points from March’s reading of 61 percent. (Supplier Deliveries is the only ISM® Report On Business® index that is inversed; a reading of above 50 percent indicates slower deliveries, which is typical as the economy improves and customer demand increases.) The Prices Index figure of 76.8 percent is 2.8 percentage points higher than the March reading of 74 percent, indicating that prices increased in April, and at a faster rate. This is the index’s highest reading since it reached 77.4 percent in July 2008.
“According to the Services PMI®, 17 services industries reported growth. The composite index indicated growth for the 11th consecutive month after a two-month contraction in April and May 2020. There was slowing growth in the services sector in April; however, the rate of expansion is still strong. Respondents’ comments indicate that pent-up demand is continuing. Production-capacity constraints, material shortages, weather and challenges in logistics and human resources continue to affect deliveries, which has resulted in a reduction of inventories,” says Nieves.
emphasis added
ADP: Private Employment increased 742,000 in April
by Calculated Risk on 5/05/2021 08:22:00 AM
Private sector employment increased by 742,000 jobs from March to April according to the April ADP® National Employment ReportTM. Broadly distributed to the public each month, free of charge, the ADP National Employment Report is produced by the ADP Research Institute® in collaboration with Moody’s Analytics. The report, which is derived from ADP’s actual payroll data, measures the change in total nonfarm private employment each month on a seasonally-adjusted basisThis was below the consensus forecast of 830,000 for this report.
“The labor market continues an upward trend of acceleration and growth, posting the strongest reading since September 2020,” said Nela Richardson, chief economist, ADP. “Service providers have the most to gain as the economy reopens, recovers and resumes normal actvities and are leading job growth in April. While payrolls are still more than 8 million jobs short of pre-COVID-19 levels, job gains have totaled 1.3 million in the last two months after adding only about 1 million jobs over the course of the previous five months.
emphasis added
The BLS report will be released Friday, and the consensus is for 978 thousand non-farm payroll jobs added in April. The ADP report has not been very useful in predicting the BLS report.

In Memoriam: Doris "Tanta" Dungey


| Privacy Policy |
| Copyright © 2007 - 2023 CR4RE LLC |