 RSS Feed
 by Calculated Risk on 5/05/2021 02:29:00 PM
Wednesday, May 05, 2021
Denver Real Estate in April: Sales Up 29% YoY, Active Inventory Down 62%
Note: I'm tracking data for many local markets around the U.S. I think it is especially important to watch inventory this year.
From the DMAR: Monthly Indicators, April 2021
Total Residential Units Sold in April 2021 were 5,088, up 28.5% from 3,961 in April 2020.
Active Residential Listings in April 2021 were 2,594, up from 1,921 last month, and down 62.2% from 6,855 in April 2020.
Inventory in Denver had been fairly steady over the last 6 or 7 years, but declined sharply in 2020. There was a seasonal increase from March to April, but this is still the lowest level of inventory for April on record.
Interesting - In April, half the homes listed were sold (under contract) within four days!
U.S. Births decreased in 2020, "Lowest number of births since 1979"
by Calculated Risk on 5/05/2021 12:10:00 PM
Note: This is even lower than housing economist Tom Lawler's projection, see: Lawler: The Dismal Demographics of 2020. Demographics are still positive for housing, but nothing like the projections from a decade ago.
The Census projections were dropping all decade:
2014 Census projections for April 2020: 334.5 million
2017 projections: 332.6 million
Actual: 331.4 million
I'll have more on this as the 2020 Census data is released.
From the National Center for Health Statistics: Births: Provisional Data for 2020. The NCHS reports:
The provisional number of births for the United States in 2020 was 3,605,201, down 4% from the number in 2019 (3,747,540). This is the sixth consecutive year that the number of births has declined after an increase in 2014, down an average of 2% per year, and the lowest number of births since 1979.Here is a long term graph of annual U.S. births through 2020.
The provisional general fertility rate (GFR) for the United States in 2020 was 55.8 births per 1,000 women aged 15–44, down 4% from the rate in 2019 (58.3), another record low for the nation. From 2014 to 2020, the GFR declined by an average of 2% per year
…
The provisional birth rate for teenagers in 2020 was 15.3 births per 1,000 females aged 15–19, down 8% from 2019 (16.7), reaching another record low for this age group. The rate has declined by 63% since 2007 (41.5), the most recent period of continued decline, and 75% since 1991, the most recent peak.
 Click on graph for larger image.
Births have declined for six consecutive years following increases in 2013 and 2014.
Note the amazing decline in teenage births.
With fewer births, and less net migration, demographics are not be as favorable as once expected.
There is much more in the report.
ISM® Services Index decreased to 62.7% in April
by Calculated Risk on 5/05/2021 10:04:00 AM
(Posted with permission). The March ISM® Services index was at 62.7%, down from 63.7% last month. The employment index increased to 58.8%, from 57.7%. Note: Above 50 indicates expansion, below 50 contraction.
From the Institute for Supply Management: April 2021 Services ISM® Report On Business®
Economic activity in the services sector grew in April for the 11th month in a row, say the nation's purchasing and supply executives in the latest Services ISM® Report On Business.The employment index increased to 58.8% from 57.2% in March.
The report was issued today by Anthony Nieves, CPSM, C.P.M., A.P.P., CFPM, Chair of the Institute for Supply Management® (ISM®) Services Business Survey Committee: “The Services PMI® registered 62.7 percent, which is 1 percentage point lower than last month’s all-time high of 63.7 percent. The April reading indicates the 11th straight month of growth for the services sector, which has expanded for all but two of the last 135 months.
“The Supplier Deliveries Index registered 66.1 percent, up 5.1 percentage points from March’s reading of 61 percent. (Supplier Deliveries is the only ISM® Report On Business® index that is inversed; a reading of above 50 percent indicates slower deliveries, which is typical as the economy improves and customer demand increases.) The Prices Index figure of 76.8 percent is 2.8 percentage points higher than the March reading of 74 percent, indicating that prices increased in April, and at a faster rate. This is the index’s highest reading since it reached 77.4 percent in July 2008.
“According to the Services PMI®, 17 services industries reported growth. The composite index indicated growth for the 11th consecutive month after a two-month contraction in April and May 2020. There was slowing growth in the services sector in April; however, the rate of expansion is still strong. Respondents’ comments indicate that pent-up demand is continuing. Production-capacity constraints, material shortages, weather and challenges in logistics and human resources continue to affect deliveries, which has resulted in a reduction of inventories,” says Nieves.
emphasis added
ADP: Private Employment increased 742,000 in April
by Calculated Risk on 5/05/2021 08:22:00 AM
Private sector employment increased by 742,000 jobs from March to April according to the April ADP® National Employment ReportTM. Broadly distributed to the public each month, free of charge, the ADP National Employment Report is produced by the ADP Research Institute® in collaboration with Moody’s Analytics. The report, which is derived from ADP’s actual payroll data, measures the change in total nonfarm private employment each month on a seasonally-adjusted basisThis was below the consensus forecast of 830,000 for this report.
“The labor market continues an upward trend of acceleration and growth, posting the strongest reading since September 2020,” said Nela Richardson, chief economist, ADP. “Service providers have the most to gain as the economy reopens, recovers and resumes normal actvities and are leading job growth in April. While payrolls are still more than 8 million jobs short of pre-COVID-19 levels, job gains have totaled 1.3 million in the last two months after adding only about 1 million jobs over the course of the previous five months.
emphasis added
The BLS report will be released Friday, and the consensus is for 978 thousand non-farm payroll jobs added in April. The ADP report has not been very useful in predicting the BLS report.
MBA: Mortgage Applications Decrease in Latest Weekly Survey
by Calculated Risk on 5/05/2021 07:00:00 AM
From the MBA: Mortgage Applications Decrease in Latest MBA Weekly Survey
Mortgage applications decreased 0.9 percent from one week earlier, according to data from the Mortgage Bankers Association’s (MBA) Weekly Mortgage Applications Survey for the week ending April 30, 2021.
... The Refinance Index increased 0.1 percent from the previous week and was 17 percent lower than the same week one year ago. The seasonally adjusted Purchase Index decreased 3 percent from one week earlier. The unadjusted Purchase Index decreased 2 percent compared with the previous week and was 24 percent higher than the same week one year ago.
“There was a mixed bag of action in the mortgage market last week. Mortgage rates were slightly higher, refinance applications were essentially unchanged, and purchase applications fell for the second straight week,” said Joel Kan, MBA’s Associate Vice President of Economic and Industry Forecasting. “Both conventional and government purchase applications declined, but average loan sizes increased for each loan type. This is a sign that the competitive purchase market, driven by low housing inventory and high demand, is pushing prices higher and weighing down on activity. The higher prices are also affecting the mix of activity, with stronger growth in purchase loans with larger-than-average balances.”
Added Kan, “An increase in conventional refinances was offset by a decline in government refinances. The 30-year fixed rate was up slightly to 3.18 percent, which is still 22 basis points lower than a year ago, but higher than it was between mid-2020 and February 2021.”
...
The average contract interest rate for 30-year fixed-rate mortgages with conforming loan balances ($548,250 or less) increased to 3.18 percent from 3.17 percent, with points increasing to 0.34 from 0.30 (including the origination fee) for 80 percent loan-to-value ratio (LTV) loans.
emphasis added
 Click on graph for larger image.
The first graph shows the refinance index since 1990.
With low rates, the index remains elevated, but below recent levels since mortgage rates have moved up from the record lows.
The second graph shows the MBA mortgage purchase index
 According to the MBA, purchase activity is up 24% year-over-year unadjusted.
Note: The unadjusted MBA purchase index will be up sharply year-over-year for another week or two, since purchase activity collapsed in the early weeks of the pandemic.
Note: Red is a four-week average (blue is weekly).
Tuesday, May 04, 2021
Wednesday: ADP Employment, ISM Services Index
by Calculated Risk on 5/04/2021 08:58:00 PM
Wednesday:
• At 7:00 AM ET, The Mortgage Bankers Association (MBA) will release the results for the mortgage purchase applications index.
• At 8:15 AM, The ADP Employment Report for April. This report is for private payrolls only (no government). The consensus is for 830,000 payroll jobs added in April, up from 517,000 added in March.
• At 10:00 AM, the ISM Services Index for April. The consensus is for a reading of 64.3, up from 63.7.
May 4th COVID-19 Vaccinations, New Cases, Hospitalizations
by Calculated Risk on 5/04/2021 06:10:00 PM
President Biden has set two vaccinations goals to achieve by July 4th:
1) 70% of the population over 18 has had at least one dose of vaccine, and
2) 160 million Americans fully vaccinated.
According to the CDC, on Vaccinations
1) 56.4% of the population over 18 has had at least one dose.
2) 106.2 million Americans are fully vaccinated.
Note: I'll stop once all three of these criteria are met:
1) 70% of the population over 18 has had at least one dose of vaccine, and
2) new cases are under 5,000 per day, and
3) hospitalizations are below 3,000.
And check out COVID Act Now to see how each state is doing.
Over 1,500 US deaths were reported so far in May due to COVID.
 Click on graph for larger image.
This graph shows the daily (columns) 7 day average (line) of positive tests reported.
Note: The ups and downs during the Winter surge were related to reporting delays due to the Thanksgiving and Christmas holidays.
This data is from the CDC.
 Click on graph for larger image.
This graph shows the daily (columns) 7 day average (line) of positive tests reported.
Note: The ups and downs during the Winter surge were related to reporting delays due to the Thanksgiving and Christmas holidays.
This data is from the CDC.
The 7-day average is 48,493, down from 49,192 yesterday, and down from the recent peak of 69,881 on April 13, 2021. This is the lowest since October 9, 2020, but well above the post-summer surge low of 34,668.
The second graph shows the number of people hospitalized.
 This data is also from the CDC.
The CDC cautions that due to reporting delays, the area in grey will probably increase.
The second graph shows the number of people hospitalized.
 This data is also from the CDC.
The CDC cautions that due to reporting delays, the area in grey will probably increase.
The current 7-day average is 34,287, up from 34,012 reported yesterday, and well above the post-summer surge low of 23,000.
U.S. Heavy Truck Sales up Sharply Year-over-year in April
by Calculated Risk on 5/04/2021 02:46:00 PM
The following graph shows heavy truck sales since 1967 using data from the BEA. The dashed line is the April 2021 seasonally adjusted annual sales rate (SAAR).
Heavy truck sales really collapsed during the great recession, falling to a low of 180 thousand SAAR in May 2009. Then heavy truck sales increased to a new all time high of 575 thousand SAAR in September 2019.
However heavy truck sales started declining in late 2019 due to lower oil prices.
Note: "Heavy trucks - trucks more than 14,000 pounds gross vehicle weight."

Click on graph for larger image.
Heavy truck sales really declined towards the end of March 2020 due to COVID-19 and the collapse in oil prices, falling to a low of 299 thousand SAAR in May 2020, but have since rebounded.
Heavy truck sales were at 499 thousand SAAR in April, down from 517 thousand SAAR in March, but up 46% from 390 thousand SAAR in March 2020.
The year-over-year comparison are easy for the next few months because of the collapse in sales in the early months of the pandemic.
Black Knight Mortgage Monitor for March
by Calculated Risk on 5/04/2021 10:45:00 AM
Black Knight released their Mortgage Monitor report for March yesterday. According to Black Knight, 5.02% of mortgages were delinquent in March, down from 6.00% of mortgages in February, and up from 3.39% in March 2020. Black Knight also reported that 0.30% of mortgages were in the foreclosure process, down from 0.42% a year ago.
This gives a total of 5.44% delinquent or in foreclosure.
Press Release: Inflow of New Mortgage Delinquencies Drops to Record Low in March; April Payment Data Suggests Further Improvement Likely
Today, the Data & Analytics division of Black Knight, Inc. released its latest Mortgage Monitor Report, based upon the company’s industry-leading mortgage, real estate and public records datasets. In light of March’s 16.4% decline in delinquencies – as reported in Black Knight’s First Look at the month’s data – this month’s report drills deeper into what that may mean for the market. According to Black Knight Data & Analytics President Ben Graboske, both the company’s full-month data for March and its unique McDash Flash daily performance tracking data for April suggest strengthening economic trends are now manifesting in the mortgage market.
Not only did March see the largest single-month improvement in delinquencies in 11 years, but all indications suggest more is yet to come,” said Graboske. “Several factors contributed to particularly strong mortgage performance in March, including the distribution of 159 million stimulus payments totaling more than $376 billion, broader economic improvement leading to nearly a million new jobs and 1.2 million forbearance plans reviewed for extension or removal, resulting in an 11% decline in plan volumes in the last 30 days. As many early forbearance plan adopters shifted to post-forbearance waterfalls to get back to performing on their mortgage payments, inflow has continued to steadily improve as well. And, of the 7.1 million homeowners who have been in COVID-19 forbearance at one point or another, performance among those who have left plans has generally been strong.
“Some other key metrics also point to a robust recovery under way. Despite mortgage delinquencies tending to trend seasonally upward starting in April, our McDash Flash daily performance dataset instead shows strong early payment activity for the month. Through April 23, 91.6% of mortgage holders had made their monthly payments, up from 91% in March and the largest share for any month since the onset of the pandemic. That said, while overall sentiment for an economic recovery in 2021 remains robust, mortgage performance is expected to run into seasonal headwinds for most of the remainder of the year, which could marginally dampen overall improvement rates. Black Knight will continue to monitor the situation as we move forward.”
emphasis added
 Click on graph for larger image.
Here is a graph from the Mortgage Monitor that shows Credit Scores of rate locks.
From Black Knight:
Interesting trends are being seen among credit scores of both purchase and refinance rate locks in recent months
• After seeing credit scores among both purchases and refinances hit all-time highs in 2020, credits scores specifically among refinances have begun to wain early this year
• This type of behavior is typical in a rising rate environment as high credit score borrowers tend to be the first to jump in and refinance when rates fall and the first to exit the market as rates begin to rise
• The average credit score among rate/term refinances is down 13 points year to date, while the average among cash out refis is down a more modest 8 points
• At the same time, credit quality among purchase loans continues to remain strong with the average credit score of purchase locks up 3 points through March 2021 from 2020's already record highs
 And on delinquencies from Black Knight:
 • March saw the largest monthly decline among delinquencies in 11 years, and the second-largest monthly improvement ever recordedThere is much more in the mortgage monitor.
• March delinquency drops are common, accounting for 17 of the 19 largest monthly declines in recent history
• This month saw even more robust improvement than average due to both January and February ending on Sundays – which tends to dampen performance and then lead to “bounce back” gains – as well as broader economic improvements
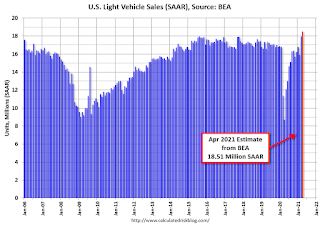
April Vehicles Sales increased to 18.51 Million SAAR; Highest Since 2005
by Calculated Risk on 5/04/2021 08:54:00 AM
The BEA released their estimate of light vehicle sales for April this morning. The BEA estimates sales of 18.51 million SAAR in April 2021 (Seasonally Adjusted Annual Rate), up 3.1% from the March sales rate, and up more than double from April 2020.
This was the highest sales rate since 2005.
This was above the consensus estimate.
 Click on graph for larger image.
This graph shows light vehicle sales since 2006 from the BEA (blue) and the BEA's estimate for April (red).
The impact of COVID-19 was significant, and April 2020 was the worst month.
Since April 2020, sales have increased are now up compared to 2019.
 Click on graph for larger image.
This graph shows light vehicle sales since 2006 from the BEA (blue) and the BEA's estimate for April (red).
The impact of COVID-19 was significant, and April 2020 was the worst month.
Since April 2020, sales have increased are now up compared to 2019.
Sales-to-date are up 1.9% compared to the same period in 2019.
The second graph shows light vehicle sales since the BEA started keeping data in 1967.
 Note: dashed line is current estimated sales rate of 18.51 million SAAR.
The second graph shows light vehicle sales since the BEA started keeping data in 1967.
 Note: dashed line is current estimated sales rate of 18.51 million SAAR.
Sales in April were positively impacted by the American Rescue Plan Act.


