 RSS Feed
 by Calculated Risk on 4/14/2021 03:52:00 PM
Wednesday, April 14, 2021
April 14th COVID-19 Vaccinations, New Cases, Hospitalizations
Note: I'm looking forward to not posting this daily! I've been posting this data daily for over a year, and I'll stop once all three of these criteria are met:
1) 70% of the population over 18 has had at least one dose of vaccine,
2) new cases are under 5,000 per day, and
3) hospitalizations are below 3,000.
According to the CDC, 194.8 million doses have been administered. 29.6% of the population over 18 is fully vaccinated, and 47.6% of the population over 18 has had at least one dose (123.0 million people have had at least one dose).
And check out COVID Act Now to see how each state is doing.
Over 8,500 US deaths were reported so far in April due to COVID.
 Click on graph for larger image.
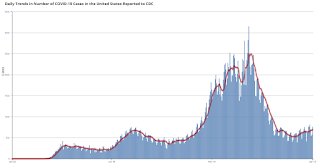
This graph shows the daily (columns) 7 day average (line) of positive tests reported.
Note: The ups and downs during the Winter surge were related to reporting delays due to the Thanksgiving and Christmas holidays.
This data is from the CDC.
 Click on graph for larger image.
This graph shows the daily (columns) 7 day average (line) of positive tests reported.
Note: The ups and downs during the Winter surge were related to reporting delays due to the Thanksgiving and Christmas holidays.
This data is from the CDC.
The 7-day average is 69,953, up from 67,813 yesterday, and above the summer surge peak of 67,337 on July 23, 2020.
The second graph shows the number of people hospitalized.
 This data is also from the CDC.
The CDC cautions that due to reporting delays, the area in grey will probably increase.
The second graph shows the number of people hospitalized.
 This data is also from the CDC.
The CDC cautions that due to reporting delays, the area in grey will probably increase.
The current 7-day average is 36,941, up from 36,257 reported yesterday, and well above the post-summer surge low of 23,000.
LA Area Port Traffic: Strong Imports in March
by Calculated Risk on 4/14/2021 02:18:00 PM
Note1: Import traffic was heavy in February and March - ships were backed up waiting to unload in LA. "some vessels are spending almost as much time at anchor as it takes to traverse the Pacific Ocean." They are still backed up in April!
Note2: The expansion to the Panama Canal was completed in 2016 (As I noted a few years ago), and some of the traffic that used the ports of Los Angeles and Long Beach is probably going through the canal. This might be impacting TEUs on the West Coast.
Container traffic gives us an idea about the volume of goods being exported and imported - and usually some hints about the trade report since LA area ports handle about 40% of the nation's container port traffic.
The following graphs are for inbound and outbound traffic at the ports of Los Angeles and Long Beach in TEUs (TEUs: 20-foot equivalent units or 20-foot-long cargo container).
To remove the strong seasonal component for inbound traffic, the first graph shows the rolling 12 month average.
 Click on graph for larger image.
On a rolling 12 month basis, inbound traffic was up 4.8% in March compared to the rolling 12 months ending in February. Outbound traffic was down 0.1% compared to the rolling 12 months ending the previous month.
The 2nd graph is the monthly data (with a strong seasonal pattern for imports).
 Usually imports peak in the July to October period as retailers import goods for the Christmas holiday, and then decline sharply and bottom in February or March depending on the timing of the Chinese New Year.
2021 has started off incredibly strong for imports.
Imports were up 98% YoY in March (collapsed early last year due to pandemic), and exports were down 1.5% YoY.
Imports were up 98% YoY in March (collapsed early last year due to pandemic), and exports were down 1.5% YoY.
Houston Real Estate in March: Sales Up 32% YoY, Inventory Down 43% YoY
by Calculated Risk on 4/14/2021 12:06:00 PM
From the HAR: Forces Combine to Keep Houston Real Estate Hot in March
A shortage of available homes priced at $250,000 and below combined with frenzied shopping among high-end homes produced a surge in pricing when compared to a Houston housing market in the grips of a pandemic-related lockdown a year earlier, in March 2020. Record low interest rates continued to fuel the buying bonanza.Inventory declined 43.2% year-over-year from 39,777 in March 2020 to 22,602 in March 2021. This is just 1.4 months of supply.
According to the latest Houston Association of Realtors (HAR) Market Update, single-family homes sales jumped 24.4 percent in March with 9,347 units sold versus 7,511 a year earlier. That marks the tenth straight positive month of sales. On a year-to-date basis, homes sales are running 16.9 percent ahead of 2020’s record pace.
...
Sales of all property types totaled 11,692 – up 31.5 percent from March 2020. Total dollar volume for the month shot up 55.8 percent to $4.0 billion.
...
A 5.8 percent year-over-year decline in new listings combined with another strong month of sales drove single-family homes inventory down to a 1.4-months supply compared to 3.4 months a year earlier. That is the lowest inventory level of all time.
emphasis added
These sales were for contracts that were mostly signed in January and February
Over Two Years Ago, Professor Shiller wrote: "The Housing Boom Is Already Gigantic"
by Calculated Risk on 4/14/2021 11:41:00 AM
In December 2018, Professor Shiller wrote in the NY Times: The Housing Boom Is Already Gigantic. How Long Can It Last?
We are, once again, experiencing one of the greatest housing booms in United States history.I noted at the time that I wasn't concerned. My analysis showed that the then current "boom" in prices (as of the end of 2018) was less or somewhat similar to the price booms of the late '70s and late '80s, and nothing like the "housing bubble".
How long this will last and where it is heading next are impossible to know now.
But it is time to take notice: My data shows that this is the United States’ third biggest housing boom in the modern era.
Since Shiller wrote that article in 2018, house prices have increased 16% nationally (from November 2018 to January 2021) according to the Case-Shiller index. Prices in Phoenix are up 25%, and in Seattle and San Diego, up about 20% since that article was written.
I'll update my analysis soon, but the current price boom is still less than the bubble, and but now more than the booms in the late '70s and late 80s.
MBA: Mortgage Applications Decrease in Latest Weekly Survey
by Calculated Risk on 4/14/2021 07:00:00 AM
From the MBA: Mortgage Applications Decrease in Latest MBA Weekly Survey
Mortgage applications decreased 3.7 percent from one week earlier, according to data from the Mortgage Bankers Association’s (MBA) Weekly Mortgage Applications Survey for the week ending April 9, 2021.
... The Refinance Index decreased 5 percent from the previous week and was 31 percent lower than the same week one year ago. The seasonally adjusted Purchase Index decreased 1 percent from one week earlier. The unadjusted Purchase Index decreased 1 percent compared with the previous week and was 51 percent higher than the same week one year ago.
Purchase and refinance applications declined, with most of the pullback coming earlier in the week when rates were higher. Treasury yields started last week high – close to the prior week’s level at over 1.7 percent – before decreasing 6 basis points,” said Joel Kan, MBA’s Associate Vice President of Economic and Industry Forecasting. “Refinance activity has now decreased for nine of the past 10 weeks, as rates have gone from 2.92 percent to 3.27 percent over the same period. Last week’s index level was the lowest in over a year, as mortgage rates continue to trend higher. Many borrowers have either already refinanced at lower rates or are unwilling – or unable – to refinance at current rates.”
Added Kan, “The third straight week of declining purchase activity is a sign that rising home prices and tight supply is constraining home sales – especially in the lower price tiers. Purchase applications were still above last year’s pandemic-impacted low point, but fell behind the level of activity seen the same week in 2019.”
...
The average contract interest rate for 30-year fixed-rate mortgages with conforming loan balances ($548,250 or less) decreased to 3.27 percent from 3.36 percent, with points decreasing to 0.33 from 0.43 (including the origination fee) for 80 percent loan-to-value ratio (LTV) loans.
emphasis added
 Click on graph for larger image.
The first graph shows the refinance index since 1990.
With low rates, the index remains elevated, but falling since rates are above the lows.
The second graph shows the MBA mortgage purchase index
 According to the MBA, purchase activity is up 51% year-over-year unadjusted.
Note: Until the 2nd half of May, the MBA index will be up sharply year-over-year since purchase activity collapsed in late March 2020 in the early weeks of the pandemic.
Note: Red is a four-week average (blue is weekly).
Tuesday, April 13, 2021
Wednesday: Fed Chair Powell, Beige Book
by Calculated Risk on 4/13/2021 09:00:00 PM
Wednesday:
• At 7:00 AM ET, The Mortgage Bankers Association (MBA) will release the results for the mortgage purchase applications index.
• At 12:00 PM, Discussion, Fed Chair Jerome Powell, Economic Club of Washington Interview, At the Economic Club of Washington (Watch Live)
• At 2:00 PM, the Federal Reserve Beige Book, an informal review by the Federal Reserve Banks of current economic conditions in their Districts.
April 13th COVID-19 Vaccinations, New Cases, Hospitalizations
by Calculated Risk on 4/13/2021 04:32:00 PM
Note: I'm looking forward to not posting this daily! I've been posting this data daily for over a year, and I'll stop once all three of these criteria are met:
1) 70% of the population over 18 has had at least one dose of vaccine,
2) new cases are under 5,000 per day, and
3) hospitalizations are below 3,000.
According to the CDC, 192.3 million doses have been administered. 29.1% of the population over 18 is fully vaccinated, and 47% of the population over 18 has had at least one dose (121.4 million people have had at least one dose).
And check out COVID Act Now to see how each state is doing.
Almost 8,000 US deaths were reported so far in April due to COVID.
 Click on graph for larger image.
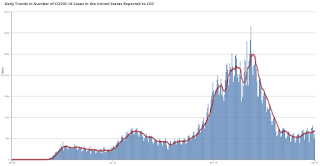
This graph shows the daily (columns) 7 day average (line) of positive tests reported.
Note: The ups and downs during the Winter surge were related to reporting delays due to the Thanksgiving and Christmas holidays.
This data is from the CDC.
 Click on graph for larger image.
This graph shows the daily (columns) 7 day average (line) of positive tests reported.
Note: The ups and downs during the Winter surge were related to reporting delays due to the Thanksgiving and Christmas holidays.
This data is from the CDC.
The 7-day average is 67,530, down from 67,663 yesterday, and above the summer surge peak of 67,337 on July 23, 2020.
The second graph shows the number of people hospitalized.
 This data is also from the CDC.
The CDC cautions that due to reporting delays, the area in grey will probably increase.
The second graph shows the number of people hospitalized.
 This data is also from the CDC.
The CDC cautions that due to reporting delays, the area in grey will probably increase.
The current 7-day average is 36,257, up from 34,640 reported yesterday, and well above the post-summer surge low of 23,000.
Second Home Market: South Lake Tahoe in March
by Calculated Risk on 4/13/2021 02:24:00 PM
Last month, from Jann Swanson at MortgageNewsDaily: Fannie Warns Lenders on Investment Properties and 2nd Homes. This action will result in higher interest rates on 2nd home and investment property mortgages.
I'm looking at data for some second home markets - and will track those markets to see if there is an impact from the lending changes.
This graph is for South Lake Tahoe since 2004 through March 2021, and shows inventory (blue), and the year-over-year change in the median price (12 month average).
Note: The median price is distorted by the mix, but this is the available data.
 Click on graph for larger image.
Following the housing bubble, prices declined for several years in South Lake Tahoe, with the median price falling about 50% from the bubble peak.
Note that inventory was high while prices were declining - and significantly lower inventory in 2012 suggested the bust was over. (Tracking inventory helped me call the bottom for housing way back in February 2012, see:The Housing Bottom is Here)
Currently inventory is at a record low, and prices are up sharply. This will be interesting to watch.
South Carolina Real Estate in March: Sales Up 22% YoY, Inventory Down 54% YoY
by Calculated Risk on 4/13/2021 02:10:00 PM
Note: I'm tracking data for many local markets around the U.S. I think it is especially important to watch inventory this year.
From the South Carolina Realtors for the entire state:
Closed sales in March 2021 were 9,958, up 22.3% from 8,144 in March 2020.
Active Listings in March 2021 were 12,754, down 53.8% from 27,624 in March 2020.
Months of Supply was 1.4 Months in March 2021, compared to 3.4 Months in March 2020.
Portland Real Estate in March: Sales Up 8% YoY, Inventory Down 54% YoY
by Calculated Risk on 4/13/2021 01:08:00 PM
Note: I'm tracking data for many local markets around the U.S. I think it is especially important to watch inventory this year.
For Portland, OR:
Closed sales in March 2021 were 2,556, up 8.5% from 2,356 in March 2020.
Active Listings in March 2021 were 1,943, down 53.9% from 4,218 in March 2020.
Months of Supply was 0.8 Months in March 2021, compared to 1.8 Months in March 2020.


