 RSS Feed
 by Calculated Risk on 3/26/2021 04:02:00 PM
Friday, March 26, 2021
March 26 COVID-19 Vaccinations, New Cases, Hospitalizations
According to the CDC, 136.7 million doses have been administered. 18.8% of the population over 18 is fully vaccinated, and 34.6% of the population over 18 has had at least one dose.
And check out COVID Act Now to see how each state is doing.
Almost 32,000 US deaths have been reported in March due to COVID.
 Click on graph for larger image.
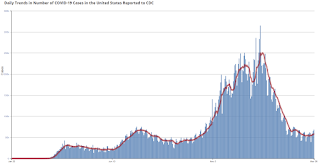
This graph shows the daily (columns) 7 day average (line) of positive tests reported.
This data is from the CDC.
 Click on graph for larger image.
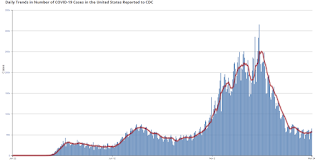
This graph shows the daily (columns) 7 day average (line) of positive tests reported.
This data is from the CDC.
The 7-day average is 58,598, up from 57,249 yesterday, and well above the low following the summer surge of 35,000.
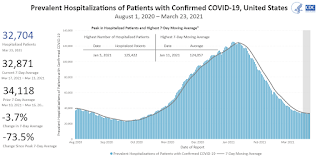
The second graph shows the number of people hospitalized.
 This data is also from the CDC.
The CDC cautions that due to reporting delays, the area in grey will probably increase.
The second graph shows the number of people hospitalized.
 This data is also from the CDC.
The CDC cautions that due to reporting delays, the area in grey will probably increase.
The current 7-day average is 32,843, down slightly from 32,871 yesterday, but well above the post-summer surge low of 23,000.
Las Vegas Visitor Authority: No Convention Attendance, Visitor Traffic Down 54% YoY in February
by Calculated Risk on 3/26/2021 01:35:00 PM
From the Las Vegas Visitor Authority: February 2021 Las Vegas Visitor Statistics
Although less than half of prior year levels, February's visitor tally of approx. 1.54M visitors reflected a welcome MoM increase of 18.9% over Jan 2021 as the vaccine rollout & continued protocols helped control the COVID spikes that emerged in Dec and Jan.
Total occupancy for Feb improved to 42.0%, 10.4 percentage points over Jan 2021, but was down from 86.8% in Feb 2020. Weekend occupancy (62.8%) and Midweek occupancy (32.1%) saw MoM gains over Jan of 14.5 pts and 9.6 pts, respectively.
Average daily rates reached $98 (up 8.1% MoM, down -25.8% YoY) while RevPAR came in at approx. $41.17, down -64.1% vs. Feb 2020.
 Click on graph for larger image.
 The first graph shows visitor traffic for 2019 (blue), 2020 (orange) and 2021 (red).
Visitor traffic was down 53.8% year-over-year.
Convention traffic was non-existent again in February, and was down 100% compared to February 2020.
There has been no convention traffic since March 2020.
I'll add a graph of convention traffic once conventions start to reopen.
Note: A convention is scheduled for early June (HT MS): "Informa Markets, organizers of the World of Concrete, has received approval from the Nevada Department of Business and Industry to move forward with its 2021 in-person edition. The event is scheduled to be held June 8-10, 2021 at the Las Vegas Convention Center."
Q1 GDP Forecasts
by Calculated Risk on 3/26/2021 11:21:00 AM
Note that the forecasts of the automated systems (based on released data) are declining, whereas the forecasts of economists have been increasing anticipating strong growth in economic activity in March due to the American Rescue Plan Act of 2021. From BofA yesterday:
"Total card spending, as measured by BAC aggregated card data, increased 45% 1-yr and 23% 2-yr for the 7-days ending Mar 20. The strong gain owes to the latest stimulus: total card spending for stimulus recipients is running 40% above the Feb avg."From Merrill Lynch:
1Q GDP tracking stands at 7.0% qoq saar. [Mar 26 estimate]From Goldman Sachs:
emphasis added
We left our Q1 GDP tracking estimate unchanged at +7.5% (qoq ar). [Mar 26 estimate]From the NY Fed Nowcasting Report
The New York Fed Staff Nowcast stands at 6.1% for 2021:Q1 and 0.7% for 2021:Q2. [Mar 26 estimate]And from the Atlanta Fed: GDPNow
The GDPNow model estimate for real GDP growth (seasonally adjusted annual rate) in the first quarter of 2021 is 4.7 percent on March 26, down from 5.4 percent on March 24. [Mar 26 estimate]
Black Knight: Number of Homeowners in COVID-19-Related Forbearance Plans Decreased
by Calculated Risk on 3/26/2021 10:52:00 AM
Note: Both Black Knight and the MBA (Mortgage Bankers Association) are putting out weekly estimates of mortgages in forbearance.
This data is as of March 23rd.
From Black Knight: Another Week of Improvement in Forbearance Numbers
Active forbearance plans fell again this week, dropping by another 19,000 (-0.7%) from last Tuesday. In total, this puts the number of active plans down by 134,000 over the last month – a 5% reduction. This monthly decline represents the strongest rate of improvement since late November 2020 and is a direct result of servicers working through the 1.2 million plans that entered this month with scheduled March month-end expirations for extension and/or removal.The number of loans in forbearance has slowly declined over the last few months.
Of particular note when taking a look at this week’s numbers: even with such strong monthly improvement, there are still more than 460,000 active plans with March month-end expirations, which provides the potential for additional improvement in the coming weeks.
...
Click on graph for larger image.
Early extension activity suggests that mortgage servicers continue to approach forbearance plans in three-month increments, with the bulk of would-be March expirations being extended out through June. Plan extensions have accounted for 75% of all extension/removal activity in recent weeks, but removals are up simply as a result of the volume of expirations that were scheduled for this month.
Finally, the McDash Flash Payment Tracker shows that 90.7% of observed borrowers had made their payment through March 22, up from 89.8% at the same time in February suggesting that the recent improvement in outstanding mortgage delinquencies may resume in March after taking a step back last month. We’ll keep watching to see if this upward trend continues, and will post another weekly update on this blog next Friday, April 2.
emphasis added

BLS: February Unemployment rates down in 23 States
by Calculated Risk on 3/26/2021 10:28:00 AM
From the BLS: Regional and State Employment and Unemployment Summary
Unemployment rates were lower in February in 23 states and the District of Columbia, higher in 4 states, and stable in 23 states, the U.S. Bureau of Labor Statistics reported today. Forty-five states and the District had jobless rate increases from a year earlier and five states had little or no change. The national unemployment rate, 6.2 percent, was little changed over the month, but was 2.7 percentage points higher than in February 2020.Hawaii is being impacted by the lack of tourism.
Nonfarm payroll employment increased in 11 states, decreased in 3 states, and was essentially unchanged in 36 states and the District of Columbia in February 2021. Over the year, nonfarm payroll employment decreased in 48 states and the District and was essentially unchanged in 2 states.
...
Hawaii and New York had the highest unemployment rates in February, 9.2 percent and 8.9 percent, respectively, while South Dakota, 2.9 percent, and Utah, 3.0 percent, had the lowest rates.
Personal Income decreased 7.1% in February, Spending decreased 1.0%
by Calculated Risk on 3/26/2021 08:42:00 AM
The BEA released the Personal Income and Outlays report for February:
Personal income income decreased $1,516.6 billion (7.1 percent) in February according to estimates released today by the Bureau of Economic Analysis. Disposable personal income (DPI) decreased $1,532.3 billion (8.0 percent) and personal consumption expenditures (PCE) decreased $149.0 billion (1.0 percent).The February PCE price index increased 1.6 percent year-over-year and the February PCE price index, excluding food and energy, increased 1.4 percent year-over-year.
Real DPI decreased 8.2 percent in February and Real PCE decreased 1.2 percent; goods decreased 3.3 percent and services decreased 0.1 percent. The PCE price index increased 0.2 percent. Excluding food and energy, the PCE price index increased 0.1 percent.
emphasis added
The following graph shows real Personal Consumption Expenditures (PCE) through February 2021 (2012 dollars). Note that the y-axis doesn't start at zero to better show the change.
 Click on graph for larger image.
The dashed red lines are the quarterly levels for real PCE.
Personal income was at expectations, and the decrease in PCE was slightly below expectations.
Using the two-month method to estimate Q1 PCE growth, PCE was increasing at a 6.3% annual rate in Q1 2021. (using the mid-month method, PCE was increasing at 3.3%). However, these methods are understating growth in Q1, due to the American Rescue Plan Act of 2021. Both income and spending increased sharply in March, from BofA yesterday:
"Total card spending, as measured by BAC aggregated card data, increased 45% 1-yr and 23% 2-yr for the 7-days ending Mar 20.
The strong gain owes to the latest stimulus: total card spending for stimulus recipients is running 40% above the Feb avg."
Thursday, March 25, 2021
Friday: February Personal Income and Outlays
by Calculated Risk on 3/25/2021 09:00:00 PM
Friday:
• At 8:30 AM ET, Personal Income and Outlays, February. The consensus is for a 7.0% decrease in personal income, and for a 0.6% decrease in personal spending. And for the Core PCE price index to increase 0.1%.
• At 10:00 AM, University of Michigan's Consumer sentiment index (Final for March). The consensus is for a reading of 83.5.
• Also at 10:00 AM, State Employment and Unemployment (Monthly), February 2021
Freddie Mac: Mortgage Serious Delinquency Rate decreased in February
by Calculated Risk on 3/25/2021 04:40:00 PM
Freddie Mac reported that the Single-Family serious delinquency rate in February was 2.52%, down from 2.56% in January. Freddie's rate is up from 0.60% in February 2020.
Freddie's serious delinquency rate peaked in February 2010 at 4.20% following the housing bubble, and peaked at 3.17% in August 2020 during the pandemic.
These are mortgage loans that are "three monthly payments or more past due or in foreclosure".
 Click on graph for larger image
Mortgages in forbearance are being counted as delinquent in this monthly report, but they will not be reported to the credit bureaus.
This is very different from the increase in delinquencies following the housing bubble. Lending standards have been fairly solid over the last decade, and most of these homeowners have equity in their homes - and they will be able to restructure their loans once (if) they are employed.
Also - for multifamily - delinquencies were at 0.14%, down from 0.16% in January, and up almost double from 0.08% in February 2020.
March 25 COVID-19 Vaccinations, New Cases, Hospitalizations
by Calculated Risk on 3/25/2021 04:28:00 PM
According to the CDC, 133.5 million doses have been administered. 18.3% of the population over 18 is fully vaccinated, and 33.7% of the population over 18 has had at least one dose.
And check out COVID Act Now to see how each state is doing. (updated link to new site)
Almost 31,000 US deaths have been reported in March due to COVID.
 Click on graph for larger image.
This graph shows the daily (columns) 7 day average (line) of positive tests reported.
This data is from the CDC.
 Click on graph for larger image.
This graph shows the daily (columns) 7 day average (line) of positive tests reported.
This data is from the CDC.
The 7-day average is 57,249, up from 56,272 yesterday, and well above the low following the summer surge of 35,000.
The second graph shows the number of people hospitalized.
 This data is also from the CDC.
The CDC cautions that due to reporting delays, the area in grey will probably increase.
The second graph shows the number of people hospitalized.
 This data is also from the CDC.
The CDC cautions that due to reporting delays, the area in grey will probably increase.
The current 7-day average is 32,871, down from 33,001 yesterday, but well above the post-summer surge low of 23,000.
Kansas City Fed: Tenth District Manufacturing Activity "Grew Solidly" in March
by Calculated Risk on 3/25/2021 02:10:00 PM
From the Kansas City Fed: Tenth District Manufacturing Activity Grew Solidly
The Federal Reserve Bank of Kansas City released the March Manufacturing Survey today. According to Chad Wilkerson, vice president and economist at the Federal Reserve Bank of Kansas City, the survey revealed that Tenth District manufacturing activity grew solidly compared to a month ago and a year ago with positive expectations for future activity.These regional surveys have been strong in March.
“Regional factories continued to report solid growth in March,” said Wilkerson. “Materials prices remain extremely high for most firms. However, many manufacturers have been able to pass through at least a portion of the price increases on to customers.”
...
The month-over-month composite index was 26 in March, higher than 24 in February and 17 in January. The composite index is an average of the production, new orders, employment, supplier delivery time, and raw materials inventory indexes. The growth in district manufacturing activity was driven more by durable goods plants for primary metals, machinery, transportation equipment, furniture, and miscellaneous manufacturing. Month-over-month indexes for shipments, new orders, and order backlog expanded at a faster pace in March and supplier delivery time was very high as well. Growth in production and employment remained positive, but slightly slower than in recent months. Materials inventories were positive while finished goods inventories dipped further from a month ago. Year-over-year factory indexes rose in March, and business conditions are now comparable to levels at the start of the pandemic last year. The year-over-year composite index increased from 8 to 16, but new orders for exports and finished goods inventories continued to lag year-ago levels. The future composite index expanded slightly from 34 to 35 with an uptick in employment expectations.
emphasis added


