by Calculated Risk on 3/23/2021 09:11:00 PM
Tuesday, March 23, 2021
Wednesday: Fed Chair Powell, Durable Goods
On Thursday, from 11:30 AM - 12:30 PM (PST), UCI Professor Chris Schwarz talks on the economy and financial markets. This webinar is free for all and brought to you by UCI's Paul Merage School of Business and Center for Investment and Wealth Management as well as the Newport Beach Chamber of Commerce.
Chris' presentations are great. This is free. Register here
Wednesday:
• At 7:00 AM ET, The Mortgage Bankers Association (MBA) will release the results for the mortgage purchase applications index.
• At 8:30 AM, Durable Goods Orders for February from the Census Bureau. The consensus is for a 0.8% increase in durable goods orders.
• At 10:00 AM, Testimony, Fed Chair Powell, Coronavirus Aid, Relief, and Economic Security Act, Before the Committee on Banking, Housing, and Urban Affairs, U.S. Senate
• During the day, The AIA's Architecture Billings Index for February (a leading indicator for commercial real estate).
March 23 COVID-19 Vaccinations, New Cases, Hospitalizations
by Calculated Risk on 3/23/2021 05:13:00 PM
According to the CDC, 128.2 million doses have been administered. 17.6% of the population over 18 is fully vaccinated, and 32.4% of the population over 18 has had at least one dose.
And check out COVID Act Now to see how each state is doing. (updated link to new site)
 Click on graph for larger image.
This graph shows the daily (columns) 7 day average (line) of positive tests reported.
This data is from the CDC.
The second graph shows the number of people hospitalized.
 This data is also from the CDC.
The CDC cautions that due to reporting delays, the area in grey will probably increase.
New Home Prices
by Calculated Risk on 3/23/2021 01:29:00 PM
As part of the new home sales report released this morning, the Census Bureau reported the number of homes sold by price and the average and median prices.
From the Census Bureau: "The median sales price of new houses sold in February 2021 was $349,400. The average sales price was $416,000."
The following graph shows the median and average new home prices.

During the housing bust, the builders had to build smaller and less expensive homes to compete with all the distressed sales. When housing started to recovery - with limited finished lots in recovering areas - builders moved to higher price points to maximize profits.
The average price in February 2021 was $416,000, up 7.7% year-over-year. The median price was $349,400, up 5.3% year-over-year.
The second graph shows the percent of new homes sold by price.
 Very few new homes sold were under $150K in February 2021 ("Less than 500 units" in February 2021, rounded down to zero). This is down from 30% in 2002. In general, the under $150K and under $200K brackets are going away.
 The $400K+ bracket increased significantly after the housing recovery started, but has been holding steady recently. A majority of new homes (about 63%) in the U.S., are in the $200K to $400K range.
A few Comments on February New Home Sales
by Calculated Risk on 3/23/2021 12:07:00 PM
New home sales for February were reported at 775,000 on a seasonally adjusted annual rate basis (SAAR). Sales for the previous three months were revised up significantly.
This was well below consensus expectations for February. The weather was harsh in February - and probably played a role in the decline in sales - but the large year-over-year declines were in the West and Northeast. If the sales decline in February had been mostly weather related, we'd expect large declines in the mid-West and South regions (but sales were up year-over-year in those regions).
Earlier: New Home Sales decrease to 775,000 Annual Rate in February.
 Click on graph for larger image.
This graph shows new home sales for 2020 and 2021 by month (Seasonally Adjusted Annual Rate).
The year-over-year comparisons are easy in early 2021 - especially in March and April.
However, sales will likely be down year-over-year in August through October - since the selling season was delayed in 2020.
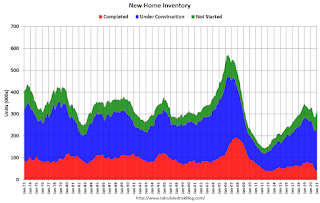
And on inventory: note that completed inventory (3rd graph) is near record lows, but inventory under construction is closer to normal.
 On inventory, according to the Census Bureau:
 "A house is considered for sale when a permit to build has been issued in permit-issuing places or work has begun on the footings or foundation in nonpermit areas and a sales contract has not been signed nor a deposit accepted."Starting in 1973 the Census Bureau broke this down into three categories: Not Started, Under Construction, and Completed.
This graph shows the months of supply by stage of construction..
The inventory of completed homes for sale was at 40 thousand in February was just above the record low of 37 thousand in 2013 (when sales were much lower). That is about 0.6 months of completed supply.
New Home Sales decrease to 775,000 Annual Rate in February
by Calculated Risk on 3/23/2021 10:13:00 AM
The Census Bureau reports New Home Sales in February were at a seasonally adjusted annual rate (SAAR) of 775 thousand.
The previous three months were revised up.
Sales of new single-family houses in February 2021 were at a seasonally adjusted annual rate of 775,000, according to estimates released jointly today by the U.S. Census Bureau and the Department of Housing and Urban Development. This is 18.2 percent below the revised January rate of 948,000, but is 8.2 percent above the February 2020 estimate of 716,000.
emphasis added
 Click on graph for larger image.
The first graph shows New Home Sales vs. recessions since 1963. The dashed line is the current sales rate.
The last nine months saw the highest sales rates since 2006. This was decent year-over-year growth.
The second graph shows New Home Months of Supply.
 The months of supply increased in February to 4.8 months from 3.8 months in January.
 The all time record high was 12.1 months of supply in January 2009. The all time record low is 3.5 months, most recently in October 2020.
This is in the normal range (about 4 to 6 months supply is normal).
"The seasonally-adjusted estimate of new houses for sale at the end of February was 312,000. This represents a supply of 4.8 months at the current sales rate. "
 On inventory, according to the Census Bureau:
 "A house is considered for sale when a permit to build has been issued in permit-issuing places or work has begun on the footings or foundation in nonpermit areas and a sales contract has not been signed nor a deposit accepted."Starting in 1973 the Census Bureau broke this down into three categories: Not Started, Under Construction, and Completed.
The third graph shows the three categories of inventory starting in 1973.
The inventory of completed homes for sale is low, and the combined total of completed and under construction is a little lower than normal.
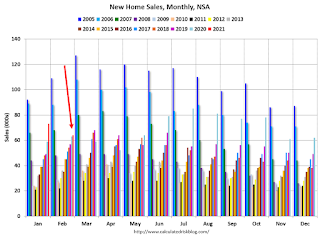
 The last graph shows sales NSA (monthly sales, not seasonally adjusted annual rate).
In February 2021 (red column), 64 thousand new homes were sold (NSA). Last year, 63 thousand homes were sold in February
The all time high for February was 109 thousand in 2005, and the all time low for February was 22 thousand in 2011.
This was well below expectations, however sales in the three previous months were revised up. I'll have more later today.
Black Knight: National Mortgage Delinquency Rate Increased in February
by Calculated Risk on 3/23/2021 09:03:00 AM
Note: Loans in forbearance are counted as delinquent in this survey, but those loans are not reported as delinquent to the credit bureaus.
From Black Knight: Black Knight’s First Look: Mortgage Delinquencies Rise for the First Time in Nine Months; Increase Largely Calendar-Driven but Bears Watching
• After eight consecutive months of improvement, the national mortgage delinquency rate rose in February from 5.85% to 6.0%According to Black Knight's First Look report, the percent of loans delinquent increased 2.6% in February compared to January, and increased 83% year-over-year.
• The rise was largely calendar-related, as February is both a short month and ended on a Sunday – cutting the days on which payments can be processed – which has historically impacted performance metrics
• Delinquency rate increases were seen broadly across portfolios, geographies and asset classes
• The increase was primarily seen in early-stage delinquencies, while the number of loans 90 or more days past due but not yet in foreclosure (including those in active forbearance) saw a modest decline
• Prepayment activity edged upward in February as well, but recent 30-year interest rate increases are likely to put downward pressure on prepayment rates in the coming months
• Both foreclosure starts and active foreclosure inventory again hit new record lows, as recently extended foreclosure moratoriums continue to suppress activity
emphasis added
The percent of loans in the foreclosure process decreased 1.1% in February and were down 30% over the last year.
Black Knight reported the U.S. mortgage delinquency rate (loans 30 or more days past due, but not in foreclosure) was 6.00% in February, up from 5.85% in January.
The percent of loans in the foreclosure process decreased slightly in February to 0.32%, from 0.32% in January.
The number of delinquent properties, but not in foreclosure, is up 1,449,000 properties year-over-year, and the number of properties in the foreclosure process is down 71,000 properties year-over-year.
| Black Knight: Percent Loans Delinquent and in Foreclosure Process | ||||
|---|---|---|---|---|
| Feb 2021 | Jan 2020 | Feb 2020 | Feb 2019 | |
| Delinquent | 6.00% | 5.85% | 3.28% | 3.89% |
| In Foreclosure | 0.32% | 0.32% | 0.45% | 0.51% |
| Number of properties: | ||||
| Number of properties that are delinquent, but not in foreclosure: | 3,186,000 | 3,130,000 | 1,737,000 | 2,019,000 |
| Number of properties in foreclosure pre-sale inventory: | 168,000 | 171,000 | 239,000 | 264,000 |
| Total Properties | 3,354,000 | 3,301,000 | 1,976,000 | 2,284,000 |
Monday, March 22, 2021
Tuesday: New Home Sales, Fed Chair Powell Testimony, Richmond Fed Mfg
by Calculated Risk on 3/22/2021 09:00:00 PM
From Matthew Graham at Mortgage News Daily: MBS RECAP: Not a Bad Day, But We Need More Convincing
Rates have tried to convince us that the worst is over on several occasions in the past few months. First it was 1.18%, then 1.38%, and most recently 1.63% (all in terms of 10yr yields), but all of those would-be ceilings quickly gave way to more weakness. 1.75% is now singing the same tune. ... [30 year fixed 3.43%]Tuesday:
emphasis added
• At 10:00 AM ET, New Home Sales for February from the Census Bureau. The consensus is for 885 thousand SAAR, down from 923 thousand in January.
• Also at 10:00 AM, Richmond Fed Survey of Manufacturing Activity for March.
• At 12:00 PM, Testimony, Fed Chair Powell, Coronavirus Aid, Relief, and Economic Security Act, Before the Committee on Financial Services, U.S. House of Representatives
March 22 COVID-19 Vaccinations, New Cases, Hospitalizations
by Calculated Risk on 3/22/2021 05:34:00 PM
According to the CDC, 126.5 million doses have been administered. 17.4% of the population over 18 is fully vaccinated, and 32% of the population over 18 has had at least one dose.
And check out COVID Act Now to see how each state is doing. (updated link to new site)
 Click on graph for larger image.
This graph shows the daily (columns) 7 day average (line) of positive tests reported.
This data is from the CDC.
The second graph shows the number of people hospitalized.
 This data is also from the CDC.
The CDC cautions that due to reporting delays, the area in grey will probably increase.
MBA Survey: "Share of Mortgage Loans in Forbearance Decreases to 5.05%"
by Calculated Risk on 3/22/2021 04:00:00 PM
Note: This is as of March 14th.
From the MBA: Share of Mortgage Loans in Forbearance Decreases to 5.05%
The Mortgage Bankers Association’s (MBA) latest Forbearance and Call Volume Survey revealed that the total number of loans now in forbearance decreased by 9 basis points from 5.14% of servicers’ portfolio volume in the prior week to 5.05% as of March 14, 2021. According to MBA’s estimate, 2.5 million homeowners are in forbearance plans.
...
“New forbearance requests decreased to their lowest level since last March. Combined with a steady pace of exits, this drop in new requests resulted in a larger decline in the share of loans in forbearance across all investor categories,” said Mike Fratantoni, MBA’s Senior Vice President and Chief Economist. “More than 11 percent of borrowers in forbearance have now exceeded the 12-month mark. We anticipate that servicers will be busy over the next month, with many homeowners opting for the extension for up to 18 months recently made available for federally-backed loans.”
Fratantoni added, “The pace of economic activity is picking up as the vaccine rollout continues. We expect that a stronger job market will help many successfully exit forbearance in the months ahead.”
emphasis added
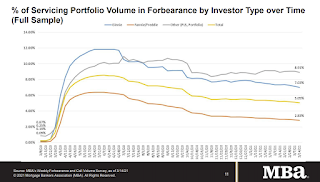
 Click on graph for larger image.
This graph shows the percent of portfolio in forbearance by investor type over time. Most of the increase was in late March and early April, and has trended down since then.
The MBA notes: "Total weekly forbearance requests as a percent of servicing portfolio volume (#) decreased relative to the prior week: from 0.07% to 0.05%, the lowest level since the week ending March 15, 2020."
Housing Inventory March 22nd Update: At Record Lows
by Calculated Risk on 3/22/2021 01:31:00 PM
One of the key questions for 2021 is: Will inventory increase as the pandemic subsides, or will inventory decrease further in 2021?
Tracking inventory will be very important this year.

This inventory graph is courtesy of Altos Research.
Mike Simonsen discusses this data regularly on Youtube.


