 RSS Feed
 by Calculated Risk on 3/07/2021 07:42:00 PM
Sunday, March 07, 2021
March 7 COVID-19 Test Results and Vaccinations; Over 90 Million Doses Administered
SPECIAL NOTE: The Covid Tracking Project ends today (March 7th). Awesome job. Starting tomorrow, I will post from different sources.
From Bloomberg on vaccinations as of Mar 7th:
"In the U.S., more Americans have now received at least one dose than have tested positive for the virus since the pandemic began. So far, 90.4 million doses have been given. In the last week, an average of 2.16 million doses per day were administered."Here is the CDC COVID Data Tracker. This site has data on vaccinations, cases and more.
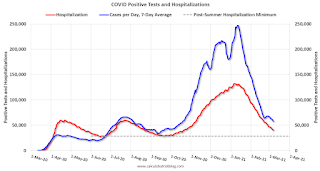
The US has averaged 1.4 million tests per day over the last week. The percent positive over the last 7 days was 4.1%.
Based on the experience of other countries, for adequate test-and-trace (and isolation) to reduce infections, the percent positive needs to below 1%, so the US has far too many daily cases - and percent positive - to do effective test-and-trace.
There were 1,156,241 test results reported over the last 24 hours.
There were 41,265 positive tests.
Almost 12,000 US deaths have been reported in March. See the graph on US Daily Deaths here.
This data is from the COVID Tracking Project.
And check out COVID Act Now to see how each state is doing. (updated link to new site)
 Click on graph for larger image.
This graph shows the 7 day average of positive tests reported and daily hospitalizations.
The dashed line is the post-summer surge low for hospitalizations.
The Employment Situation is Far Worse than the Unemployment Rate Indicates
by Calculated Risk on 3/07/2021 09:13:00 AM
The headline unemployment rate of 6.2% significantly understates the current situation.
Here is a table that shows the current number of unemployed and the unemployment rate (as of February 2021).
Then I calculated the unemployment rate by including the number of people that have left the labor force since early 2020, and the expected growth in the labor force.
As the economy recovers, many of the people that left the labor force will probably return, and there will likely be more entrants into the labor force (although recent demographic data has been dismal).
Fed Chair Powell made a similar argument last month: Getting Back to a Strong Labor Market Excerpt: Then I calculated the unemployment rate by including the number of people that have left the labor force since early 2020, and the expected growth in the labor force.
| Unemployment Rate | Unemployed (000s) | Left Labor Force (000s) | Expected Labor Force Growth (000s) | Adjusted Unemployment Rate | |
|---|---|---|---|---|---|
| Jul-20 | 10.2% | 16,308 | 4,370 | 600 | 12.9% |
| Aug-20 | 8.4% | 13,542 | 3,637 | 700 | 10.8% |
| Sep-20 | 7.8% | 12,535 | 4,377 | 800 | 10.7% |
| Oct-20 | 6.9% | 11,049 | 3,737 | 900 | 9.5% |
| Nov-20 | 6.7% | 10,728 | 3,919 | 1,000 | 9.5% |
| Dec-20 | 6.7% | 10,736 | 3,888 | 1,100 | 9.5% |
| Jan-21 | 6.3% | 10,130 | 4,294 | 1,200 | 9.4% |
| Feb-21 | 6.2% | 9,972 | 4,244 | 1,300 | 9.4% |
As the economy recovers, many of the people that left the labor force will probably return, and there will likely be more entrants into the labor force (although recent demographic data has been dismal).
Employment in January of this year was nearly 10 million below its February 2020 level, a greater shortfall than the worst of the Great Recession's aftermath.
After rising to 14.8 percent in April of last year, the published unemployment rate has fallen relatively swiftly, reaching 6.3 percent in January. But published unemployment rates during COVID have dramatically understated the deterioration in the labor market. Most importantly, the pandemic has led to the largest 12-month decline in labor force participation since at least 1948. Fear of the virus and the disappearance of employment opportunities in the sectors most affected by it, such as restaurants, hotels, and entertainment venues, have led many to withdraw from the workforce. At the same time, virtual schooling has forced many parents to leave the work force to provide all-day care for their children. All told, nearly 5 million people say the pandemic prevented them from looking for work in January. In addition, the Bureau of Labor Statistics reports that many unemployed individuals have been misclassified as employed. Correcting this misclassification and counting those who have left the labor force since last February as unemployed would boost the unemployment rate to close to 10 percent in January.
emphasis added
 Click on graph for larger image.
 This graph from the Fed shows the actually unemployment rate and some alternative estimates (mostly due to people leaving the labor force).
It would be a mistake to just look at the headline unemployment rate to assess the current situation.
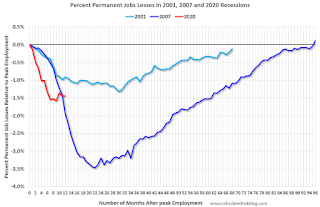
The following graph - that I post each month - show the percent decline in employment since the start of each recession since WWII.
 The second graph shows the job losses from the start of the employment recession, in percentage terms.
The current employment recession was by far the worst recession since WWII in percentage terms.
At the worst of the Great Recession, employment was down Down 6.29% from the previous peak.
Currently employment is down 6.21% - the current unemployment situation is about the same as the worst of the Great Recession (and there was no pandemic to contend with in 2009).
Saturday, March 06, 2021
March 6 COVID-19 Test Results and Vaccinations
by Calculated Risk on 3/06/2021 07:05:00 PM
SPECIAL NOTE: The Covid Tracking Project will end daily updates on March 7th.
From Bloomberg on vaccinations as of Mar 6th.
"In the U.S., more Americans have now received at least one dose than have tested positive for the virus since the pandemic began. So far, 87.9 million doses have been given. In the last week, an average of 2.16 million doses per day were administered."Here is the CDC COVID Data Tracker. This site has data on vaccinations, cases and more.
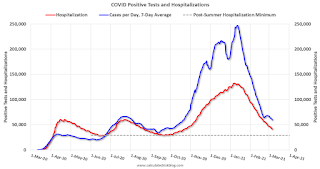
The US has averaged 1.4 million tests per day over the last week. The percent positive over the last 7 days was 4.2%.
Based on the experience of other countries, for adequate test-and-trace (and isolation) to reduce infections, the percent positive needs to below 1%, so the US has far too many daily cases - and percent positive - to do effective test-and-trace.
There were 1,409,138 test results reported over the last 24 hours.
There were 59,620 positive tests.
Over 11,000 US deaths have been reported in March. See the graph on US Daily Deaths here.
This data is from the COVID Tracking Project.
And check out COVID Act Now to see how each state is doing. (updated link to new site)
 Click on graph for larger image.
This graph shows the 7 day average of positive tests reported and daily hospitalizations.
The dashed line is the post-summer surge low for hospitalizations.
Schedule for Week of March 7, 2021
by Calculated Risk on 3/06/2021 08:11:00 AM
This will be a light week for economic data.
The key report scheduled for this week is February CPI.
No major economic releases scheduled.
6:00 AM ET: NFIB Small Business Optimism Index for February.
7:00 AM ET: The Mortgage Bankers Association (MBA) will release the results for the mortgage purchase applications index.
8:30 AM: The Consumer Price Index for February from the BLS. The consensus is for a 0.4% increase in CPI, and a 0.2% increase in core CPI.
8:30 AM: The initial weekly unemployment claims report will be released. The consensus is for a increase to 760 thousand from 745 thousand last week.
 10:00 AM ET: Job Openings and Labor Turnover Survey for January from the BLS.
 This graph shows job openings (yellow line), hires (purple), Layoff, Discharges and other (red column), and Quits (light blue column) from the JOLTS.
Jobs openings increased in December to 6.646 million from 6.572 million in November.
12:00 PM: Q4 Flow of Funds Accounts of the United States from the Federal Reserve.
8:30 AM: The Producer Price Index for February from the BLS. The consensus is for a 0.4% decrease in PPI, and a 0.2% increase in core PPI.
10:00 AM: University of Michigan's Consumer sentiment index (Preliminary for March).
Friday, March 05, 2021
March 5 COVID-19 Test Results and Vaccinations: 85 Million Doses Given So Far
by Calculated Risk on 3/05/2021 07:21:00 PM
SPECIAL NOTE: The Covid Tracking Project will end daily updates on March 7th.
From Bloomberg on vaccinations as of Mar 5th.
"In the U.S., more Americans have now received at least one dose than have tested positive for the virus since the pandemic began. So far, 85 million doses have been given. In the last week, an average of 2.08 million doses per day were administered."Here is the CDC COVID Data Tracker. This site has data on vaccinations, cases and more.
The US has averaged 1.5 million tests per day over the last week. The percent positive over the last 7 days was 4.2%.
Based on the experience of other countries, for adequate test-and-trace (and isolation) to reduce infections, the percent positive needs to below 1%, so the US has far too many daily cases - and percent positive - to do effective test-and-trace.
There were 1,744,446 test results reported over the last 24 hours.
There were 68,787 positive tests.
Over 9,000 US deaths have been reported in March. See the graph on US Daily Deaths here.
This data is from the COVID Tracking Project.
And check out COVID Act Now to see how each state is doing. (updated link to new site)
 Click on graph for larger image.
This graph shows the 7 day average of positive tests reported and daily hospitalizations.
The dashed line is the post-summer surge low for hospitalizations.
Q1 GDP Forecasts: Around 5.5% SAAR
by Calculated Risk on 3/05/2021 02:32:00 PM
From Merrrill Lynch:
We continue to track 5.5% for 1Q GDP tracking. [Mar 5 estimate]From Goldman Sachs:
emphasis added
We left our Q1 GDP tracking estimate unchanged at +5.5% (qoq ar). [Mar 5 estimate]From the NY Fed Nowcasting Report
The New York Fed Staff Nowcast stands at 8.6% for 2021:Q1 and 4.0% for 2021:Q2. [Mar 5 estimate]And from the Altanta Fed: GDPNow
The GDPNow model estimate for real GDP growth (seasonally adjusted annual rate) in the first quarter of 2021 is 8.3 percent on March 5, down from 10.0 percent on March 1. [Mar 5 estimate]
AAR: February Rail Carloads down 11.1% YoY, Intermodal Up 1.8% YoY
by Calculated Risk on 3/05/2021 12:50:00 PM
From the Association of American Railroads (AAR) Rail Time Indicators. Graphs and excerpts reprinted with permission.
The U.S. freight rail network is subject to, and sometimes at the mercy of, hurricanes, tornadoes, floods, and other whims of nature. In February, the whims included exceptionally cold and icy conditions in most of the country, including in many areas that aren’t used to it. For rail, it meant reduced operations and, in some areas, complete temporary shutdowns. It was so bad, in fact, that total U.S. rail carloads in the third week of February were the lowest of any week in our records that go back to 1988. Volumes recovered the next week, but the net impact was materially lower rail volumes in February.
In February 2021, U.S total carloads were down 11.1% from February 2020, the biggest percentage decline in six months ... However, U.S. intermodal originations were 1.8% higher in February 2021 than in February 2020, continuing what’s now a streak of seven straight months of year-over-year gains.
emphasis added
 Click on graph for larger image.
This graph from the Rail Time Indicators report shows the six week average of U.S. Carloads in 2019, 2020 and 2021:
In February, U.S. railroads originated 824,636 total carloads, down 11.1% (102,972 carloads) from February 2020. That’s the biggest year-over-year percentage decline in six months, much worse than the 2.1% decline in January 2021 and 3.7% decline in December 2020. In the third week of February, when the worst of the bad weather struck, the year-over-year decline was 26.3%.
 The second graph shows the six week average of U.S. intermodal in 2019, 2020 and 2021: (using intermodal or shipping containers):
U.S. railroads originated 1.02 million intermodal containers and trailers in February 2021, an average of 253,999 per week. That’s 1.8% higher than the weekly average in February 2020, continuing what’s now a streak of seven straight months of year-over-year intermodal gains. U.S. intermodal originations averaged 293,305 per week in January 2021, an all-time record.Note that rail traffic was weak prior to the pandemic, however intermodal has come back strong.
Trade Deficit Increased to $68.2 Billion in January
by Calculated Risk on 3/05/2021 10:38:00 AM
From the Department of Commerce reported:
The U.S. Census Bureau and the U.S. Bureau of Economic Analysis announced today that the goods and services deficit was $68.2 billion in January, up $1.2 billion from $67.0 billion in December, revised.
January exports were $191.9 billion, $1.8 billion more than December exports. January imports were $260.2 billion, $3.1 billion more than December imports.
emphasis added
 Click on graph for larger image.
Both exports and imports increased in January.
Exports are down 7.6% compared to January 2020; imports are up 3.2% compared to January 2020.
Both imports and exports decreased sharply due to COVID-19, and have now bounced back (imports much more than exports),
The second graph shows the U.S. trade deficit, with and without petroleum.
 The blue line is the total deficit, and the black line is the petroleum deficit, and the red line is the trade deficit ex-petroleum products.
Note that the U.S. exported a slight net positive petroleum products in recent months.
Oil imports averaged $42.50 per barrel in January, up from $38.30 per barrel in December, and down from $52.24 in January 2020.
The trade deficit with China increased to $26.3 billion in January, from $26.1 billion in January 2020.
Comments on February Employment Report
by Calculated Risk on 3/05/2021 09:13:00 AM
The headline jobs number in the February employment report was well above expectations, and employment for the previous two months was revised up slightly.
Leisure and hospitality gained 355 thousand jobs in February (most of the job gains in February were in Leisure and hospitality). In March and April of 2020, leisure and hospitality lost 8.2 million jobs, and then gained about 60% of those jobs back. However, leisure and hospitality lost jobs in December and January - before gaining jobs in February - and are now down 3.5 million jobs since February 2020.
Earlier: February Employment Report: 379 Thousand Jobs, 6.2% Unemployment Rate
In February, the year-over-year employment change was minus 9.475 million jobs. This will turn positive in April due to the sharp jobs losses in April 2020.
Permanent Job Losers
 Click on graph for larger image.
This graph shows permanent job losers as a percent of the pre-recession peak in employment through the December report. (ht Joe Weisenthal at Bloomberg)
This data is only available back to 1994, so there is only data for three recessions.
In February, the number of permanent job losers was mostly unchanged at 3.497 million from 3.503 million in January.
Prime (25 to 54 Years Old) Participation
 Since the overall participation rate has declined due to cyclical (recession) and demographic (aging population, younger people staying in school) reasons, here is the employment-population ratio for the key working age group: 25 to 54 years old.
The prime working age will be key in the eventual recovery.
The 25 to 54 participation rate was unchanged in February at 81.1% from 81.1% in January, and the 25 to 54 employment population ratio increased to 76.5% from 76.4% in January.
Part Time for Economic Reasons
 From the BLS report:
These workers are included in the alternate measure of labor underutilization (U-6) that was unchanged at 11.1% in February. This is down from the record high in April 22.9% for this measure since 1994.
Unemployed over 26 Weeks
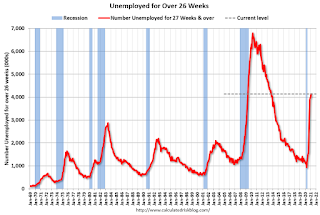 This graph shows the number of workers unemployed for 27 weeks or more.
According to the BLS, there are 4.148 million workers who have been unemployed for more than 26 weeks and still want a job.
This does not include all the people that left the labor force. This will be a key measure to follow during the recovery.
Summary:
The headline monthly jobs number was well above expectations, and the previous two months were revised up 38,000 combined. The headline unemployment rate declined to 6.2%.
Earlier: February Employment Report: 379 Thousand Jobs, 6.2% Unemployment Rate
In February, the year-over-year employment change was minus 9.475 million jobs. This will turn positive in April due to the sharp jobs losses in April 2020.
Permanent Job Losers
 Click on graph for larger image.
This graph shows permanent job losers as a percent of the pre-recession peak in employment through the December report. (ht Joe Weisenthal at Bloomberg)
This data is only available back to 1994, so there is only data for three recessions.
In February, the number of permanent job losers was mostly unchanged at 3.497 million from 3.503 million in January.
Prime (25 to 54 Years Old) Participation
 Since the overall participation rate has declined due to cyclical (recession) and demographic (aging population, younger people staying in school) reasons, here is the employment-population ratio for the key working age group: 25 to 54 years old.
The prime working age will be key in the eventual recovery.
The 25 to 54 participation rate was unchanged in February at 81.1% from 81.1% in January, and the 25 to 54 employment population ratio increased to 76.5% from 76.4% in January.
Part Time for Economic Reasons
 From the BLS report:
"The number of persons employed part time for economic reasons, at 6.1 million, changed little in February but is up by 1.7 million over the year. These individuals, who would have preferred full-time employment, were working part time because their hours had been reduced or they were unable to find full-time jobs."The number of persons working part time for economic reasons increased in February to 6.088 million from 5.954 million in January.
These workers are included in the alternate measure of labor underutilization (U-6) that was unchanged at 11.1% in February. This is down from the record high in April 22.9% for this measure since 1994.
Unemployed over 26 Weeks
 This graph shows the number of workers unemployed for 27 weeks or more.
 According to the BLS, there are 4.148 million workers who have been unemployed for more than 26 weeks and still want a job.
This does not include all the people that left the labor force. This will be a key measure to follow during the recovery.
Summary:
The headline monthly jobs number was well above expectations, and the previous two months were revised up 38,000 combined. The headline unemployment rate declined to 6.2%.
Overall, this was a positive report, but the real recovery will not start until the virus is suppressed. There are still 9.5 million fewer jobs than in February 2020, and 3.5 million people have lost jobs permanently.
February Employment Report: 379 Thousand Jobs, 6.2% Unemployment Rate
by Calculated Risk on 3/05/2021 08:44:00 AM
From the BLS:
Total nonfarm payroll employment rose by 379,000 in February, and the unemployment rate was little changed at 6.2 percent, the U.S. Bureau of Labor Statistics reported today. The labor market continued to reflect the impact of the coronavirus (COVID-19) pandemic. In February, most of the job gains occurred in leisure and hospitality, with smaller gains in temporary help services, health care and social assistance, retail trade, and manufacturing. Employment declined in state and local government education, construction, and mining.
...
The change in total nonfarm payroll employment for December was revised down by 79,000, from -227,000 to -306,000, and the change for January was revised up by 117,000, from +49,000 to +166,000. With these revisions, employment in December and January combined was 38,000 higher than previously reported.
emphasis added
 Click on graph for larger image.
The first graph shows the year-over-year change in total non-farm employment since 1968.
In February, the year-over-year change was negative 9.475 million jobs.
Total payrolls increased by 379 thousand in February. Private payrolls increased by 465 thousand.
Payrolls for December and January were revised up 38 thousand, combined.
The second graph shows the job losses from the start of the employment recession, in percentage terms.The current employment recession was by far the worst recession since WWII in percentage terms, and is still at the worst of the "Great Recession".
The third graph shows the employment population ratio and the participation rate.
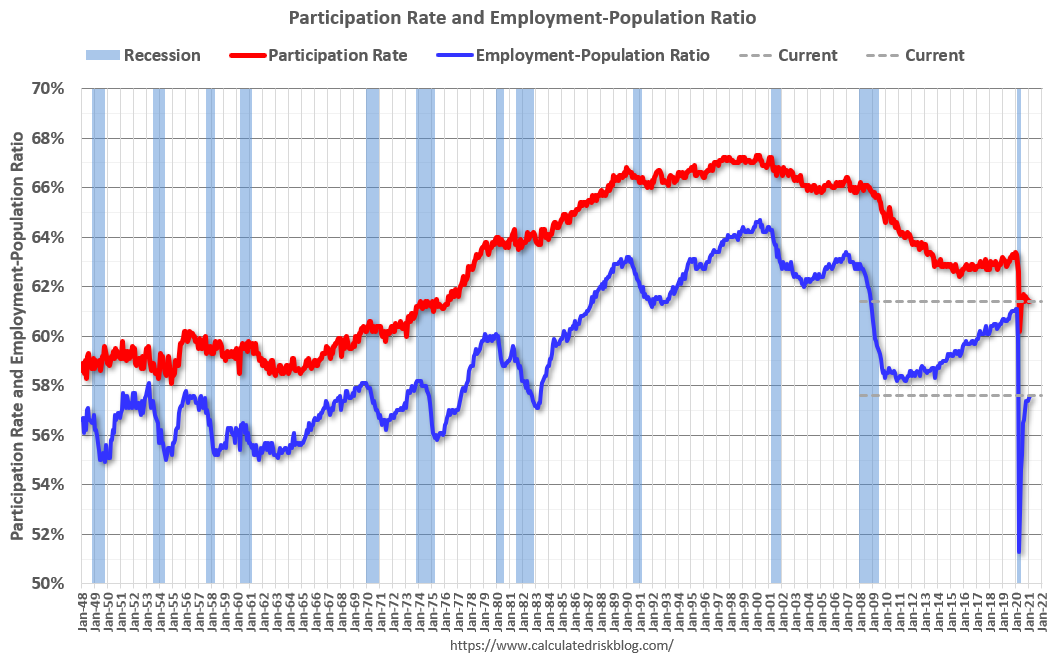 The Labor Force Participation Rate was unchanged at 61.4% in February. This is the percentage of the working age population in the labor force.
 The Employment-Population ratio increased to 57.6% (black line).
I'll post the 25 to 54 age group employment-population ratio graph later.
 The fourth graph shows the unemployment rate.
 The unemployment rate decreased in February to 6.2%.
This was well above consensus expectations, and December and January were revised up by 38,000 combined.
I'll have more later ...


