 RSS Feed
 by Calculated Risk on 2/24/2021 09:27:00 PM
Wednesday, February 24, 2021
Thursday: GDP, Unemployment Claims, Pending Home Sales
Thursday:
• At 8:30 AM ET, The initial weekly unemployment claims report will be released. The consensus is for a decrease to 845 thousand from 861 thousand last week.
• Also at 8:30 AM, Gross Domestic Product, 4th quarter 2020 (Second estimate). The consensus is that real GDP increased 4.1% annualized in Q4, up from the advance estimate of 4.0%.
• Also at 8:30 AM, Durable Goods Orders for January from the Census Bureau. The consensus is for a 1.1% decrease in durable goods orders.
• At 10:00 AM, Pending Home Sales Index for January. The consensus is for a 0.1% decrease in the index.
• At 11:00 AM, the Kansas City Fed manufacturing survey for February. This is the last of regional manufacturing surveys for February.
February 24 COVID-19 Test Results and Vaccinations
by Calculated Risk on 2/24/2021 07:03:00 PM
SPECIAL NOTE: The Covid Tracking Project will end daily updates on March 7th.
From Bloomberg on vaccinations as of Feb 24th.
"In the U.S., more Americans have now received at least one dose than have tested positive for the virus since the pandemic began. So far, 65 million doses have been given. In the last week, an average of 1.28 million doses per day were administered."Here is the CDC COVID Data Tracker. This site has data on vaccinations, cases and more.
The US is averaged 1.4 million tests per day over the last week. The percent positive over the last 7 days was 4.8%.
Based on the experience of other countries, for adequate test-and-trace (and isolation) to reduce infections, the percent positive needs to below 1%, so the US has far too many daily cases - and percent positive - to do effective test-and-trace.
There were 1,464,714 test results reported over the last 24 hours.
There were 73,258 positive tests.
Almost 63,000 US deaths have been reported in February. See the graph on US Daily Deaths here.
This data is from the COVID Tracking Project.
And check out COVID Act Now to see how each state is doing. (updated link to new site)
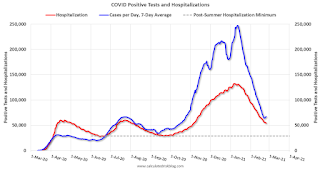 Click on graph for larger image.
This graph shows the 7 day average of positive tests reported and daily hospitalizations.
The dashed line is the post-summer surge low for hospitalizations.
AIA: "Architecture Billings continue to contract" in January
by Calculated Risk on 2/24/2021 02:09:00 PM
Note: This index is a leading indicator primarily for new Commercial Real Estate (CRE) investment.
From the AIA: Architectural billings continue to contract in 2021
A slight improvement in business conditions has led to fewer architecture firms reporting declining billings, according to a new report today from The American Institute of Architects (AIA).
AIA’s Architecture Billings Index (ABI) score for January was 44.9 compared to 42.3 in December (any score below 50 indicates a decline in firm billings). Last month’s score indicates overall revenue at U.S architecture firms continued to decline from December to January, however, the pace of decline slowed. Inquiries into new projects during January grew for the second month in a row, with a score of 56.8 compared to 51.7 in December. The value of new design contracts also reflected an easing in the pace of decline, rising to a score of 48.8 in January from 47.0 the previous month.
“The broader economy entered a soft spot during the fourth quarter of last year, and business conditions at design firms have reflected this general slowdown,” said AIA Chief Economist, Kermit Baker, Hon. AIA, PhD. “While federal stimulus and the increasing pace of vaccinations may begin to accelerate progress in the coming months, the year has gotten off to a slow start, with architecture firms in all regions of the country and in all specializations reporting continued declines in project billings.”
...
• Regional averages: South (47.4); West (42.8); Midwest (42.2); Northeast (41.9)
• Sector index breakdown: mixed practice (47.9); multi-family residential (44.4); commercial/industrial (44.3); institutional (39.9)
emphasis added
 Click on graph for larger image.
This graph shows the Architecture Billings Index since 1996. The index was at 44.9 in January, up from 42.3 in December. Anything below 50 indicates contraction in demand for architects' services.
Note: This includes commercial and industrial facilities like hotels and office buildings, multi-family residential, as well as schools, hospitals and other institutions.
This index has been below 50 for eleven consecutive months. This represents a significant decrease in design services, and suggests a decline in CRE investment through most of 2021 (This usually leads CRE investment by 9 to 12 months).
This weakness is not surprising since certain segments of CRE are struggling, especially offices and retail.
Black Knight: National Mortgage Delinquency Rate Decreased in January
by Calculated Risk on 2/24/2021 12:51:00 PM
Note: Loans in forbearance are counted as delinquent in this survey, but those loans are not reported as delinquent to the credit bureaus.
From Black Knight: Black Knight’s First Look: Mortgage Delinquency Rate Falls Below 6% for First Time in Nearly a Year, Yet 2.1M Homeowners Remain Seriously Delinquent
• The national mortgage delinquency rate fell to 5.9% in January, dropping below 6% for the first time since March 2020According to Black Knight's First Look report, the percent of loans delinquent decreased 3.8% in January compared to December, and increased 82% year-over-year.
• January’s improvement among overall delinquencies as well as seriously past due mortgages was nearly identical to the average monthly improvement seen during the recovery to date
• While delinquencies continue to improve slowly and steadily, some 2.1 million homeowners remain 90 or more days past due but not yet in foreclosure – still five times pre-pandemic levels
• Recent forbearance and foreclosure moratorium extensions have reduced near-term risk, but at the same time may have the effect of extending the length of the recovery period
• At the current rate of improvement, 1.8 million mortgages will still be seriously delinquent at the end of June when foreclosure moratoriums on government-backed loans are currently slated to lift
• With widespread moratoriums still in place, both foreclosure starts and sales (completions) remained near record lows in January
• Prepayment activity fell by 17% month-over-month in January but remains 86% above last year’s levels
emphasis added
The percent of loans in the foreclosure process decreased 3.9% in December and were down 31% over the last year.
Black Knight reported the U.S. mortgage delinquency rate (loans 30 or more days past due, but not in foreclosure) was 5.85% in January, down from 6.08% in December.
The percent of loans in the foreclosure process decreased in January to 0.32%, from 0.33% in December.
The number of delinquent properties, but not in foreclosure, is up 1,425,000 properties year-over-year, and the number of properties in the foreclosure process is down 75,000 properties year-over-year.
| Black Knight: Percent Loans Delinquent and in Foreclosure Process | ||||
|---|---|---|---|---|
| Jan 2021 | Dec 2020 | Jan 2020 | Jan 2019 | |
| Delinquent | 5.85% | 6.08% | 3.22% | 3.75% |
| In Foreclosure | 0.32% | 0.33% | 0.46% | 0.51% |
| Number of properties: | ||||
| Number of properties that are delinquent, but not in foreclosure: | 3,130,000 | 3,251,000 | 1,705,000 | 1,945,000 |
| Number of properties in foreclosure pre-sale inventory: | 171,000 | 178,000 | 246,000 | 265,000 |
| Total Properties | 3,301,000 | 3,429,000 | 1,951,000 | 2,210,000 |
A few Comments on January New Home Sales
by Calculated Risk on 2/24/2021 10:47:00 AM
New home sales for January were reported at 923,000 on a seasonally adjusted annual rate basis (SAAR). Sales for the previous three months were revised up.
This was well above consensus expectations for January. Clearly low mortgages rates, low existing home supply, and favorable demographics (something I wrote about many times over the last decade) have boosted sales. A surging stock market has probably helped new home sales too.
Another factor in the strong headline sales rate, over the second half of 2020, was the delay in the selling season. Usually the strongest sales are in the March to June time frame, but last year the strongest sales months were later in the year - so the usual seasonal factors boosted sales in late Summer, Fall in 2020.
Earlier: New Home Sales increase to 923,000 Annual Rate in January.
 Click on graph for larger image.
This graph shows new home sales for 2020 and 2021 by month (Seasonally Adjusted Annual Rate).
The year-over-year comparisons are easy in early 2021 - especially in March and April.
However, sales will likely be down year-over-year in August through October - since the selling season was delayed in 2020.
And on inventory: note that completed inventory is near record lows, but inventory under construction has closer to normal.
 On inventory, according to the Census Bureau:
"A house is considered for sale when a permit to build has been issued in permit-issuing places or work has begun on the footings or foundation in nonpermit areas and a sales contract has not been signed nor a deposit accepted."Starting in 1973 the Census Bureau broke this down into three categories: Not Started, Under Construction, and Completed.
This graph shows the months of supply by stage of construction..
The inventory of completed homes for sale was at 42 thousand in January, just above the record low of 37 thousand in 2013. That is about 0.5 months of completed supply.
The inventory of new homes under construction, and not started, is about 3.5 months - just a little below normal.
New Home Sales increase to 923,000 Annual Rate in January
by Calculated Risk on 2/24/2021 10:11:00 AM
The Census Bureau reports New Home Sales in January were at a seasonally adjusted annual rate (SAAR) of 923 thousand.
The previous three months were revised up.
Sales of new single-family houses in January 2021 were at a seasonally adjusted annual rate of 923,000, according to estimates released jointly today by the U.S. Census Bureau and the Department of Housing and Urban Development. This is 4.3 percent above the revised December rate of 885,000 and is 19.3 percent above the January 2020 estimate of 774,000.
emphasis added
 Click on graph for larger image.
The first graph shows New Home Sales vs. recessions since 1963. The dashed line is the current sales rate.
The last eight months saw the highest sales rates since 2006. This was strong year-over-year growth.
The second graph shows New Home Months of Supply.
 The months of supply decreased in January to 4.0 months from 4.1 months in December.
 The all time record high was 12.1 months of supply in January 2009. The all time record low is 3.5 months, most recently in October 2020.
This is at the low end of the normal range (about 4 to 6 months supply is normal).
"The seasonally-adjusted estimate of new houses for sale at the end of January was 307,000. This represents a supply of 4.0 months at the current sales rate. "
 On inventory, according to the Census Bureau:
 "A house is considered for sale when a permit to build has been issued in permit-issuing places or work has begun on the footings or foundation in nonpermit areas and a sales contract has not been signed nor a deposit accepted."Starting in 1973 the Census Bureau broke this down into three categories: Not Started, Under Construction, and Completed.
The third graph shows the three categories of inventory starting in 1973.
The inventory of completed homes for sale is low, and the combined total of completed and under construction is a little lower than normal.
 The last graph shows sales NSA (monthly sales, not seasonally adjusted annual rate).
In January 2021 (red column), 70 thousand new homes were sold (NSA). Last year, 59 thousand homes were sold in January
The all time high for January was 92 thousand in 2005, and the all time low for January was 21 thousand in 2011.
This was well above expectations, and sales in the three previous months were revised up. I'll have more later today.
MBA: Mortgage Applications Decrease in Latest Weekly Survey
by Calculated Risk on 2/24/2021 07:00:00 AM
From the MBA: Mortgage Applications Decrease in Latest MBA Weekly Survey
Mortgage applications decreased 11.4 percent from one week earlier, according to data from the Mortgage Bankers Association’s (MBA) Weekly Mortgage Applications Survey for the week ending February 19, 2021.
... The Refinance Index decreased 11 percent from the previous week and was 50 percent higher than the same week one year ago. The seasonally adjusted Purchase Index decreased 12 percent from one week earlier. The unadjusted Purchase Index decreased 8 percent compared with the previous week and was 7 percent higher than the same week one year ago.
“Mortgage rates have increased in six of the last eight weeks, with the benchmark 30-year fixed rate last week climbing above 3 percent to its highest level since September 2020. As a result of these higher rates, overall refinance activity fell 11 percent to its lowest level since December 2020, but remained 50 percent higher than a year ago,” said Joel Kan, MBA’s Associate Vice President of Economic and Industry Forecasting. “Additionally, the severe winter weather in Texas affected many households and lenders, causing more than a 40 percent drop in both purchase and refinance applications in the state last week.”
Added Kan, “The housing market in most of the country remains strong, with activity last week 7 percent higher than a year ago. The average loan size of purchase applications increased to a record $418,000, in line with the accelerating home-price growth caused by very low inventory levels.”
...
The average contract interest rate for 30-year fixed-rate mortgages with conforming loan balances ($548,250 or less) increased to 3.08 percent from 2.98 percent, with points increasing to 0.46 from 0.43 (including the origination fee) for 80 percent loan-to-value ratio (LTV) loans. T
emphasis added
 Click on graph for larger image.
The first graph shows the refinance index since 1990.
The refinance index has been volatile recently depending on rates.
With near record low rates, the index remains up significantly from last year (but will be down year-over-year in early March - since rates fell sharply at the beginning of the pandemic).
 The second graph shows the MBA mortgage purchase index
According to the MBA, purchase activity is up 7% year-over-year unadjusted.
Note: Red is a four-week average (blue is weekly).
Tuesday, February 23, 2021
Wednesday: New Home Sales, Fed Chair Powell
by Calculated Risk on 2/23/2021 09:08:00 PM
Wednesday:
• At 7:00 AM ET, The Mortgage Bankers Association (MBA) will release the results for the mortgage purchase applications index.
• At 10:00 AM, New Home Sales for January from the Census Bureau. The consensus is for 855 thousand SAAR, up from 842 thousand in December.
• Also at 10:00 AM, Testimony, Fed Chair Jerome Powell, Semiannual Monetary Policy Report to the Congress, Before the Committee on Financial Services, U.S. House of Representatives
• During the day, The AIA's Architecture Billings Index for January (a leading indicator for commercial real estate).
February 23 COVID-19 Test Results and Vaccinations
by Calculated Risk on 2/23/2021 07:04:00 PM
SPECIAL NOTE: The Covid Tracking Project will end daily updates on March 7th.
From Bloomberg on vaccinations as of Feb 23rd.
"In the U.S., more Americans have now received at least one dose than have tested positive for the virus since the pandemic began. So far, 65 million doses have been given. In the last week, an average of 1.28 million doses per day were administered."Here is the CDC COVID Data Tracker. This site has data on vaccinations, cases and more.
The US is averaged 1.35 million tests per day over the last week. The percent positive over the last 7 days was 4.8%.
Based on the experience of other countries, for adequate test-and-trace (and isolation) to reduce infections, the percent positive needs to below 1%, so the US has far too many daily cases - and percent positive - to do effective test-and-trace.
There were 1,202,838 test results reported over the last 24 hours.
There were 67,879 positive tests.
Over 60,000 US deaths have been reported in February. See the graph on US Daily Deaths here.
This data is from the COVID Tracking Project.
And check out COVID Act Now to see how each state is doing. (updated link to new site)
 Click on graph for larger image.
This graph shows the 7 day average of positive tests reported and daily hospitalizations.
The dashed line is the post-summer surge low for hospitalizations.
Zillow Case-Shiller House Price Forecast: "More strong growth in the months ahead", 10.9% YoY in January
by Calculated Risk on 2/23/2021 04:56:00 PM
The Case-Shiller house price indexes for December were released today. Zillow forecasts Case-Shiller a month early, and I like to check the Zillow forecasts since they have been pretty close.
From Matthew Speakman at Zillow: December 2020 Case-Shiller Results & January Forecast: An Exclamation Point on 2020
Adding an exclamation point to a year unlike any other, home prices continued their powerful surge higher in December, setting the stage for more strong growth in the months ahead.
...
The factors that have, for months, stoked competition for homes remained firmly in place in December. A wave of eager buyers – many of whom are looking to enter the market for the first time – sought to capitalize on record-low mortgage rates and snap up the relatively few homes available for sale, leading homes to fly off the shelves and prices to continue to grow. In some major markets, homes are going under contract more than a month faster than they were this time last year. This forces would-be buyers to move very quickly to put an offer in on a home they desire, increases the likelihood that multiple offers will be fielded by the seller and ultimately places more upward pressure on prices. Looking ahead, with mortgage rates remaining relatively low and the wave of eager buyers continuing to swell, it’s unlikely that this competition for housing, and subsequent strong price appreciation, will meaningfully abate in the near future.
Monthly growth in January as reported by Case-Shiller is expected to slow slightly from December in all three main indices, while annual growth is expected to accelerate across the board. S&P Dow Jones Indices is expected to release data for the January S&P CoreLogic Case-Shiller Indices on Tuesday, March 30.
emphasis added
 The Zillow forecast is for the year-over-year change for the Case-Shiller National index to be at 10.9% in January, up from 10.4% in December.
 The Zillow forecast is for the 20-City index to be up 10.7% YoY in January from 10.1% in December, and for the 10-City index to increase to be up 10.4% YoY compared to 9.8% YoY in December.


