 RSS Feed
 by Calculated Risk on 1/12/2021 10:06:00 AM
Tuesday, January 12, 2021
BLS: Job Openings "Little Changed" at 6.5 Million in November
From the BLS: Job Openings and Labor Turnover Summary
The number of job openings was little changed at 6.5 million on the last business day of November, the U.S. Bureau of Labor Statistics reported today. Hires were little changed at 6.0 million while total separations increased to 5.4 million. Within separations, the quits rate was unchanged at 2.2 percent while the layoffs and discharges rate increased to 1.4 percent.The following graph shows job openings (yellow line), hires (dark blue), Layoff, Discharges and other (red column), and Quits (light blue column) from the JOLTS.
emphasis added
This series started in December 2000.
Note: The difference between JOLTS hires and separations is similar to the CES (payroll survey) net jobs headline numbers. This report is for November, the most recent employment report was for December.
 Click on graph for larger image.
Note that hires (dark blue) and total separations (red and light blue columns stacked) are usually pretty close each month. This is a measure of labor market turnover. When the blue line is above the two stacked columns, the economy is adding net jobs - when it is below the columns, the economy is losing jobs.
The huge spikes in layoffs and discharges in March and April 2020 are labeled, but off the chart to better show the usual data.
Jobs openings decreased in November to 6.527 million from 6.632 million in October.
The number of job openings (yellow) were down 3.9% year-over-year. Note that job openings were declining a year ago prior to the pandemic.
Quits were down 10.5% year-over-year. These are voluntary separations. (see light blue columns at bottom of graph for trend for "quits").
Small Business Optimism Decreased in December
by Calculated Risk on 1/12/2021 08:34:00 AM
Most of this survey is noise, but sometimes there is some information.
From the National Federation of Independent Business (NFIB): December 2020 Report
The Optimism Index declined to 95.9 in December, down 5.5. points from November. Nine of the 10 Index components declined and one improved. The NFIB Uncertainty Index decreased 8 points to 82. Owners expecting better business conditions over the next six months declined 24 points to a net negative 16 percent. The percent of owners thinking it’s a good time to expand decreased 4 points to 8 percent. Sales expectations over the next three months declined 14 points to a net negative 4 percent.
.
Covid-19 is spreading at record rates and hospitals are at capacity in many states. Several vaccines were proven effective in trials, approved for emergency use, and now being distributed. But business restrictions and consumer spending shifts are still firmly in place and will be until the spread of Covid-19 is largely curbed.
emphasis added
 Click on graph for larger image.
This graph shows the small business optimism index since 1986.
The index declined in December.
Monday, January 11, 2021
Tuesday: Job Openings
by Calculated Risk on 1/11/2021 09:23:00 PM
From Matthew Graham at Mortgage News Daily: Rates Rising at Fastest Pace in Months
Mortgage rates are coming off a rough week--the roughest, in fact, since June 2020 by some measures. That's the last time rates rose this quickly for market-driven reasons. There were a few instances of bigger moves in Aug/Sept as the new refinance fee was announced, delayed, and ultimately implemented. Either way, things aren't great right now, relatively speaking.Tuesday:
The "relative" qualification is important considering this abrupt move higher has yet to threaten to take the average top tier 30yr fixed quote above 3%--far from it, in fact. Most lenders can still offer 2.875% or better on refis and 2.625% or better on purchases. This assumes an ideal scenario with 20%+ equity, strong credit, etc.
emphasis added
• At 6:00 AM ET, NFIB Small Business Optimism Index for December.
• At 10:00 AM, Job Openings and Labor Turnover Survey for November from the BLS.
January 11 COVID-19 Test Results; Record 7-Day Cases and Deaths
by Calculated Risk on 1/11/2021 07:18:00 PM
Note: I'm looking forward to not posting this data in a few months.
The US is now averaging close to 2 million tests per day. Based on the experience of other countries, for adequate test-and-trace (and isolation) to reduce infections, the percent positive needs to be under 5% (probably close to 1%), so the US has far too many daily cases - and percent positive - to do effective test-and-trace.
There were 1,897,059 test results reported over the last 24 hours.
There were 193,857 positive tests.
Almost 31,000 US deaths have been reported so far in January. See the graph on US Daily Deaths here.
 Click on graph for larger image.
This data is from the COVID Tracking Project.
The percent positive over the last 24 hours was 10.2% (red line is 7 day average). The percent positive is calculated by dividing positive results by total tests (including pending).
And check out COVID Act Now to see how each state is doing. (updated link to new site)
 The second graph shows the 7 day average of positive tests reported and daily hospitalizations.
• Record 7-Day Cases
• Record 7-Day Deaths
MBA Survey: "Share of Mortgage Loans in Forbearance Decreases to 5.46%"
by Calculated Risk on 1/11/2021 04:00:00 PM
Note: This is as of January 3rd.
From the MBA: Share of Mortgage Loans in Forbearance Decreases to 5.46%
The Mortgage Bankers Association’s (MBA) latest Forbearance and Call Volume Survey revealed that the total number of loans now in forbearance decreased from 5.53% of servicers’ portfolio volume in the prior week to 5.46% as of January 3, 2021. According to MBA’s estimate, 2.7 million homeowners are in forbearance plans.
...
"The share of loans in forbearance slightly declined for each investor category entering the new year, remaining within the narrow range observed for the last two months,” said Mike Fratantoni, MBA’s Senior Vice President and Chief Economist. “The data show that those homeowners who remain in forbearance are more likely to be in distress, with fewer continuing to make any payments and fewer exiting forbearance each month. Those borrowers who do exit are also more likely to require a modification to their ongoing repayment plans.”
Fratantoni continued, “Surging COVID-19 cases caused economic activity to stall in December, with a monthly job loss for the first time since April, and with those jobs mostly concentrated in the leisure and hospitality sector. We expect that this slowdown will prevent any rapid improvement in the forbearance numbers over the next few months.”
emphasis added
 Click on graph for larger image.
This graph shows the percent of portfolio in forbearance by investor type over time. Most of the increase was in late March and early April, and has generally been trending down.
The MBA notes: "Total weekly forbearance requests as a percent of servicing portfolio volume (#) increased relative to the prior week from 0.06% to 0.07%."
Sacramento Housing in December: Sales increase 23% YoY, Active Inventory down 44% YoY
by Calculated Risk on 1/11/2021 03:06:00 PM
Note that December sales are for contracts typically signed in October and November.
From SacRealtor.org: December sales volume up 23% annually, inventory at .5 months
December ended with 1,528 sales, up 1.1% from the 1,511 sales in November. Compared to one year ago (1,244), the current figure is up 22.8%.
...
The Active Listing Inventory decreased 23.4% from November to December, from 959 units to 735 units.
Compared with December 2019 (1,315), inventory is down 44.1%. The Months of Inventory dropped from .6 Months to .5 Months. This figure represents the amount of time (in months) it would take for the current rate of sales to deplete the total active listing inventory. The chart below reflects the Months of Inventory in each price range.
...
The Median DOM (days on market) remained at 7 and the Average DOM remained at 16. “Days on market” represents the days between the initial listing of the home as “active” and the day it goes “pending.” Of the 1,528 sales this month, 87% (1,329) were on the market for 30 days or less and 95.8% (1,463) were on the market for 60 days or less.
emphasis added
Housing Inventory Weekly Update: Starting the Year at Record Lows
by Calculated Risk on 1/11/2021 12:59:00 PM
One of the key questions for 2021 is: Will inventory increase as the pandemic subsides, or will inventory decrease further in 2021?
Tracking inventory will be very important this year, and I'll be using some weekly sources.
 Click on graph for larger image in graph gallery.
This inventory graph is courtesy of Altos Research.
As of January 8th, inventory is at 397 thousand (7 day average), compared to 738 thousand the same week a year ago. That is a decline of 46%.
Mike Simonsen discusses this data regularly on Youtube.
Mike Simonsen discusses this data regularly on Youtube.
Seattle Real Estate in December: Sales up 31% YoY, Inventory UP 39% YoY
by Calculated Risk on 1/11/2021 10:55:00 AM
Note: Inventory is down sharply in the Northwest almost everywhere except Seattle. And inventory is low in Seattle too, but was even lower a year ago.
The Northwest Multiple Listing Service reported “Extraordinary market conditions” sustain strong home sales
around Washington state during holidays
“Insatiable buyer demand” is keeping inventory scarce as house hunters try to outmaneuver and outbid each other, according to reports from Northwest Multiple Listing Service (NWMLS). Its statistical summary for December showed strong activity throughout the holiday season with double-digit increases in new listings, pending sales, closed sales, and prices.The press release is for the Northwest MLS area. There were 9,008 closed sales in December 2020, up 27.0% from 7,093 sales in December 2019.
...
“As more people are working from home, they are also purchasing properties further afield from Seattle,” observed James Young, director of the Washington Center for Real Estate Research at the University of Washington. He singled out Chelan, Clallam, Grays Harbor, Kittitas, and Mason as counties that had year-over-year price growth of 20% or more. The MLS report also shows Pacific and Whatcom counties with 20% or higher price gains.
“The velocity of the December market is a harbinger of the 2021 market as tight listing inventory, low interest rates, and high buyer demand continue to drive momentum,” remarked NWMLS director John Deely, executive vice president, operations at Coldwell Banker Bain. “Every market serviced by NWMLS was trending below December 2019 for total active inventory,” he noted. “In King County, despite a nearly 62% increase in new listings compared to a year ago, the insatiable buyer demand quickly absorbed available properties,” he added.
emphasis added
In King County, sales were up 28% year-over-year, and active inventory was down 14% year-over-year.
In Seattle, sales were up 30.7% year-over-year, and inventory was up 39.5% year-over-year.. This puts the months-of-supply in Seattle at just 1.2 months.
Seven High Frequency Indicators for the Economy
by Calculated Risk on 1/11/2021 08:17:00 AM
These indicators are mostly for travel and entertainment. It will interesting to watch these sectors recover as the vaccine is distributed.
IMPORTANT: Be safe now - if all goes well, we could all be vaccinated by Q2 2021.
----- Airlines: Transportation Security Administration -----
The TSA is providing daily travel numbers.
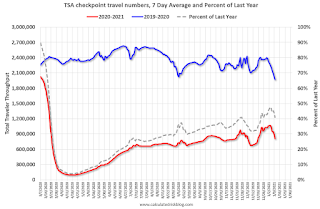 Click on graph for larger image.
This data shows the seven day average of daily total traveler throughput from the TSA for 2019-2020 (Blue) and 2020-2021 (Red).
The dashed line is the percent of last year for the seven day average.
This data is as of January 10th.
The seven day average is down 59.0% from last year (41.0% of last year). (Dashed line)
There has been a slow increase from the bottom, with ups and downs due to the Thanksgiving and Christmas holidays.
----- Restaurants: OpenTable -----
The second graph shows the 7 day average of the year-over-year change in diners as tabulated by OpenTable for the US and several selected cities.
 Thanks to OpenTable for providing this restaurant data:
This data is updated through January 9, 2020.
This data is "a sample of restaurants on the OpenTable network across all channels: online reservations, phone reservations, and walk-ins. For year-over-year comparisons by day, we compare to the same day of the week from the same week in the previous year."
Note that this data is for "only the restaurants that have chosen to reopen in a given market". Since some restaurants have not reopened, the actual year-over-year decline is worse than shown.
Dining picked up during the holidays. Note that dining is generally lower in the northern states - Illinois, Pennsylvania, and New York. Note that California dining is off sharply with the orders to close.
----- Movie Tickets: Box Office Mojo -----
 This data shows domestic box office for each week (red) and the maximum and minimum for the previous four years. Blue is 2020 and red is 2021. Data is from BoxOfficeMojo through January 7th.
Note that the data is usually noisy week-to-week and depends on when blockbusters are released.
Movie ticket sales were at $9 million last week (compared to usually around $200 million per week at this time of year).
----- Hotel Occupancy: STR -----
 This graph shows the seasonal pattern for the hotel occupancy rate using the four week average.
The red line is for 2021, black is 2020, blue is the median, and dashed light blue is for 2009 (the worst year since the Great Depression for hotels - before 2020).
This data is through January 2nd. Hotel occupancy is currently down 17.2% year-over-year. Seasonally we'd expect business travel would start to pick up in the new year, but there will probably not be much pickup early this year.
Notes: Y-axis doesn't start at zero to better show the seasonal change.
----- Gasoline Supplied: Energy Information Administration -----
 This graph, based on weekly data from the U.S. Energy Information Administration (EIA), shows gasoline supplied compared to the same week of 2019.
At one point, gasoline supplied was off almost 50% YoY.
As of January 1st, gasoline supplied was off about 14.8% (about 85.2% of the same week in 2019).
Note: People driving instead of flying might have boosted gasoline consumption over the summer.
----- Transit: Apple Mobility -----
This graph is from Apple mobility. From Apple: "This data is generated by counting the number of requests made to Apple Maps for directions in select countries/regions, sub-regions, and cities." This is just a general guide - people that regularly commute probably don't ask for directions.
There is also some great data on mobility from the Dallas Fed Mobility and Engagement Index. However the index is set "relative to its weekday-specific average over January–February", and is not seasonally adjusted, so we can't tell if an increase in mobility is due to recovery or just the normal increase in the Spring and Summer.
 This data is through January 9th for the United States and several selected cities.
The graph is the running 7 day average to remove the impact of weekends.
IMPORTANT: All data is relative to January 13, 2020. This data is NOT Seasonally Adjusted. People walk and drive more when the weather is nice, so I'm just using the transit data.
According to the Apple data directions requests, public transit in the 7 day average for the US is at 45% of the January level. It is at 34% in Chicago, and 53% in Houston - and mostly trending up over the last couple of week.
----- New York City Subway Usage -----
Here is some interesting data on New York subway usage (HT BR).
 This graph is from Todd W Schneider. This is daily data since early 2020.
This data is through Friday, January 8th.
Schneider has graphs for each borough, and links to all the data sources.
He notes: "Data updates weekly from the MTA’s public turnstile data, usually on Saturday mornings".
The TSA is providing daily travel numbers.
 Click on graph for larger image.
This data shows the seven day average of daily total traveler throughput from the TSA for 2019-2020 (Blue) and 2020-2021 (Red).
The dashed line is the percent of last year for the seven day average.
This data is as of January 10th.
The seven day average is down 59.0% from last year (41.0% of last year). (Dashed line)
There has been a slow increase from the bottom, with ups and downs due to the Thanksgiving and Christmas holidays.
The second graph shows the 7 day average of the year-over-year change in diners as tabulated by OpenTable for the US and several selected cities.
 Thanks to OpenTable for providing this restaurant data:
This data is updated through January 9, 2020.
This data is "a sample of restaurants on the OpenTable network across all channels: online reservations, phone reservations, and walk-ins. For year-over-year comparisons by day, we compare to the same day of the week from the same week in the previous year."
Note that this data is for "only the restaurants that have chosen to reopen in a given market". Since some restaurants have not reopened, the actual year-over-year decline is worse than shown.
Dining picked up during the holidays. Note that dining is generally lower in the northern states - Illinois, Pennsylvania, and New York. Note that California dining is off sharply with the orders to close.
 This data shows domestic box office for each week (red) and the maximum and minimum for the previous four years. Blue is 2020 and red is 2021. Data is from BoxOfficeMojo through January 7th.
Note that the data is usually noisy week-to-week and depends on when blockbusters are released.
Movie ticket sales were at $9 million last week (compared to usually around $200 million per week at this time of year).
 This graph shows the seasonal pattern for the hotel occupancy rate using the four week average.
 The red line is for 2021, black is 2020, blue is the median, and dashed light blue is for 2009 (the worst year since the Great Depression for hotels - before 2020).
This data is through January 2nd. Hotel occupancy is currently down 17.2% year-over-year. Seasonally we'd expect business travel would start to pick up in the new year, but there will probably not be much pickup early this year.
Notes: Y-axis doesn't start at zero to better show the seasonal change.
 This graph, based on weekly data from the U.S. Energy Information Administration (EIA), shows gasoline supplied compared to the same week of 2019.
At one point, gasoline supplied was off almost 50% YoY.
As of January 1st, gasoline supplied was off about 14.8% (about 85.2% of the same week in 2019).
Note: People driving instead of flying might have boosted gasoline consumption over the summer.
This graph is from Apple mobility. From Apple: "This data is generated by counting the number of requests made to Apple Maps for directions in select countries/regions, sub-regions, and cities." This is just a general guide - people that regularly commute probably don't ask for directions.
There is also some great data on mobility from the Dallas Fed Mobility and Engagement Index. However the index is set "relative to its weekday-specific average over January–February", and is not seasonally adjusted, so we can't tell if an increase in mobility is due to recovery or just the normal increase in the Spring and Summer.
 This data is through January 9th for the United States and several selected cities.
The graph is the running 7 day average to remove the impact of weekends.
IMPORTANT: All data is relative to January 13, 2020. This data is NOT Seasonally Adjusted. People walk and drive more when the weather is nice, so I'm just using the transit data.
According to the Apple data directions requests, public transit in the 7 day average for the US is at 45% of the January level. It is at 34% in Chicago, and 53% in Houston - and mostly trending up over the last couple of week.
Here is some interesting data on New York subway usage (HT BR).
 This graph is from Todd W Schneider. This is daily data since early 2020.
This data is through Friday, January 8th.
Schneider has graphs for each borough, and links to all the data sources.
He notes: "Data updates weekly from the MTA’s public turnstile data, usually on Saturday mornings".
Sunday, January 10, 2021
Sunday Night Futures
by Calculated Risk on 1/10/2021 08:44:00 PM
Weekend:
• Schedule for Week of January 10, 2021
Monday:
• No major economic releases scheduled.
From CNBC: Pre-Market Data and Bloomberg futures S&P 500 are down 11 and DOW futures are down 80 (fair value).
Oil prices were up over the last week with WTI futures at $52.26 per barrel and Brent at $55.81 barrel. A year ago, WTI was at $59, and Brent was at $67 - so WTI oil prices are down about 15% year-over-year.
Here is a graph from Gasbuddy.com for nationwide gasoline prices. Nationally prices are at $2.32 per gallon. A year ago prices were at $2.59 per gallon, so gasoline prices are down $0.27 per gallon year-over-year.


