 RSS Feed
 by Calculated Risk on 12/03/2020 08:38:00 AM
Thursday, December 03, 2020
Weekly Initial Unemployment Claims decreased to 712,000
The DOL reported:
In the week ending November 28, the advance figure for seasonally adjusted initial claims was 712,000, a decrease of 75,000 from the previous week's revised level. The previous week's level was revised up by 9,000 from 778,000 to 787,000. The 4-week moving average was 739,500, a decrease of 11,250 from the previous week's revised average. The previous week's average was revised up by 2,250 from 748,500 to 750,750.This does not include the 288,701 initial claims for Pandemic Unemployment Assistance (PUA) that was down from 318,855 the previous week.
emphasis added
The following graph shows the 4-week moving average of weekly claims since 1971.
 Click on graph for larger image.
The dashed line on the graph is the current 4-week average. The four-week average of weekly unemployment claims increased to 739,500.
The previous week was revised up.
The second graph shows seasonally adjust continued claims since 1967 (lags initial by one week).
 At the worst of the Great Recession, continued claims peaked at 6.635 million, but then steadily declined.
Continued claims decreased to 5,520,000 (SA) from 6,089,000 (SA) last week and will likely stay at a high level until the crisis abates.
Note: There are an additional 8,869,502 receiving Pandemic Unemployment Assistance (PUA) that decreased from 9,208,570 the previous week (there are questions about these numbers). This is a special program for business owners, self-employed, independent contractors or gig workers not receiving other unemployment insurance.
An additional 4,569,016 are receiving Pandemic Emergency Unemployment Compensation (PEUC) that increased from 4,509,284 the previous week. These last two programs are set to expire on December 26th.
This was lower than expected.
Wednesday, December 02, 2020
Thursday: Unemployment Claims, ISM Services
by Calculated Risk on 12/02/2020 09:15:00 PM
From Matthew Graham at MortgageNewsDaily: Mortgage Rates Continue Defying Bond Market Weakness
Although it was the focus of yesterday's discussion, the ability of the mortgage market to hold steady in the face of bond market weakness continues to impress. ... Regardless of the movement, the average lender remains very close to all-time lows and well under 3% for most top tier conventional scenarios.Thursday:
• At 8:30 AM ET, The initial weekly unemployment claims report will be released. The consensus is for 825,000 initial claims, up from 778,000 last week.
• At 10:00 AM, the ISM Services Index for November.
December 2 COVID-19 Test Results; Over 100,000 Hospitalizations
by Calculated Risk on 12/02/2020 07:16:00 PM
Note: The data was distorted over the holiday weekend.
The US is now averaging over 1 million tests per day. Based on the experience of other countries, for adequate test-and-trace (and isolation) to reduce infections, the percent positive needs to be well under 5% (probably close to 1%), so the US still needs to increase the number of tests per day significantly (or take actions to push down the number of new infections).
There were 1,163,137 test results reported over the last 24 hours.
There were 195,695 positive tests.
Over 5,200 US deaths have been reported so far in December. See the graph on US Daily Deaths here.
 Click on graph for larger image.
This data is from the COVID Tracking Project.
The percent positive over the last 24 hours was 16.8% (red line is 7 day average). The percent positive is calculated by dividing positive results by the sum of negative and positive results (I don't include pending).
And check out COVID Exit Strategy to see how each state is doing.
 The second graph shows the 7 day average of positive tests reported and daily hospitalizations.
The dashed line is the previous hospitalization maximum.
Note that there were very few tests available in March and April, and many cases were missed, so the hospitalizations was higher relative to the 7-day average of positive tests in July.
• Record Hospitalizations (Over 100,000)
Fed's Beige Book: "modest or moderate" Growth in Economic Activity, Some Districts see "No growth"
by Calculated Risk on 12/02/2020 02:07:00 PM
Fed's Beige Book "This report was prepared at the Federal Reserve Bank of Philadelphia based on information collected on or before November 20, 2020."
Most Federal Reserve Districts have characterized economic expansion as modest or moderate since the prior Beige Book period. However, four Districts described little or no growth, and five narratives noted that activity remained below pre-pandemic levels for at least some sectors. Moreover, Philadelphia and three of the four Midwestern Districts observed that activity began to slow in early November as COVID-19 cases surged. Reports tended to indicate higher-than-average growth of manufacturing, distribution and logistics, homebuilding, and existing home sales, although not without disruptions. Banking contacts in numerous Districts reported some deterioration of loan portfolios, particularly for commercial lending into the retail and leisure and hospitality sectors. An increase in delinquencies in 2021 is more widely anticipated. Most Districts reported that firms' outlooks remained positive; however, optimism has waned--many contacts cited concerns over the recent pandemic wave, mandated restrictions (recent and prospective), and the looming expiration dates for unemployment benefits and for moratoriums on evictions and foreclosures.CR Note: The pandemic is depressing activity again. Also note the concern about some commercial lending.
...
Nearly all Districts reported that employment rose, but for most, the pace was slow, at best, and the recovery remained incomplete. Firms that were hiring continued to report difficulties in attracting and retaining workers. Many contacts noted that the sharp rise in COVID-19 cases had precipitated more school and plant closings and renewed fears of infection, which have further aggravated labor supply problems, including absenteeism and attrition. Providing for childcare and virtual schooling needs was widely cited as a significant and growing issue for the workforce, especially for women—prompting some firms to extend greater accommodations for flexible work schedules. In several Districts, firms feared that employment levels would fall over the winter before recovering further. Despite hiring difficulties, firms in most Districts reported that wages grew at a slight or modest pace overall. However, many noted greater pressure to raise rates for low-skilled workers, especially in outlying areas. Staffing firms described greater placement success with competitive rates, and one firm instituted a minimum wage rate for its industrial clients.
emphasis added
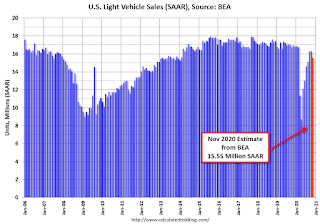
November Vehicles Sales decreased to 15.55 Million SAAR
by Calculated Risk on 12/02/2020 09:40:00 AM
The BEA released their estimate of light vehicle sales for November this morning. The BEA estimates sales of 15.55 million SAAR in November 2020 (Seasonally Adjusted Annual Rate), down 4.5% from the October sales rate, and down 8.4% from November 2019.
This was below the consensus estimate of 16.2 million SAAR.
 Click on graph for larger image.
This graph shows light vehicle sales since 2006 from the BEA (blue) and the BEA's estimate for November (red).
The impact of COVID-19 was significant, and April was the worst month.
Since April, sales have increased, but are still down 8.4% from last year.
The second graph shows light vehicle sales since the BEA started keeping data in 1967.
 Note: dashed line is current estimated sales rate of 15.55 million SAAR.
In 2019, there were 15.92 million light vehicle sales through November. In 2020, there have been 13.20 million sales. That puts sales-to-date down 17.1% in 2020 compared to the same period in 2019.
ADP: Private Employment increased 307,000 in November
by Calculated Risk on 12/02/2020 08:19:00 AM
Private sector employment increased by 307,000 jobs from October to November according to the Novembe ADP National Employment Report®. ... The report, which is derived from ADP’s actual payroll data, measures the change in total nonfarm private employment each month on a seasonally-adjusted basis.This was below the consensus forecast for 420 thousand private sector jobs added in the ADP report.
“While November saw employment gains, the pace continues to slow,” said Ahu Yildirmaz, vice president and co-head of the ADP Research Institute. “Job growth remained positive across all industries and sizes.”
emphasis added
The BLS report will be released Friday, and the consensus is for 500 thousand non-farm payroll jobs added in November. Of course the ADP report has not been very useful in predicting the BLS report.
MBA: Mortgage Applications Decrease in Latest Weekly Survey
by Calculated Risk on 12/02/2020 07:00:00 AM
From the MBA: Mortgage Applications Decrease in Latest MBA Weekly Survey
Mortgage applications decreased 0.6 percent from one week earlier, according to data from the Mortgage Bankers Association’s (MBA) Weekly Mortgage Applications Survey for the week ending November 27, 2020. This week’s results include an adjustment for the Thanksgiving holiday.
... The Refinance Index decreased 5 percent from the previous week and was 102 percent higher than the same week one year ago. The seasonally adjusted Purchase Index increased 9 percent from one week earlier. The unadjusted Purchase Index decreased 28 percent compared with the previous week and was 28 percent higher than the same week one year ago.
After adjusting for the Thanksgiving holiday, mortgage applications were mixed, with a jump in purchase applications and a decline in refinances. Purchase activity continued to show impressive year-over-year gains, with both the conventional and government segments of the market posting another week of growth,” said Joel Kan, MBA’s Associate Vice President of Economic and Industry Forecasting. “Purchase loan amounts continue to be significantly higher than their average over the past decade and hit $375,000 last week, the largest since the inception of MBA’s survey in 1990. Housing demand remains strong, and despite extremely tight inventory and rising prices, home sales are running at their strongest pace in over a decade.”
Added Kan, “The sustained period of low mortgage rates continues to spark borrower demand, and the mortgage industry is poised for its strongest year in originations since 2003. The ongoing refinance wave has been beneficial to homeowners looking to lower their monthly payments during these challenging economic times brought forth by the pandemic.”
...
The average contract interest rate for 30-year fixed-rate mortgages with conforming loan balances ($510,400 or less) remained unchanged at 2.92 percent, with points decreasing to 0.31 from 0.35 (including the origination fee) for 80 percent loan-to-value ratio (LTV) loans.
emphasis added
 Click on graph for larger image.
The first graph shows the refinance index since 1990.
The refinance index has been very volatile recently depending on rates and liquidity.
But with record low rates, the index remains up significantly from last year.
 The second graph shows the MBA mortgage purchase index
According to the MBA, purchase activity is up 28% year-over-year unadjusted.
Note: Red is a four-week average (blue is weekly).
Tuesday, December 01, 2020
Wednesday: ADP Employment, Beige Book
by Calculated Risk on 12/01/2020 09:15:00 PM
Wednesday:
• At 7:00 AM ET, The Mortgage Bankers Association (MBA) will release the results for the mortgage purchase applications index.
• At 8:15 AM, The ADP Employment Report for November. This report is for private payrolls only (no government). The consensus is for 420,000 jobs added, up from 365,000 in October.
• At 10:00 AM, Testimony, Fed Chair Jerome Powell, Coronavirus Aid, Relief, and Economic Security Act, Before the Committee on Financial Services, U.S. House of Representatives
• At 2:00 PM, the Federal Reserve Beige Book, an informal review by the Federal Reserve Banks of current economic conditions in their Districts.
December 1 COVID-19 Test Results; Record Hospitalizations
by Calculated Risk on 12/01/2020 07:22:00 PM
Note: The data was distorted over the holiday weekend.
The US is now averaging over 1 million tests per day. Based on the experience of other countries, for adequate test-and-trace (and isolation) to reduce infections, the percent positive needs to be well under 5% (probably close to 1%), so the US still needs to increase the number of tests per day significantly (or take actions to push down the number of new infections).
There were 1,065,594 test results reported over the last 24 hours.
There were 176,751 positive tests.
Almost 2,500 US deaths have been reported so far in December (one day!). See the graph on US Daily Deaths here.
 Click on graph for larger image.
This data is from the COVID Tracking Project.
The percent positive over the last 24 hours was 16.6% (red line is 7 day average). The percent positive is calculated by dividing positive results by the sum of negative and positive results (I don't include pending).
And check out COVID Exit Strategy to see how each state is doing.
 The second graph shows the 7 day average of positive tests reported and daily hospitalizations.
The dashed line is the previous hospitalization maximum.
Note that there were very few tests available in March and April, and many cases were missed, so the hospitalizations was higher relative to the 7-day average of positive tests in July.
• Record Hospitalizations (Almost 100,000)
MBA Survey: "Share of Mortgage Loans in Forbearance Increases to 5.54%"
by Calculated Risk on 12/01/2020 04:01:00 PM
Note: This is as of November 22nd.
From the MBA: Share of Mortgage Loans in Forbearance Increases to 5.54%
The Mortgage Bankers Association’s (MBA) latest Forbearance and Call Volume Survey revealed that the total number of loans now in forbearance increased from 5.48% of servicers’ portfolio volume in the prior week to 5.54% as of November 22, 2020. According to MBA’s estimate, 2.8 million homeowners are in forbearance plans.
...
“For the second week in a row, the share of loans in forbearance has increased, driven by a rise in new forbearance requests and another slowdown in the pace of forbearance exits. The increase was across all loan and servicer types. Even GSE loans, which had previously declined for 24 straight weeks, saw an increase last week,” said Mike Fratantoni, MBA’s Senior Vice President and Chief Economist. “Additionally concerning, there was an increase in forbearance re-entries, as borrowers who had previously exited sought relief again. The increase in new forbearance requests may be the result of additional outreach to homeowners who had previously not taken advantage of forbearance opportunities. However, the slowing rate of exits to a new survey low further highlights that borrowers still in forbearance are increasingly challenged by the renewed restrictions on economic activity to contain the surge in COVID-19 cases.”
Added Fratantoni, “Recent housing market data remain quite strong and we expect that the market is well positioned for additional growth next year, but these data show that additional support is likely needed to get through this winter.”
...
By stage, 20.34% of total loans in forbearance are in the initial forbearance plan stage, while 77.42% are in a forbearance extension. The remaining 2.24% are forbearance re-entries.
emphasis added
 Click on graph for larger image.
This graph shows the percent of portfolio in forbearance by investor type over time. Most of the increase was in late March and early April, and has been trending down for the last few months.
The MBA notes: "Weekly forbearance requests as a percent of servicing portfolio volume (#) increased to 0.11 percent from 0.09 percent the previous week."


