 RSS Feed
 by Calculated Risk on 12/02/2020 09:40:00 AM
Wednesday, December 02, 2020
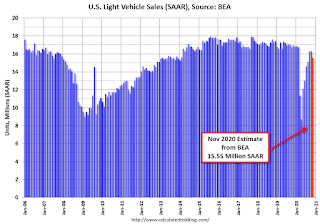
November Vehicles Sales decreased to 15.55 Million SAAR
The BEA released their estimate of light vehicle sales for November this morning. The BEA estimates sales of 15.55 million SAAR in November 2020 (Seasonally Adjusted Annual Rate), down 4.5% from the October sales rate, and down 8.4% from November 2019.
This was below the consensus estimate of 16.2 million SAAR.
 Click on graph for larger image.
This graph shows light vehicle sales since 2006 from the BEA (blue) and the BEA's estimate for November (red).
The impact of COVID-19 was significant, and April was the worst month.
Since April, sales have increased, but are still down 8.4% from last year.
The second graph shows light vehicle sales since the BEA started keeping data in 1967.
 Note: dashed line is current estimated sales rate of 15.55 million SAAR.
In 2019, there were 15.92 million light vehicle sales through November. In 2020, there have been 13.20 million sales. That puts sales-to-date down 17.1% in 2020 compared to the same period in 2019.
ADP: Private Employment increased 307,000 in November
by Calculated Risk on 12/02/2020 08:19:00 AM
Private sector employment increased by 307,000 jobs from October to November according to the Novembe ADP National Employment Report®. ... The report, which is derived from ADP’s actual payroll data, measures the change in total nonfarm private employment each month on a seasonally-adjusted basis.This was below the consensus forecast for 420 thousand private sector jobs added in the ADP report.
“While November saw employment gains, the pace continues to slow,” said Ahu Yildirmaz, vice president and co-head of the ADP Research Institute. “Job growth remained positive across all industries and sizes.”
emphasis added
The BLS report will be released Friday, and the consensus is for 500 thousand non-farm payroll jobs added in November. Of course the ADP report has not been very useful in predicting the BLS report.
MBA: Mortgage Applications Decrease in Latest Weekly Survey
by Calculated Risk on 12/02/2020 07:00:00 AM
From the MBA: Mortgage Applications Decrease in Latest MBA Weekly Survey
Mortgage applications decreased 0.6 percent from one week earlier, according to data from the Mortgage Bankers Association’s (MBA) Weekly Mortgage Applications Survey for the week ending November 27, 2020. This week’s results include an adjustment for the Thanksgiving holiday.
... The Refinance Index decreased 5 percent from the previous week and was 102 percent higher than the same week one year ago. The seasonally adjusted Purchase Index increased 9 percent from one week earlier. The unadjusted Purchase Index decreased 28 percent compared with the previous week and was 28 percent higher than the same week one year ago.
After adjusting for the Thanksgiving holiday, mortgage applications were mixed, with a jump in purchase applications and a decline in refinances. Purchase activity continued to show impressive year-over-year gains, with both the conventional and government segments of the market posting another week of growth,” said Joel Kan, MBA’s Associate Vice President of Economic and Industry Forecasting. “Purchase loan amounts continue to be significantly higher than their average over the past decade and hit $375,000 last week, the largest since the inception of MBA’s survey in 1990. Housing demand remains strong, and despite extremely tight inventory and rising prices, home sales are running at their strongest pace in over a decade.”
Added Kan, “The sustained period of low mortgage rates continues to spark borrower demand, and the mortgage industry is poised for its strongest year in originations since 2003. The ongoing refinance wave has been beneficial to homeowners looking to lower their monthly payments during these challenging economic times brought forth by the pandemic.”
...
The average contract interest rate for 30-year fixed-rate mortgages with conforming loan balances ($510,400 or less) remained unchanged at 2.92 percent, with points decreasing to 0.31 from 0.35 (including the origination fee) for 80 percent loan-to-value ratio (LTV) loans.
emphasis added
 Click on graph for larger image.
The first graph shows the refinance index since 1990.
The refinance index has been very volatile recently depending on rates and liquidity.
But with record low rates, the index remains up significantly from last year.
 The second graph shows the MBA mortgage purchase index
According to the MBA, purchase activity is up 28% year-over-year unadjusted.
Note: Red is a four-week average (blue is weekly).
Tuesday, December 01, 2020
Wednesday: ADP Employment, Beige Book
by Calculated Risk on 12/01/2020 09:15:00 PM
Wednesday:
• At 7:00 AM ET, The Mortgage Bankers Association (MBA) will release the results for the mortgage purchase applications index.
• At 8:15 AM, The ADP Employment Report for November. This report is for private payrolls only (no government). The consensus is for 420,000 jobs added, up from 365,000 in October.
• At 10:00 AM, Testimony, Fed Chair Jerome Powell, Coronavirus Aid, Relief, and Economic Security Act, Before the Committee on Financial Services, U.S. House of Representatives
• At 2:00 PM, the Federal Reserve Beige Book, an informal review by the Federal Reserve Banks of current economic conditions in their Districts.
December 1 COVID-19 Test Results; Record Hospitalizations
by Calculated Risk on 12/01/2020 07:22:00 PM
Note: The data was distorted over the holiday weekend.
The US is now averaging over 1 million tests per day. Based on the experience of other countries, for adequate test-and-trace (and isolation) to reduce infections, the percent positive needs to be well under 5% (probably close to 1%), so the US still needs to increase the number of tests per day significantly (or take actions to push down the number of new infections).
There were 1,065,594 test results reported over the last 24 hours.
There were 176,751 positive tests.
Almost 2,500 US deaths have been reported so far in December (one day!). See the graph on US Daily Deaths here.
 Click on graph for larger image.
This data is from the COVID Tracking Project.
The percent positive over the last 24 hours was 16.6% (red line is 7 day average). The percent positive is calculated by dividing positive results by the sum of negative and positive results (I don't include pending).
And check out COVID Exit Strategy to see how each state is doing.
 The second graph shows the 7 day average of positive tests reported and daily hospitalizations.
The dashed line is the previous hospitalization maximum.
Note that there were very few tests available in March and April, and many cases were missed, so the hospitalizations was higher relative to the 7-day average of positive tests in July.
• Record Hospitalizations (Almost 100,000)
MBA Survey: "Share of Mortgage Loans in Forbearance Increases to 5.54%"
by Calculated Risk on 12/01/2020 04:01:00 PM
Note: This is as of November 22nd.
From the MBA: Share of Mortgage Loans in Forbearance Increases to 5.54%
The Mortgage Bankers Association’s (MBA) latest Forbearance and Call Volume Survey revealed that the total number of loans now in forbearance increased from 5.48% of servicers’ portfolio volume in the prior week to 5.54% as of November 22, 2020. According to MBA’s estimate, 2.8 million homeowners are in forbearance plans.
...
“For the second week in a row, the share of loans in forbearance has increased, driven by a rise in new forbearance requests and another slowdown in the pace of forbearance exits. The increase was across all loan and servicer types. Even GSE loans, which had previously declined for 24 straight weeks, saw an increase last week,” said Mike Fratantoni, MBA’s Senior Vice President and Chief Economist. “Additionally concerning, there was an increase in forbearance re-entries, as borrowers who had previously exited sought relief again. The increase in new forbearance requests may be the result of additional outreach to homeowners who had previously not taken advantage of forbearance opportunities. However, the slowing rate of exits to a new survey low further highlights that borrowers still in forbearance are increasingly challenged by the renewed restrictions on economic activity to contain the surge in COVID-19 cases.”
Added Fratantoni, “Recent housing market data remain quite strong and we expect that the market is well positioned for additional growth next year, but these data show that additional support is likely needed to get through this winter.”
...
By stage, 20.34% of total loans in forbearance are in the initial forbearance plan stage, while 77.42% are in a forbearance extension. The remaining 2.24% are forbearance re-entries.
emphasis added
 Click on graph for larger image.
This graph shows the percent of portfolio in forbearance by investor type over time. Most of the increase was in late March and early April, and has been trending down for the last few months.
The MBA notes: "Weekly forbearance requests as a percent of servicing portfolio volume (#) increased to 0.11 percent from 0.09 percent the previous week."
Update: Framing Lumber Prices Up 50% Year-over-year
by Calculated Risk on 12/01/2020 12:57:00 PM
Here is another monthly update on framing lumber prices.
This graph shows CME framing futures through Nov 30th.
 Click on graph for larger image in graph gallery.
This is down sharply from late August, but still up 51% year-over-year.
There is a seasonal pattern for lumber prices, and usually prices will increase in the Spring, and peak around May, and then bottom around October or November - although there is quite a bit of seasonal variability.
Clearly there was a surge in demand for lumber mid-year - then the mills started catching up - but demand remains strong.
Construction Spending Increased 1.3% in October
by Calculated Risk on 12/01/2020 10:38:00 AM
From the Census Bureau reported that overall construction spending decreased in June:
Construction spending during October 2020 was estimated at a seasonally adjusted annual rate of $1,438.5 billion, 1.3 percent above the revised September estimate of $1,420.4 billion. The October figure is 3.7 percent above the October 2019 estimate of $1,386.8 billion.Both private and public spending increased:
emphasis added
Spending on private construction was at a seasonally adjusted annual rate of $1,093.7 billion, 1.4 percent above the revised September estimate of $1,078.9 billion. ...
In October, the estimated seasonally adjusted annual rate of public construction spending was $344.8 billion, 1.0 percent above the revised September estimate of $341.4 billion.
 Click on graph for larger image.
This graph shows private residential and nonresidential construction spending, and public spending, since 1993. Note: nominal dollars, not inflation adjusted.
Residential spending is 6% below the previous peak.
Non-residential spending is 10% above the previous peak in January 2008 (nominal dollars), but has been weak recently.
Public construction spending is 6% above the previous peak in March 2009, and 32% above the austerity low in February 2014.
 The second graph shows the year-over-year change in construction spending.
On a year-over-year basis, private residential construction spending is up 14.5%. Non-residential spending is down 8.2% year-over-year. Public spending is up 3.7% year-over-year.
Construction was considered an essential service in most areas and did not decline sharply like many other sectors, but it seems likely that non-residential, and public spending (depending on disaster relief), will be under pressure. For example, lodging is down 23% YoY, multi-retail down 19% YoY, and office down 8% YoY.
This was above consensus expectations of a 0.4% increase in spending, and construction spending for the previous two months was revised up (mostly private residential).
ISM Manufacturing index Decreased to 57.5 in November
by Calculated Risk on 12/01/2020 10:07:00 AM
The ISM manufacturing index indicated expansion in November. The PMI was at 57.5% in November, down from 59.3% in October. The employment index was at 48.4%, down from 53.2% last month, and the new orders index was at 65.1%, down from 67.9%.
From ISM: Manufacturing PMI® at 57.5%; November 2020 Manufacturing ISM® Report On Business®
Economic activity in the manufacturing sector grew in November, with the overall economy notching a seventh consecutive month of growth, say the nation's supply executives in the latest Manufacturing ISM® Report On Business®.This was at expectations, however the employment index moved below 50 (contraction).
The report was issued today by Timothy R. Fiore, CPSM, C.P.M., Chair of the Institute for Supply Management® (ISM®) Manufacturing Business Survey Committee:
"The November Manufacturing PMI® registered 57.5 percent, down 1.8 percentage points from the October reading of 59.3 percent. This figure indicates expansion in the overall economy for the seventh month in a row after a contraction in April, which ended a period of 131 consecutive months of growth. The New Orders Index registered 65.1 percent, down 2.8 percentage points from the October reading of 67.9 percent. The Production Index registered 60.8 percent, a decrease of 2.2 percentage points compared to the October reading of 63 percent. The Backlog of Orders Index registered 56.9 percent, 1.2 percentage points higher compared to the October reading of 55.7 percent. The Employment Index returned to contraction territory at 48.4 percent, 4.8 percentage points down from the October reading of 53.2 percent. The Supplier Deliveries Index registered 61.7 percent, up 1.2 percentage points from the October figure of 60.5 percent. The Inventories Index registered 51.2 percent, 0.7 percentage point lower than the October reading of 51.9 percent. The Prices Index registered 65.4 percent, down 0.1 percentage point compared to the October reading of 65.5 percent. The New Export Orders Index registered 57.8 percent, an increase of 2.1 percentage points compared to the October reading of 55.7 percent. The Imports Index registered 55.1 percent, a 3-percentage point decrease from the October reading of 58.1 percent."
emphasis added
This suggests manufacturing expanded at a slower pace in November than in October.
CoreLogic: House Prices up 7.3% Year-over-year in October
by Calculated Risk on 12/01/2020 08:00:00 AM
Notes: This CoreLogic House Price Index report is for October. The recent Case-Shiller index release was for September. The CoreLogic HPI is a three month weighted average and is not seasonally adjusted (NSA).
From CoreLogic: Gaining Momentum: Annual U.S. Home Prices Appreciated 7.3% in October, CoreLogic Reports
CoreLogic® ... today released the CoreLogic Home Price Index (HPI™) and HPI Forecast™ for October 2020. Nationally, home prices increased 7.3% in October 2020, compared with October 2019, marking the fastest annual appreciation since April 2014. On a month-over-month basis, home prices increased by 1.1% compared to September 2020.
...
Home prices climbed in recent months due to heightened demand and ongoing home supply constraints. The supply shortage could further intensify as COVID-19 cases continue to rise and would-be sellers remain hesitant about putting their homes on the market. However, to keep up with the rising demand, new home construction surged in October and builder confidence reached a new high for the third consecutive month. The decreased pressure on supply could moderate home price growth over the next year. This is reflected in the CoreLogic HPI Forecast, which shows home prices slowing to 1.9% by October 2021. However, should the economic recovery from the pandemic be more robust, then we would expect projections for home price performance to improve.
“Home buyers have been spurred by record-low mortgage rates and an urgency to buy or upgrade to more space, especially as much of the American workforce continues to work from home,” said Frank Martell, president and CEO of CoreLogic. “First-time buyers in particular should remain a big part of next year’s home purchases, as the largest wave of millennials is heading into prime home-buying years.”
“The pandemic has shifted home buyer interest toward detached rather than attached homes,” said Dr. Frank Nothaft, chief economist at CoreLogic. “Detached homes offer more living space and are typically located in less densely populated neighborhoods. And while prices of single-family detached homes posted an annual increase of 7.9% in October, the price of attached homes rose only 4.5% year over year.”
emphasis added


