by Calculated Risk on 11/25/2020 07:00:00 AM
Wednesday, November 25, 2020
MBA: Mortgage Applications Increase in Latest Weekly Survey
From the MBA: Mortgage Applications Increase in Latest MBA Weekly Survey
Mortgage applications increased 3.9 percent from one week earlier, according to data from the Mortgage Bankers Association’s (MBA) Weekly Mortgage Applications Survey for the week ending November 20, 2020.
... The Refinance Index increased 5 percent from the previous week and was 79 percent higher than the same week one year ago. The seasonally adjusted Purchase Index increased 4 percent from one week earlier. The unadjusted Purchase Index decreased 2 percent compared with the previous week and was 19 percent higher than the same week one year ago.
“30-year fixed mortgage rates dropped seven basis points to 2.92 percent, another record low in MBA’s survey. Weekly mortgage rate volatility has emerged again, as markets respond to fiscal policy uncertainty and a resurgence in COVID-19 cases around the country. The decline in rates ignited borrower interest, with applications for both home purchases and refinancing increasing on a weekly and annual basis,” said Joel Kan, MBA’s Associate Vice President of Industry and Economic Forecasting. “The ongoing refinance wave has continued into November. Both the refinance index and the share of refinance applications were at their highest levels since April, as another week of lower rates drew more convntional loan borrowers into the market.”
Added Kan, “Amidst strong competition for a limited supply of homes for sale, as well as rapidly increasing home prices, purchase applications increased for both conventional and government borrowers. Furthermore, purchase activity has surpassed year-ago levels for over six months.”
...
The average contract interest rate for 30-year fixed-rate mortgages with conforming loan balances ($510,400 or less) decreased to a survey low of 2.92 percent from 2.99 percent, with points decreasing to 0.35 from 0.37 (including the origination fee) for 80 percent loan-to-value ratio (LTV) loans.
emphasis added
 Click on graph for larger image.
The first graph shows the refinance index since 1990.
The refinance index has been very volatile recently depending on rates and liquidity.
But with record low rates, the index remains up significantly from last year.
 The second graph shows the MBA mortgage purchase index
According to the MBA, purchase activity is up 19% year-over-year unadjusted.
Note: Red is a four-week average (blue is weekly).
Tuesday, November 24, 2020
Wednesday: New Home Sales, GDP, Unemployment Claims, Personal Income & Outlays, FOMC Minutes and More
by Calculated Risk on 11/24/2020 09:40:00 PM
Wednesday:
• At 7:00 AM ET, The Mortgage Bankers Association (MBA) will release the results for the mortgage purchase applications index.
• At 8:30 AM, The initial weekly unemployment claims report will be released. The consensus is initial claims decreased to 710 thousand from 742 thousand last week.
• Also at 8:30 AM, Gross Domestic Product, 3nd quarter 2020 (Second estimate). The consensus is that real GDP increased 33.1% annualized in Q3, unchanged from the advance estimate of GDP.
• Also at 8:30 AM, Durable Goods Orders for October from the Census Bureau. The consensus is for a 1.9% increase in durable goods orders.
• At 10:00 AM, Personal Income and Outlays for October. The consensus is for a 0.1% increase in personal income, and for a 0.3% increase in personal spending. And for the Core PCE price index to increase 0.2%.
• Also at 10:00 AM, New Home Sales for October from the Census Bureau. The consensus is for 975 thousand SAAR, up from 959 thousand in September.
• Also at 10:00 AM, University of Michigan's Consumer sentiment index (Final for November). The consensus is for a reading of 77.0.
• At 2:00 PM, FOMC Minutes, Meeting of November 4-5, 2020
November 24 COVID-19 Test Results; Record Hospitalizations, Deaths Increasing
by Calculated Risk on 11/24/2020 07:11:00 PM
Note: Week-over-week case growth has slowed, and will probably show a decline over the holiday weekend. However, it is likely that cases will pickup again the following week. Stay Safe!!!
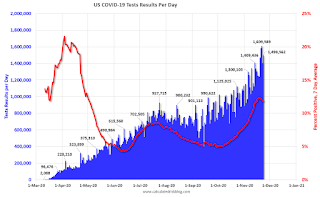
The US is now averaging over 1 million tests per day. Based on the experience of other countries, for adequate test-and-trace (and isolation) to reduce infections, the percent positive needs to be well under 5% (probably close to 1%), so the US still needs to increase the number of tests per day significantly (or take actions to push down the number of new infections).
There were 1,519,223 test results reported over the last 24 hours.
There were 166,672 positive tests.
Over 28,500 US deaths have been reported so far in November. See the graph on US Daily Deaths here.

This data is from the COVID Tracking Project.
The percent positive over the last 24 hours was 11.0% (red line is 7 day average). The percent positive is calculated by dividing positive results by the sum of negative and positive results (I don't include pending).
And check out COVID Exit Strategy to see how each state is doing.

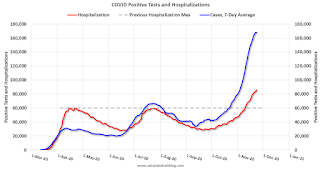
The dashed line is the previous hospitalization maximum.
Note that there were very few tests available in March and April, and many cases were missed, so the hospitalizations was higher relative to the 7-day average of positive tests in July.
• 7-day average cases are at a new record.
• 7-day average deaths at highest level since May.
• Record Hospitalizations.
Freddie Mac: Mortgage Serious Delinquency Rate decreased in October
by Calculated Risk on 11/24/2020 05:08:00 PM
Freddie Mac reported that the Single-Family serious delinquency rate in October was 2.89%, down from 3.04% in September. Freddie's rate is up from 0.61% in October 2019.
Freddie's serious delinquency rate peaked in February 2010 at 4.20%.
These are mortgage loans that are "three monthly payments or more past due or in foreclosure".

Mortgages in forbearance are being counted as delinquent in this monthly report, but they will not be reported to the credit bureaus.
This is very different from the increase in delinquencies following the housing bubble. Lending standards have been fairly solid over the last decade, and most of these homeowners have equity in their homes - and they will be able to restructure their loans once (if) they are employed.
Note: Fannie Mae will report for October soon.
Real House Prices and Price-to-Rent Ratio in September
by Calculated Risk on 11/24/2020 12:37:00 PM
Here is the post earlier on Case-Shiller: Case-Shiller: National House Price Index increased 7.0% year-over-year in September
It has been over fourteen years since the bubble peak. In the Case-Shiller release today, the seasonally adjusted National Index (SA), was reported as being 22.2% above the previous bubble peak. However, in real terms, the National index (SA) is still about 2% below the bubble peak (and historically there has been an upward slope to real house prices). The composite 20, in real terms, is still 10% below the bubble peak.
The year-over-year growth in prices increased to 7.0% nationally.
Usually people graph nominal house prices, but it is also important to look at prices in real terms (inflation adjusted). Case-Shiller and others report nominal house prices. As an example, if a house price was $200,000 in January 2000, the price would be close to $291,000 today adjusted for inflation (45%). That is why the second graph below is important - this shows "real" prices (adjusted for inflation).
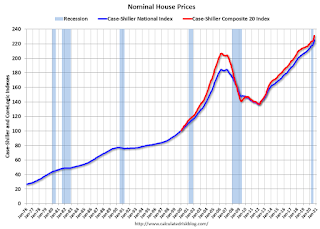
Nominal House Prices

In nominal terms, the Case-Shiller National index (SA) and the Case-Shiller Composite 20 Index (SA) are both at new all times highs (above the bubble peak).
Real House Prices

In real terms, the National index is back to November 2005 levels, and the Composite 20 index is back to January 2005.
In real terms, house prices are at 2005 levels.
Note that inflation was negative for a few months earlier this year, and that boosted real prices.
Price-to-Rent
In October 2004, Fed economist John Krainer and researcher Chishen Wei wrote a Fed letter on price to rent ratios: House Prices and Fundamental Value. Kainer and Wei presented a price-to-rent ratio using the OFHEO house price index and the Owners' Equivalent Rent (OER) from the BLS.

This graph shows the price to rent ratio (January 2000 = 1.0). The price-to-rent ratio had been moving mostly sideways, but picked up recently.
On a price-to-rent basis, the Case-Shiller National index is back to July 2004 levels, and the Composite 20 index is back to January 2004 levels.
In real terms, prices are back to 2005 levels, and the price-to-rent ratio is back to 2004.
Note: November Employment Report Will Show a Decrease of 93,000 Temporary Census Workers
by Calculated Risk on 11/24/2020 11:09:00 AM
The Census Bureau released an update today on 2020 Census Paid Temporary Workers
As of the October reference week, October 11th - 17th, there were 99,490 decennial Census temporary workers.
As of the November reference week, November 8th - 14th, there were 6,464 temp workers.
That is a decrease of 93,026 temporary jobs.
In August, the employment report showed a gain of 238,000 temporary 2020 Census workers, boosting the headline number.
In September, the employment report showed a decrease of 41,000 temporary 2020 Census workers, reducing the headline number.
In October, the employment report showed a decrease of 147,311 temporary Census employment.
Case-Shiller: National House Price Index increased 7.0% year-over-year in September
by Calculated Risk on 11/24/2020 09:11:00 AM
S&P/Case-Shiller released the monthly Home Price Indices for September ("September" is a 3 month average of July, August and September prices).
This release includes prices for 20 individual cities, two composite indices (for 10 cities and 20 cities) and the monthly National index.
From S&P: S&P CoreLogic Case-Shiller Index Shows Annual Home Price Gains Soared to 7% in September
The S&P CoreLogic Case-Shiller U.S. National Home Price NSA Index, covering all nine U.S. census divisions, reported a 7.0% annual gain in September, up from 5.8% in the previous month. The 10-City Composite annual increase came in at 6.2%, up from 4.9% in the previous month. The 20-City Composite posted a 6.6% year-over-year gain, up from 5.3% in the previous month.
Phoenix, Seattle and San Diego continued to report the highest year-over-year gains among the 19 cities (excluding Detroit) in September. Phoenix led the way with an 11.4% year-over-year price increase, followed by Seattle with a 10.1% increase and San Diego with a 9.5% increase. All 19 cities reported higher price increases in the year ending September 2020 versus the year ending August 2020.
...
The National Index posted a 1.2% month-over-month increase, while the 10-City and 20-City Composites both posted increases of 1.3% and 1.2% respectively, before seasonal adjustment in September. After seasonal adjustment, the National Index posted a month-over-month increase of 1.4%, while the 10-City and 20-City Composites both posted increases of 1.2% and 1.3% respectively. In September, all 19 cities (excluding Detroit) reported increases before seasonal adjustment, and after seasonal adjustment.
Housing prices were notably – I am tempted to say ‘very’ – strong in September,” says Craig J. Lazzara, Managing Director and Global Head of Index Investment Strategy at S&P Dow Jones Indices. “The National Composite Index gained 7.0% relative to its level a year ago, well ahead of August’s 5.8% increase. The 10- and 20-City Composites (up 6.2% and 6.6%, respectively) also rose at an accelerating pace in September. The strength of the housing market was consistent nationally – all 19 cities for which we have September data rose, and all 19 gained more in the 12 months ended in September than they had done in the 12 months ended in August.
“A trend of accelerating increases in the National Composite Index began in August 2019 but was interrupted in May and June, as COVID-related restrictions produced modestly-decelerating price gains. Our three monthly readings since June of this year have all shown accelerating growth in home prices, and September’s results are quite strong. The last time that the National Composite matched September’s 7.0% growth rate was more than six years ago, in May 2014. This month’s increase may reflect a catch-up of COVID-depressed demand from earlier this year; it might also presage future strength, as COVID encourages potential buyers to move from urban apartments to suburban homes. The next several months’ reports should help to shed light on this question.
emphasis added
 Click on graph for larger image.
 The first graph shows the nominal seasonally adjusted Composite 10, Composite 20 and National indices (the Composite 20 was started in January 2000).
The Composite 10 index is up 1.3% in September (SA) from August.
The Composite 20 index is up 1.3% (SA) in September.
The National index is 22.2% above the bubble peak (SA), and up 1.4% (SA) in September. The National index is up 65% from the post-bubble low set in December 2011 (SA).
 The second graph shows the Year over year change in all three indices.
The Composite 10 SA is up 6.2% compared to September 2019. The Composite 20 SA is up 6.6% year-over-year.
The National index SA is up 7.0% year-over-year.
Note: According to the data, prices increased in 19 cities month-over-month seasonally adjusted.
Price increases were above expectations. I'll have more later.
Monday, November 23, 2020
Tuesday: Case-Shiller House Prices
by Calculated Risk on 11/23/2020 09:48:00 PM
Tuesday:
• At 9:00 AM ET, S&P/Case-Shiller House Price Index for September. The consensus is for a 5.8% year-over-year increase in the National index for September.
• Also at 9:00 AM, FHFA House Price Index for September. This was originally a GSE only repeat sales, however there is also an expanded index.
• At 10:00 AM, Richmond Fed Survey of Manufacturing Activity for November.
November 23 COVID-19 Test Results; Record Hospitalizations
by Calculated Risk on 11/23/2020 07:30:00 PM
Note: Week-over-week case growth is slowing, so maybe cases per day will peak soon (A virtual Thanksgiving is recommended by the CDC). Stay Safe!!!
The US is now averaging over 1 million tests per day. Based on the experience of other countries, for adequate test-and-trace (and isolation) to reduce infections, the percent positive needs to be well under 5% (probably close to 1%), so the US still needs to increase the number of tests per day significantly (or take actions to push down the number of new infections).
There were 1,498,562 test results reported over the last 24 hours.
There were 150,975 positive tests.
Over 26,500 US deaths have been reported so far in November. See the graph on US Daily Deaths here.

This data is from the COVID Tracking Project.
The percent positive over the last 24 hours was 10.1% (red line is 7 day average). The percent positive is calculated by dividing positive results by the sum of negative and positive results (I don't include pending).
And check out COVID Exit Strategy to see how each state is doing.

The dashed line is the previous hospitalization maximum.
Note that there were very few tests available in March and April, and many cases were missed, so the hospitalizations was higher relative to the 7-day average of positive tests in July.
• 7-day average cases are at a new record.
• 7-day average deaths at highest level since May.
• Record Hospitalizations.
November Vehicle Sales Forecast: "Second Straight Month-to-Month Decline"
by Calculated Risk on 11/23/2020 05:50:00 PM
From Wards: November U.S. Light-Vehicle Sales Forecast for Second Straight Month-to-Month Decline (pay content)

This graph shows actual sales from the BEA (Blue), and Wards forecast for November (Red).
Sales have bounced back from the April low, but will likely be down around 7% year-over-year in November.
The Wards forecast of 15.7 million SAAR, would be down about 3% from October.
This would put sales in 2020, through November, down about 16% compared to the same period in 2019.


