 RSS Feed
 by Calculated Risk on 9/11/2020 08:32:00 AM
Friday, September 11, 2020
BLS: CPI increased 0.4% in August, Core CPI increased 0.4%
The Consumer Price Index for All Urban Consumers (CPI-U) increased 0.4 percent in August on a seasonally adjusted basis after rising 0.6 percent in July, the U.S. Bureau of Labor Statistics reported today. Over the last 12 months, the all items index increased 1.3 percent before seasonal adjustment.Overall inflation was above expectations in August. I'll post a graph later today after the Cleveland Fed releases the median and trimmed-mean CPI.
The monthly increase in the seasonally adjusted all items index was broad-based; a sharp rise in the used cars and trucks index was the largest factor, but the indexes for gasoline, shelter, recreation, and household furnishings and operations also contributed. ...
The index for all items less food and energy rose 0.4 percent in August after increasing 0.6 percent in July. ...
The all items index increased 1.3 percent for the 12 months ending August; this figure has been rising since the period ending May 2020, when the 12-month increase was 0.1 percent. The index for all items less food and energy increased 1.7 percent over the last 12 months.
emphasis added
Thursday, September 10, 2020
Friday: CPI
by Calculated Risk on 9/10/2020 09:00:00 PM
Friday:
• At 8:30 AM ET, The Consumer Price Index for August from the BLS. The consensus is for a 0.3% increase in CPI, and a 0.2% increase in core CPI.
September 10 COVID-19 Test Results
by Calculated Risk on 9/10/2020 06:28:00 PM
The US is now mostly reporting over 700,000 tests per day. Based on the experience of other countries, the percent positive needs to be well under 5% to really push down new infections, so the US still needs to increase the number of tests per day significantly (or take actions to push down the number of new infections).
There were 614,042 test results reported over the last 24 hours.
There were 37,581 positive tests.
See the graph on US Daily Deaths here.
 Click on graph for larger image.
This data is from the COVID Tracking Project.
The percent positive over the last 24 hours was 6.1% (red line).
For the status of contact tracing by state, check out testandtrace.com.
And check out COVID Exit Strategy to see how each state is doing.
 The second graph shows the 7 day average of positive tests reported.
The dashed line is the June low.
Note that there were very few tests available in March and April, and many cases were missed (the percent positive was very high - see first graph).
By June, the percent positive had dropped below 5% (lower than today). If people stay vigilant, the number of cases might drop to the June low by the end of September (that would still be a large number of new cases, but progress).
Hotels: Occupancy Rate Declined 19% Year-over-year; Boosted by Hurricane and Fires
by Calculated Risk on 9/10/2020 04:27:00 PM
From HotelNewsNow.com: STR: US hotel results for week ending 5 September
Boosted in part by Labor Day weekend, U.S. hotel occupancy increased slightly over the previous week, according to the latest data from STR.The following graph shows the seasonal pattern for the hotel occupancy rate using the four week average.
30 August through 5 September 2020 (percentage change from comparable week in 2019):
• Occupancy: 49.4% (-18.9%)
• Average daily rate (ADR): US$100.97 (-17.1%)
• Revenue per available room (RevPAR): US$49.87 (-32.8%)
Hotel demand grew to 18 million room nights sold (+500,000 week over week). Saturday (5 September) occupancy came in at 69.0%, just 2.6% less than the comparable Saturday in 2019, and leisure markets that have showed the highest summer occupancy levels reported strong increases from the previous weekend. At the same time, the markets with the highest occupancy for the week were not leisure destinations. Rather, the high occupancy markets were those housing displaced residents from Hurricane Laura and the California wildfires.
emphasis added
 Click on graph for larger image.
The red line is for 2020, dash light blue is 2019, blue is the median, and black is for 2009 (the worst year probably since the Great Depression for hotels).
The leisure travel season usually peaks at the beginning of August, and then the occupancy rate typically declines sharply in the Fall. However, with so many schools closed (or openings delayed), the leisure travel season lasted longer than usual this year. It seems unlikely business travel will pickup significantly in the Fall.
Note: Y-axis doesn't start at zero to better show the seasonal change.
Houston Real Estate in August: Sales Up 7% YoY, Inventory Down 23% YoY
by Calculated Risk on 9/10/2020 12:50:00 PM
From the HAR: Houston Real Estate Registers Another Strong Performance in August
Following a July that vaulted Houston real estate into the record books, August proved to be another healthy month for home sales despite the lingering coronavirus pandemic. The high end of the market staged the strongest performance, pulling up overall pricing along the way. However, with a decline in the number of listings for sale coming on the market, inventory has now fallen to its lowest level in five years, setting the stage for moderating sales in the weeks ahead despite historically low interest rates.Inventory declined 23.0% year-over-year from 44,369 in August 2019 to 34,181 in August 2020.
According to the latest Houston Association of Realtors (HAR) Market Update, 9,195 single-family homes sold in August compared to 8,673 a year earlier. That accounted for a 6.0 percent increase and marked the third consecutive month of positive sales.
...
Sales of all property types totaled 11,121 – up 7.3 percent from August 2019. Total dollar volume for the month increased 13.4 percent to $3.5 billion. After strong consumer interest in July, the lease market retreated in August, with declines in both the single-family and townhouse/condo markets.
emphasis added
Note that the closed sales in August were for contracts that were mostly signed in June and July.
Comments on Weekly Unemployment Claims
by Calculated Risk on 9/10/2020 09:17:00 AM
Earlier: Weekly Initial Unemployment Claims unchanged at 884,000
This was the 25th consecutive week with extraordinarily high initial claims.
More importantly, continued claims are still extremely high (second graph below).
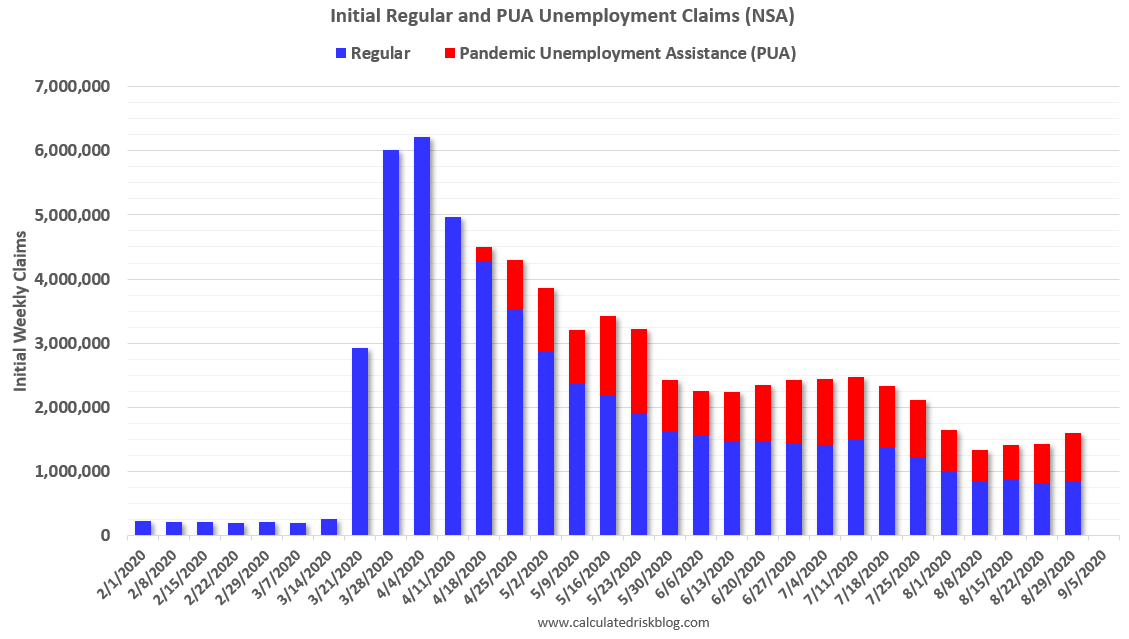
The following graph shows regular initial unemployment claims (blue) and PUA claims (red) since early February (all NSA).
 Click on graph for larger image.
Initial claims, including Pandemic Unemployment Assistance (PUA) are rising, and are close to 1.7 million per week.
The worst week during the great recession was 665,000 (SA). So total initial weekly claims are still more than 1 million higher than the worst week of the great recession!
We are probably seeing some layoffs related to the end of some Payroll Protection Programs (PPP), and possibly due to the fires in the West.
 The second graph shows all person receiving unemployment insurance benefits on all programs. Note that this data is released with a two week lag, and is not seasonally adjusted.
There are typically around 2 million people receiving benefits from the various programs (mostly regular unemployment insurance).
As of the release this morning, there were still almost 30 million people receiving benefits as of August 22nd.
This was a very disappointing weekly report. Initial claims were higher than expected, and there was a further increase in initial claims (regular and PUA), and the total continued claims increased - and remains at a very high level.
Weekly Initial Unemployment Claims unchanged at 884,000
by Calculated Risk on 9/10/2020 08:38:00 AM
The DOL reported:
In the week ending September 5, the advance figure for seasonally adjusted initial claims was 884,000, unchanged from the previous week's revised level. The previous week's level was revised up by 3,000 from 881,000 to 884,000. The 4- week moving average was 970,750, a decrease of 21,750 from the previous week's revised average. The previous week's average was revised up by 750 from 991,750 to 992,500.The previous week was revised up.
emphasis added
This does not include the 838,916 initial claims for Pandemic Unemployment Assistance (PUA) that was up from 747,993 the previous week.
The following graph shows the 4-week moving average of weekly claims since 1971.
 Click on graph for larger image.
The dashed line on the graph is the current 4-week average. The four-week average of weekly unemployment claims decreased to 970,750.
The previous week was revised up.
The second graph shows seasonally adjust continued claims since 1967 (lags initial by one week).
 At the worst of the Great Recession, continued claims peaked at 6.635 million, but then steadily declined.
Continued claims increased to 13,385,000 (SA) from 13,292,000 (SA) last week and will likely stay at a high level until the crisis abates.
Note: There are an additional 14,591,621 receiving Pandemic Unemployment Assistance (PUA) that increased from 13,570,327 the previous week. This is a special program for business owners, self-employed, independent contractors or gig workers not receiving other unemployment insurance.
Wednesday, September 09, 2020
Thursday: Unemployment Claims, PPI
by Calculated Risk on 9/09/2020 09:00:00 PM
Thursday:
• At 8:30 AM ET, The initial weekly unemployment claims report will be released. The consensus is for a 846 thousand initial claims, down from 881 thousand the previous week.
• Also at 8:30 AM, The Producer Price Index for August from the BLS. The consensus is for a 0.2% increase in PPI, and a 0.2% increase in core PPI.
September 9 COVID-19 Test Results
by Calculated Risk on 9/09/2020 07:05:00 PM
The US is now mostly reporting over 700,000 tests per day. Based on the experience of other countries, the percent positive needs to be well under 5% to really push down new infections, so the US still needs to increase the number of tests per day significantly (or take actions to push down the number of new infections).
There were 584,412 test results reported over the last 24 hours.
There were 30,983 positive tests.
See the graph on US Daily Deaths here.
 Click on graph for larger image.
This data is from the COVID Tracking Project.
The percent positive over the last 24 hours was 5.3% (red line).
For the status of contact tracing by state, check out testandtrace.com.
And check out COVID Exit Strategy to see how each state is doing.
 The second graph shows the 7 day average of positive tests reported.
The dashed line is the June low.
Note that there were very few tests available in March and April, and many cases were missed (the percent positive was very high - see first graph).
By June, the percent positive had dropped below 5% (lower than today). If people stay vigilant, the number of cases might drop to the June low by the end of September (that would still be a large number of new cases, but progress).
Las Vegas Real Estate in August: Sales down 9% YoY, Inventory down 36% YoY
by Calculated Risk on 9/09/2020 12:03:00 PM
This report is for closed sales in August; sales are counted at the close of escrow, so the contracts for these homes were mostly signed in June and July.
The Las Vegas Realtors reported Southern Nevada home prices rise again, though fewer homes are selling; LVR housing statistics for August 2020
LVR reported a total of 3,594 existing local homes, condos and townhomes were sold during August. Compared to the same time last year, August sales were down 8.1% for homes and down 10.8% for condos and townhomes.1) Overall sales were down 8.7% year-over-year to 3,594 in August 2020 from 3,935 in August 2019.
...
By the end of August, LVR reported 4,639 single-family homes listed for sale without any sort of offer. That’s down 40.3% from one year ago. For condos and townhomes, the 1,544 properties listed without offers in August represented a 17.0% drop from one year ago.
…
Despite the coronavirus crisis, the number of so-called distressed sales in August remained near historically low levels. The association reported that short sales and foreclosures combined accounted for just 1.2% of all existing local property sales in August. That compares to 2.1% of all sales one year ago, 2.5% two years ago and 6.1% three years ago.
emphasis added
2) Active inventory (single-family and condos) is down from a year ago, from a total of 9,626 in August 2019 to 6,183 in August 2020. Note: Total inventory was down 35.8% year-over-year. And months of inventory is low.
3) Low level of distressed sales.


