 RSS Feed
 by Calculated Risk on 4/02/2020 09:11:00 AM
Thursday, April 02, 2020
Trade Deficit decreased to $39.9 Billion in February
Note: This data was for February and the outbreak of COVID-19 likely impacted trade with China.
From the Department of Commerce reported:
The U.S. Census Bureau and the U.S. Bureau of Economic Analysis announced today that the goods and services deficit was $39.9 billion in February, down $5.5 billion from $45.5 billion in January, revised.
February exports were $207.5 billion, $0.8 billion less than January exports. February imports were $247.5 billion, $6.3 billion less than January imports
emphasis added
 Click on graph for larger image.
Both exports and imports decreased in January.
Exports are 26% above the pre-recession peak and down slightly compared to February 2019; imports are 7% above the pre-recession peak, and down 5% compared to February 2019.
In general, trade both imports and exports have moved more sideways or down recently.
The second graph shows the U.S. trade deficit, with and without petroleum.
 The blue line is the total deficit, and the black line is the petroleum deficit, and the red line is the trade deficit ex-petroleum products.
Note that the U.S. exported a slight net positive petroleum products in recent months.
Oil imports averaged $57.24 per barrel in February, down from $61.93 in January, and down from $57.70 in February 2019.
The trade deficit with China decreased to $16.0 billion in February, from $24.8 billion in February 2019.
Weekly Initial Unemployment Claims Increase to 6,648,000
by Calculated Risk on 4/02/2020 08:35:00 AM
The DOL reported:
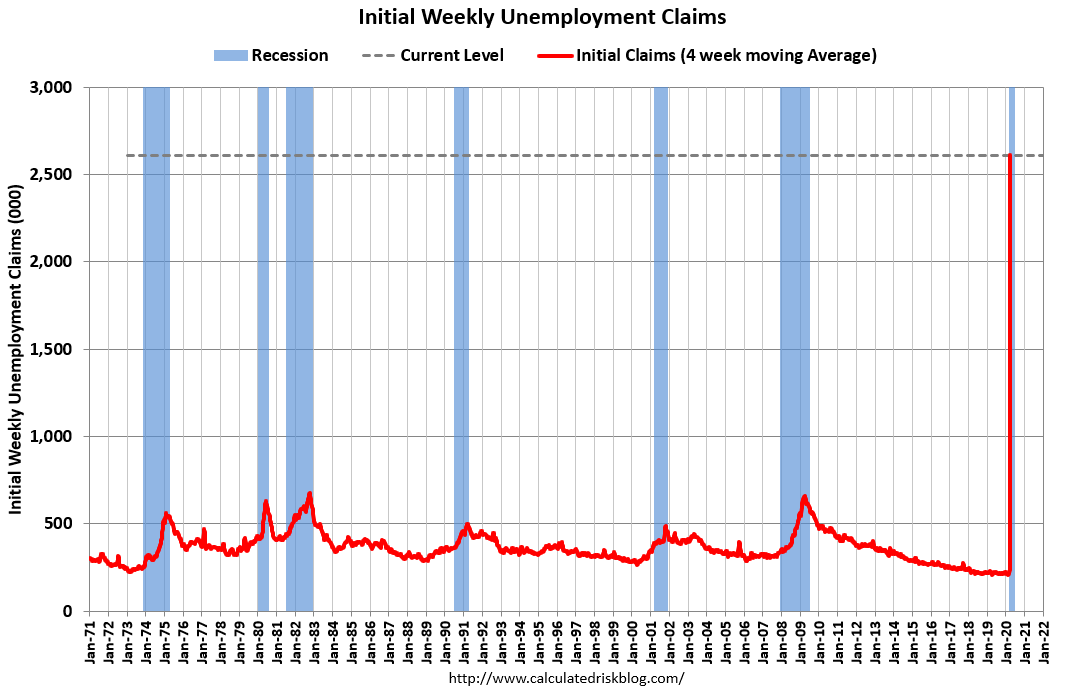
In the week ending March 28, the advance figure for seasonally adjusted initial claims was 6,648,000, an increase of 3,341,000 from the previous week's revised level. This marks the highest level of seasonally adjusted initial claims in the history of the seasonally adjusted series. The previous week's level was revised up by 24,000 from 3,283,000 to 3,307,000. The 4-week moving average was 2,612,000, an increase of 1,607,750 from the previous week's revised average. The previous week's average was revised up by 6,000 from 998,250 to 1,004,250.The previous week was revised up.
emphasis added
The following graph shows the 4-week moving average of weekly claims since 1971.
 Click on graph for larger image.
The dashed line on the graph is the current 4-week average. The four-week average of weekly unemployment claims increased to 2,612,000.
This was much higher than the consensus forecast.
The second graph shows seasonally adjust continued claims since 1967 (lags initial by one week while increasing sharply).
 At the worst of the Great Recession, continued claims peaked at 6.635 million, but then steadily declined.
Over the next few weeks, continued claims will increase rapidly to a new record high, and then will likely stay at that high level until the crisis abates.
Wednesday, April 01, 2020
Thursday: Unemployment Claims, Trade Deficit
by Calculated Risk on 4/01/2020 10:43:00 PM
Thursday:
• At 8:30 AM, The initial weekly unemployment claims report will be released. The consensus is for a 3.000 million initial claims, down from 3.283 million the previous week.
• At 8:30 AM, Trade Balance report for January from the Census Bureau. The consensus is the trade deficit to be $40.0 billion. The U.S. trade deficit was at $45.3 billion in January.
• Early, BEA Light vehicle sales for March. The consensus is for light vehicle sales to be 11.9 million SAAR in March, down from 16.8 million in February (Seasonally Adjusted Annual Rate).
April 1 Update: US COVID-19 Tests per Day; More Testing Needed
by Calculated Risk on 4/01/2020 05:39:00 PM
There is still far too little testing in the U.S.
We need:
1) More testing.
2) Better reporting (all tests, positive and negative).
3) A national test-and-trace program. Name the head of the program now - so that person can update everyone on the progress.
Test-and-trace is a key criteria in starting to reopen the country. My current guess is test-and-trace will require around 300,000 tests per day at first since the US is far behind the curve.
Notes: Data for the previous couple of days is updated and revised, so graphs might change.
Also, I include all tests in the total including pending.
The percent positive excludes the pending tests.
There were 101,147 tests reported over the last 24 hours.
 Click on graph for larger image.
This data is from the COVID Tracking Project.
The percent positive over the last 24 hours was 26% (red line - going the wrong way).
Testing must continue to be expanded until the percent positive declines to 5% or lower. This is based on results from South Korea.
Test. Test. Test. Protect healthcare workers first!
Zillow Case-Shiller February Forecast: "Ancient History"
by Calculated Risk on 4/01/2020 02:38:00 PM
The Case-Shiller house price indexes for January were released yesterday. Zillow forecasts Case-Shiller a month early, and I like to check the Zillow forecasts since they have been pretty close.
From Matthew Speakman at Zillow: January Case-Shiller Results & February Forecast: Ancient History
It may have been only two months ago, but in many ways it might as well be ancient history. ...
The national Case-Shiller Home Price Index rose 3.9% year-over-year in January. The smaller 10- and 20-city composite indices grew more slowly, at 2.6% and 3.1% year-over-year, respectively.
emphasis added
 The Zillow forecast is for the year-over-year change for the Case-Shiller National index to be at 4.0% in February, up from 3.9% in January.
 The Zillow forecast is for the 20-City index to be up 3.2% YoY in February from 3.1% in January, and for the 10-City index to increase to 2.7% YoY compared to 2.6% YoY in January.
But this is all "ancient history".
Fannie Mae: Mortgage Serious Delinquency Rate Declined in February, Lowest Since 2007
by Calculated Risk on 4/01/2020 12:07:00 PM
Fannie Mae reported that the Single-Family Serious Delinquency was declined to 0.65% in February, from 0.66% in January. The serious delinquency rate is down from 0.76% in February 2019.
These are mortgage loans that are "three monthly payments or more past due or in foreclosure".
This is the lowest serious delinquency rate for Fannie Mae since June 2007.
The Fannie Mae serious delinquency rate peaked in February 2010 at 5.59%.
 Click on graph for larger image
By vintage, for loans made in 2004 or earlier (2% of portfolio), 2.46% are seriously delinquent. For loans made in 2005 through 2008 (4% of portfolio), 4.07% are seriously delinquent, For recent loans, originated in 2009 through 2018 (94% of portfolio), only 0.35% are seriously delinquent. So Fannie is still working through a few poor performing loans from the bubble years.
I expect the serious delinquency rate will increase in a few months due to COVID-19.
Note: Freddie Mac reported earlier.
Construction Spending Decreased in February
by Calculated Risk on 4/01/2020 10:19:00 AM
From the Census Bureau reported that overall construction spending increased in February:
Construction spending during February 2020 was estimated at a seasonally adjusted annual rate of $1,366.7 billion, 1.3 percent below the revised January estimate of $1,384.5 billion. The February figure is 6.0 percent above the February 2019 estimate of $1,289.0 billion.Both private and public spending decreased:
emphasis added
Spending on private construction was at a seasonally adjusted annual rate of $1,025.8 billion, 1.2 percent below the revised January estimate of $1,038.5 billion. ...
In February, the estimated seasonally adjusted annual rate of public construction spending was $340.9 billion, 1.5 percent below the revised January estimate of $345.9 billion.
 Click on graph for larger image.
This graph shows private residential and nonresidential construction spending, and public spending, since 1993. Note: nominal dollars, not inflation adjusted.
Private residential spending had been increasing - but turned down in the 2nd half of 2018. It started increasing again, but will slow due to the pandemic. Residential spending is 17% below the previous peak.
Non-residential spending is 11% above the previous peak in January 2008 (nominal dollars).
Public construction spending is 5% above the previous peak in March 2009, and 30% above the austerity low in February 2014.
 The second graph shows the year-over-year change in construction spending.
On a year-over-year basis, private residential construction spending is up 11.3%. Non-residential spending is down slightly year-over-year. Public spending is up 7.4% year-over-year.
This was well below consensus expectations of a 0.6% increase in spending, however construction spending for December and January were revised up.
Construction spending will decline due to COVID-19, although construction is considered an essential service in most areas.
ISM Manufacturing index Decreased to 49.1 in March
by Calculated Risk on 4/01/2020 10:04:00 AM
The ISM manufacturing index indicated contraction in March. The PMI was at 49.1% in March, down from 50.1% in February. The employment index was at 43.8%, down from 46.9% last month, and the new orders index was at 42.2%, down from 49.8%.
From the Institute for Supply Management: March 2020 Manufacturing ISM® Report On Business®
Economic activity in the manufacturing sector contracted in March, and the overall economy grew for the 131st consecutive month, say the nation's supply executives in the latest Manufacturing ISM® Report On Business®.This was above expectations of 45.0%, and suggests manufacturing contracted in March.
The report was issued today by Timothy R. Fiore, CPSM, C.P.M., Chair of the Institute for Supply Management® (ISM®) Manufacturing Business Survey Committee: “The March PMI® registered 49.1 percent, down 1 percentage point from the February reading of 50.1 percent. The New Orders Index registered 42.2 percent, a decrease of 7.6 percentage points from the February reading of 49.8 percent. The Production Index registered 47.7 percent, down 2.6 percentage points compared to the February reading of 50.3 percent. The Backlog of Orders Index registered 45.9 percent, a decrease of 4.4 percentage points compared to the February reading of 50.3 percent. The Employment Index registered 43.8 percent, a decrease of 3.1 percentage points from the February reading of 46.9 percent.
emphasis added
The index will be much worse in April due to COVID-19.
ADP: Private Employment decreased 27,000 in March
by Calculated Risk on 4/01/2020 08:19:00 AM
ADP National Employment Report: Private Sector Employment Decreased by 27,000 Jobs in March; the March NER Utilizes Data Through March 12 and Does Not Reflect the Full Impact of COVID-19 on the Overall Employment SituationThis was above the consensus forecast for 154,000 private sector jobs lost in the ADP report (the job losses will be in the April report due to timing).
Private sector employment decreased by 27,000 jobs from February to March according to the March ADP National Employment Report®. ... The report utilizes data through the 12th of the month. The NER uses the same time period the Bureau of Labor and Statistics uses for their survey. As such, the March NER does not reflect the full impact of COVID-19 on the overall employment situation.
...
“It is important to note that the ADP National Employment Report is based on the total number of payroll records for employees who were active on a company’s payroll through the 12th of the month. This is the same time period the Bureau of Labor and Statistics uses for their survey,” said Ahu Yildirmaz, co-head of the ADP Research Institute. “As such, the March NER does not fully reflect the most recent impact of COVID-19 on the employment situation, including unemployment claims reported on March 26, 2020.”
The BLS report will be released Friday, and the consensus is for 100,000 non-farm payroll jobs lost in March.
MBA: Mortgage Refinance Applications Increased, Purchase Applications down 24% YoY
by Calculated Risk on 4/01/2020 07:00:00 AM
From the MBA: Mortgage Applications Increase in Latest MBA Weekly Survey
Mortgage applications increased 15.3 percent from one week earlier, according to data from the Mortgage Bankers Association’s (MBA) Weekly Mortgage Applications Survey for the week ending March 27, 2020.
... The Refinance Index increased 26 percent from the previous week and was 168 percent higher than the same week one year ago. The seasonally adjusted Purchase Index decreased 11 percent from one week earlier. The unadjusted Purchase Index decreased 10 percent compared with the previous week and was 24 percent lower than the same week one year ago.
...
“Mortgage rates and applications continue to experience significant volatility from the economic and financial market uncertainty caused by the coronavirus crisis. After two weeks of sizeable increases, mortgage rates dropped back to the lowest level in MBA’s survey, which in turn led to a 25 percent jump in refinance applications,” said Joel Kan, MBA’s Associate Vice President of Economic and Industry Forecasting. “The bleaker economic outlook, along with the first wave of realized job losses reported in last week’s unemployment claims numbers, likely caused potential homebuyers to pull back. Purchase applications were down over 10 percent, and after double-digit annual growth to start 2020, activity has fallen off last year’s pace for two straight weeks.”
Added Kan, “Buyer and seller traffic – and ultimately home purchases – will also likely be slowed this spring by the restrictions ordered in several states on in-person activities.”
...
The average contract interest rate for 30-year fixed-rate mortgages with conforming loan balances ($510,400 or less) decreased to 3.47 percent from 3.82 percent, with points decreasing to 0.33 from 0.35 (including the origination fee) for 80 percent loan-to-value ratio (LTV) loans.
emphasis added
 Click on graph for larger image.
The first graph shows the refinance index since 1990.
With record lower rates, we saw a huge increase in refinance activity in the survey over the last two weeks.
Note the Fed has stepped up buying of MBS the previous week.
 The second graph shows the MBA mortgage purchase index
According to the MBA, purchase activity is DOWN 24% year-over-year.
It appears purchase activity is falling sharply.


