by Calculated Risk on 10/23/2019 01:13:00 PM
Wednesday, October 23, 2019
Philly Fed: State Coincident Indexes increased in 39 states in September
From the Philly Fed:
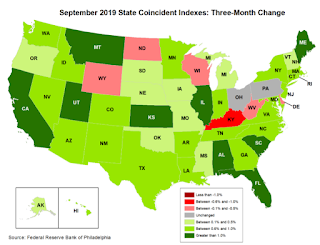
The Federal Reserve Bank of Philadelphia has released the coincident indexes for the 50 states for September 2019. Over the past three months, the indexes increased in 42 states, decreased in six states, and remained stable in two, for a three month diffusion index of 72. In the past month, the indexes increased in 39 states, decreased in eight states, and remained stable in three, for a one-month diffusion index of 62.Note: These are coincident indexes constructed from state employment data. An explanation from the Philly Fed:
emphasis added
The coincident indexes combine four state-level indicators to summarize current economic conditions in a single statistic. The four state-level variables in each coincident index are nonfarm payroll employment, average hours worked in manufacturing by production workers, the unemployment rate, and wage and salary disbursements deflated by the consumer price index (U.S. city average). The trend for each state’s index is set to the trend of its gross domestic product (GDP), so long-term growth in the state’s index matches long-term growth in its GDP.
 Click on map for larger image.
Here is a map of the three month change in the Philly Fed state coincident indicators. This map was all red during the worst of the recession, and all or mostly green during most of the recent expansion.
The map is mostly green on a three month basis, but there are some red and gray states.
Source: Philly Fed.
Note: For complaints about red / green issues, please contact the Philly Fed.
 And here is a graph is of the number of states with one month increasing activity according to the Philly Fed. This graph includes states with minor increases (the Philly Fed lists as unchanged).
In September, 42 states had increasing activity (graph includes minor increases).
AIA: "Architecture Billings Index downturn moderates as challenging conditions continue"
by Calculated Risk on 10/23/2019 11:27:00 AM
Note: This index is a leading indicator primarily for new Commercial Real Estate (CRE) investment.
From the AIA: Architecture Billings Index downturn moderates as challenging conditions continue
While architecture billings moderated in September, design activity shows signs of remaining sluggish at U.S. architecture firms, according to a new report released today from the American Institute of Architects (AIA).
The Architecture Billings Index (ABI) score in September is 49.7, which improved from the August score of 47.2. However, any score below 50 indicates a decrease in billings. During September, both the new project inquiries and design contracts scores were positive, posting scores of 59.0 and 54.4 respectively.
“Though still in negative territory, the moderating billings score along with the rebound in design contracts and inquiries serve as a continued note of caution for the industry,” said AIA Chief Economist Kermit Baker, PhD, Hon. AIA. “Continued weakness in the larger economy still doesn’t bode well for future design services, which will likely see continued volatility in the months ahead.”
...
• Regional averages: South (52.3); West (51.3); Northeast (46.3); Midwest (45.3)
• Sector index breakdown: multi-family residential (53.2); mixed practice (53.0); institutional (48.5); commercial/industrial (45.3)
emphasis added
 Click on graph for larger image.
This graph shows the Architecture Billings Index since 1996. The index was at 49.7 in September, up from 47.2 in August. Anything below 50 indicates contraction in demand for architects' services.
Note: This includes commercial and industrial facilities like hotels and office buildings, multi-family residential, as well as schools, hospitals and other institutions.
According to the AIA, there is an "approximate nine to twelve month lag time between architecture billings and construction spending" on non-residential construction. This index has been positive for 8 of the previous 12 months, suggesting some further increase in CRE investment in 2019 - but all four negative reading have been in the last 7 months, and might suggest some decline in CRE investment in 2020.
FHFA House Price Index Up 0.2 Percent in August; Up 4.6 Percent from Last Year
by Calculated Risk on 10/23/2019 09:15:00 AM
From the FHFA: FHFA House Price Index Up 0.2 Percent in August; Up 4.6 Percent from Last Year
U.S. house prices rose in August, up 0.2 percent from the previous month, according to the Federal Housing Finance Agency (FHFA) House Price Index (HPI). House prices rose 4.6 percent from August 2018 to August 2019. The previously reported 0.4 percent increase for July 2019 remains unchanged.This is for purchase only, and for "single-family properties whose mortgages have been purchased or securitized by Fannie Mae or Freddie Mac". This is down from 5.1% Year-over-year in July.
For the nine census divisions, seasonally adjusted monthly house price changes from July 2019 to August 2019 ranged from -0.8 percent in the East South Central division to +0.9 percent in the New England division. The 12-month changes were all positive, ranging from +3.9 percent in the Middle Atlantic and Pacific divisions to +6.5 percent in the Mountain division.
MBA: Mortgage Applications Decreased in Latest Weekly Survey
by Calculated Risk on 10/23/2019 07:00:00 AM
From the MBA: Mortgage Applications Decrease in Latest MBA Weekly Survey
Mortgage applications decreased 11.9 percent from one week earlier, according to data from the Mortgage Bankers Association’s (MBA) Weekly Mortgage Applications Survey for the week ending October 18, 2019.
... The Refinance Index decreased 17 percent from the previous week and was 126 percent higher than the same week one year ago. The seasonally adjusted Purchase Index decreased 4 percent from one week earlier. The unadjusted Purchase Index decreased 4 percent compared with the previous week and was 6 percent higher than the same week one year ago.
...
“Interest rates continue to be volatile, with Brexit votes and ongoing trade negotiations swinging rates higher or lower on any given day. Last week, mortgage rates jumped 10 basis points and were above 4 percent for the first time since September,” said Mike Fratantoni, MBA Senior Vice President and Chief Economist. “The increase in mortgage rates caused refinance applications to drop 17 percent, and by more than 20 percent for conventional loans. Borrowers with larger loans are the most sensitive to rate changes, and with rates climbing higher last week, the average size of a refinance loan application fell to its lowest level this year.”
Added Fratantoni, “Although purchase applications declined, application volume is still running about 6 percent ahead of this time last year. Low mortgage rates continue to fuel buyer interest, but supply and affordability challenges persist.”
...
The average contract interest rate for 30-year fixed-rate mortgages with conforming loan balances ($484,350 or less) increased to 4.02 percent from 3.92 percent, with points increasing to 0.38 from 0.35 (including the origination fee) for 80 percent loan-to-value ratio (LTV) loans.
emphasis added
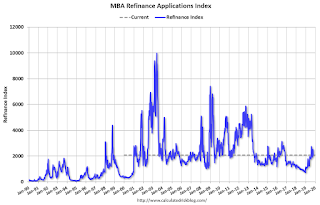
 Click on graph for larger image.
The first graph shows the refinance index since 1990.
With lower rates, we saw a sharp increase in refinance activity - but declined this week with higher rates. Mortgage rates would have to decline further to see a huge refinance boom.
 The second graph shows the MBA mortgage purchase index
According to the MBA, purchase activity is up 6% year-over-year.
Tuesday, October 22, 2019
Wednesday: FHFA House Prices, Architecture Billings Index
by Calculated Risk on 10/22/2019 08:18:00 PM
Wednesday:
• At 7:00 AM ET: The Mortgage Bankers Association (MBA) will release the results for the mortgage purchase applications index.
• At 9:00 AM: FHFA House Price Index for August 2018. This was originally a GSE only repeat sales, however there is also an expanded index.
• At During the day: The AIA's Architecture Billings Index for September (a leading indicator for commercial real estate).
NMHC: Apartment Market Tightness Index indicates tighter conditions in October
by Calculated Risk on 10/22/2019 04:28:00 PM
The National Multifamily Housing Council (NMHC) released the data for the October report: NMHC Quarterly Survey of Apartment Conditions (October 2019)
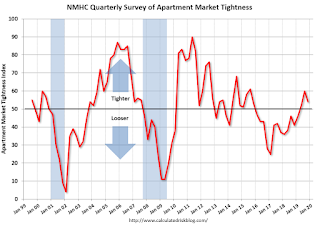
The Market Tightness Index decreased from 60 to 54. Any reading above 50 indicates tighter conditions from the previous quarter.
This indicates tighter market conditions for the third straight quarter.
Click on graph for larger image.
This graph shows the quarterly Apartment Tightness Index. This indicates market conditions were tighter over the last quarter.
This is the third consecutive reading over 50, following thirteen consecutive quarterly surveys indicating looser conditions.
Richmond Fed: "Manufacturing Activity Strengthened in October"
by Calculated Risk on 10/22/2019 02:01:00 PM
Earlier from the Richmond Fed: Manufacturing Activity Strengthened in October
Fifth District manufacturing activity strengthened in October, according to the most recent survey from the Federal Reserve Bank of Richmond. The composite index rose from −9 in September to 8 in October, as all three components — shipments, new orders, and employment — increased. Manufacturing firms also reported an increase in backlog of orders and improved local business conditions. Respondents were optimistic that conditions would continue to improve in the next six months.This was a better report - but not strong.
Many survey respondents saw growth in employment and wages in October and expected continued growth in the near term. However, manufacturers still struggled to find workers with the necessary skills in October and expected this difficulty to persist in the coming months.
emphasis added
Comments on September Existing Home Sales
by Calculated Risk on 10/22/2019 11:00:00 AM
Earlier: NAR: Existing-Home Sales Decreased to 5.38 million in September
A few key points:
1) Existing home sales were up 3.9% year-over-year (YoY) in September. This was the third consecutive YoY increase - following 16 consecutive months with a YoY decrease in sales
2) Inventory is still low, and was down 2.7% year-over-year (YoY) in September.
3) As usual, housing economist Tom Lawler's forecast was closer to the NAR report than the consensus. See: Lawler: Early Read on Existing Home Sales in September. The consensus was for sales of 5.45 million SAAR. Lawler estimated the NAR would report 5.36 million SAAR in September, and the NAR actually reported 5.38 million SAAR.

4) Year-to-date sales are down about 1.7% compared to the same period in 2018. On an annual basis, that would put sales around 5.25 million in 2019. Sales slumped at the end of 2018 and in January 2019 due to higher mortgage rates, the stock market selloff, and fears of an economic slowdown.
The comparisons will be easier towards in Q4 of this year, and with lower mortgage rates, sales will probably finish the year unchanged or even up from 2018.

Sales NSA in September (452,000, red column) were well above sales in September 2018 (421,000, NSA). However there were more selling days in September 2019 than in 2018.
Overall this was a solid report.
NAR: Existing-Home Sales Decreased to 5.38 million in September
by Calculated Risk on 10/22/2019 10:12:00 AM
From the NAR: Existing-Home Sales Decrease 2.2% in September
Existing-home sales receded in September following two consecutive months of increases, according to the National Association of Realtors®. Each of the four major regions witnessed sales drop off last month, with the Midwest absorbing the brunt of those declines.
Total existing-home sales, completed transactions that include single-family homes, townhomes, condominiums and co-ops, fell 2.2% from August to a seasonally adjusted annual rate of 5.38 million in September. Despite the decline, overall sales are up 3.9% from a year ago (5.18 million in September 2018).
...
Total housing inventory at the end of September sat at 1.83 million, approximately equal to the amount of existing-homes available for sale in August, but a 2.7% decrease from 1.88 million one year ago. Unsold inventory is at a 4.1-month supply at the current sales pace, up from 4.0 months in August and down from the 4.4-month figure recorded in September 2018.
emphasis added
 Click on graph for larger image.
This graph shows existing home sales, on a Seasonally Adjusted Annual Rate (SAAR) basis since 1993.
Sales in September (5.38 million SAAR) were down 2.2% from last month, and were 3.9% above the September 2018 sales rate.
The second graph shows nationwide inventory for existing homes.
 According to the NAR, inventory was unchanged at 1.83 million in September from 1.83 million in August. Headline inventory is not seasonally adjusted, and inventory usually decreases to the seasonal lows in December and January, and peaks in mid-to-late summer.
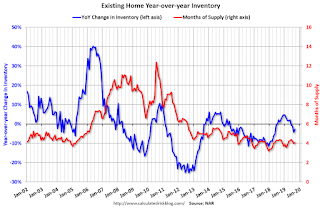
The last graph shows the year-over-year (YoY) change in reported existing home inventory and months-of-supply. Since inventory is not seasonally adjusted, it really helps to look at the YoY change. Note: Months-of-supply is based on the seasonally adjusted sales and not seasonally adjusted inventory.
 Inventory was down 2.7% year-over-year in September compared to September 2018.
 Months of supply increased to 4.1 months in September.
This was below the consensus forecast. For existing home sales, a key number is inventory - and inventory is still low. I'll have more later …
Monday, October 21, 2019
Tuesday: Existing Home Sales, Richmond Fed Mfg
by Calculated Risk on 10/21/2019 09:02:00 PM
From Matthew Graham at Mortgage News Daily: Highest Mortgage Rates in More Than a Month
Mortgage rates may have managed to remain mostly flat last week, but they did so near their highest levels in several weeks. After moving up at a moderate pace today, they're now at the highest levels in just over a month. After being as low as 3.375-3.5% for a top tier conventional 30yr fixed quote in early September, the average lender is now roughly 0.5% higher in rate. [Most Prevalent Rates 30YR FIXED 3.75-3.875%]Tuesday:
emphasis added
• At 10:00 AM ET, Existing Home Sales for September from the National Association of Realtors (NAR). The consensus is for 5.45 million SAAR, down from 5.49 million in August. Housing economist Tom Lawler expects the NAR to report 5.36 million SAAR.
• Also at 10:00 AM, Richmond Fed Survey of Manufacturing Activity for October.


