 RSS Feed
 by Calculated Risk on 4/22/2019 02:17:00 PM
Monday, April 22, 2019
Comments on March Existing Home Sales
Earlier: NAR: Existing-Home Sales Decreased to 5.21 million in March
A few key points:
1) The key for housing - and the overall economy - is new home sales, single family housing starts and overall residential investment.
Overall, this is still a somewhat reasonable level for existing home sales. No worries.
2) Inventory is still low, and was only up 2.4% year-over-year (YoY) in March. This was the eighth consecutive month with a year-over-year increase in inventory, although the YoY increase was smaller in March than in the five previous months.
 Click on graph for larger image.
3) Year-to-date sales are down about 6.5% compared to the same period in 2018. On an annual basis, that would put sales around 5 million in 2019. Sales slumped at the end of 2018 and in January 2019 due to higher mortgage rates, the stock market selloff, and fears of an economic slowdown (unfounded).
The comparisons will be easier towards the end of the year.
 The second graph shows existing home sales Not Seasonally Adjusted (NSA).
Sales NSA in March (400,000, red column) were below sales in March 2018 (434,000, NSA), and sales were the lowest for March since 2014.
NAR: Existing-Home Sales Decreased to 5.21 million in March
by Calculated Risk on 4/22/2019 10:14:00 AM
From the NAR: Existing-Home Sales Slide 4.9% in March
Existing-home sales retreated in March, following February’s surge of sales, according to the National Association of Realtors®. Each of the four major U.S. regions saw a drop-off in sales, with the Midwest enduring the largest decline last month.
Total existing-home sales, completed transactions that include single-family homes, townhomes, condominiums and co-ops, fell 4.9% from February to a seasonally adjusted annual rate of 5.21 million in March. Sales as a whole are down 5.4% from a year ago (5.51 million in March 2018).
...
Total housing inventory at the end of March increased to 1.68 million, up from 1.63 million existing homes available for sale in February and a 2.4% increase from 1.64 million a year ago. Unsold inventory is at a 3.9-month supply at the current sales pace, up from 3.6 months in February and up from 3.6 months in March 2018.
emphasis added
 Click on graph for larger image.
This graph shows existing home sales, on a Seasonally Adjusted Annual Rate (SAAR) basis since 1993.
Sales in February (5.21 million SAAR) were down 4.9% from last month, and were 5.4% below the March 2018 sales rate.
The second graph shows nationwide inventory for existing homes.
 According to the NAR, inventory increased to 1.68 million in March from 1.63 million in January. Headline inventory is not seasonally adjusted, and inventory usually decreases to the seasonal lows in December and January, and peaks in mid-to-late summer.
The last graph shows the year-over-year (YoY) change in reported existing home inventory and months-of-supply. Since inventory is not seasonally adjusted, it really helps to look at the YoY change. Note: Months-of-supply is based on the seasonally adjusted sales and not seasonally adjusted inventory.
 Inventory was up 2.4% year-over-year in March compared to March 2018.
 Months of supply was at 3.9 months in March.
This was below the consensus forecast. For existing home sales, a key number is inventory - and inventory is still low, but appears to have bottomed. I'll have more later ...
Chicago Fed "Index Points to a Pickup in Economic Growth in March"
by Calculated Risk on 4/22/2019 08:37:00 AM
From the Chicago Fed: Index Points to a Pickup in Economic Growth in March
Led by improvements in employment-related indicators, the Chicago Fed National Activity Index (CFNAI) rose to –0.15 in March from –0.31 in February. Three of the four broad categories of indicators that make up the index increased from February, but three of the four categories made negative contributions to the index in March. The index’s three-month moving average, CFNAI-MA3, moved down to –0.24 in March from –0.18 in FebruaryThis graph shows the Chicago Fed National Activity Index (three month moving average) since 1967.
emphasis added
 Click on graph for larger image.
This suggests economic activity was below the historical trend in March (using the three-month average).
According to the Chicago Fed:
The index is a weighted average of 85 indicators of growth in national economic activity drawn from four broad categories of data: 1) production and income; 2) employment, unemployment, and hours; 3) personal consumption and housing; and 4) sales, orders, and inventories.
...
A zero value for the monthly index has been associated with the national economy expanding at its historical trend (average) rate of growth; negative values with below-average growth (in standard deviation units); and positive values with above-average growth.
Sunday, April 21, 2019
Monday: Existing Home Sales
by Calculated Risk on 4/21/2019 09:05:00 PM
Weekend:
• Schedule for Week of April 21, 2019
Monday:
• At 8:30 AM ET, Chicago Fed National Activity Index for March. This is a composite index of other data.
• At 10:00 AM: Existing Home Sales for March from the National Association of Realtors (NAR). The consensus is for 5.30 million SAAR, down from 5.51 million. Housing economist Tom Lawler expects the NAR to report sales of 5.40 million SAAR for March.
From CNBC: Pre-Market Data and Bloomberg futures: S&P 500 are up 4 and DOW futures are up 40 (fair value).
Oil prices were up over the last week with WTI futures at $64.67 per barrel and Brent at $72.65 per barrel. A year ago, WTI was at $68, and Brent was at $75 - so oil prices are down slightly year-over-year.
Here is a graph from Gasbuddy.com for nationwide gasoline prices. Nationally prices are at $2.83 per gallon. A year ago prices were at $2.75 per gallon, so gasoline prices are up 8 cents per gallon year-over-year.
Hotels: Occupancy Rate Increased Year-over-year
by Calculated Risk on 4/21/2019 08:11:00 AM
From HotelNewsNow.com: STR: US hotel results for week ending 13 April
The U.S. hotel industry reported positive year-over-year results in the three key performance metrics during the week of 7-13 April 2019, according to data from STR.The following graph shows the seasonal pattern for the hotel occupancy rate using the four week average.
In comparison with the week of 8-14 April 2018, the industry recorded the following:
• Occupancy: +2.4% to 69.9%
• Average daily rate (ADR): +4.4% to US$136.25
• Revenue per available room (RevPAR): +6.9% to US$95.22
emphasis added
 Click on graph for larger image.
The red line is for 2019, dash light blue is 2018, blue is the median, and black is for 2009 (the worst year probably since the Great Depression for hotels).
A decent start for 2019 - close, to-date, compared to the previous 4 years.
Seasonally, the occupancy rate will mostly move sideways during the Spring travel season, and then increase during the Summer.
Data Source: STR, Courtesy of HotelNewsNow.com
Saturday, April 20, 2019
Schedule for Week of April 21, 2019
by Calculated Risk on 4/20/2019 08:11:00 AM
The key reports this week are the advance estimate of Q1 GDP, and March New and Existing Home Sales.
For manufacturing, the April Richmond and Kansas City manufacturing surveys will be released.
8:30 AM ET: Chicago Fed National Activity Index for March. This is a composite index of other data.
 10:00 AM: Existing Home Sales for March from the National Association of Realtors (NAR). The consensus is for 5.30 million SAAR, down from 5.51 million.
The graph shows existing home sales from 1994 through the report last month.
Housing economist Tom Lawler expects the NAR to report sales of 5.40 million SAAR for March.
9:00 AM: FHFA House Price Index for February 2019. This was originally a GSE only repeat sales, however there is also an expanded index.
 10:00 AM: New Home Sales for March from the Census Bureau.
 This graph shows New Home Sales since 1963. The dashed line is the sales rate for last month.
The consensus is for 645 thousand SAAR, down from 667 thousand in February.
10:00 AM: Richmond Fed Survey of Manufacturing Activity for April.
7:00 AM ET: The Mortgage Bankers Association (MBA) will release the results for the mortgage purchase applications index.
8:30 AM: The initial weekly unemployment claims report will be released. The consensus is for 200 thousand initial claims, up from 192 thousand the previous week.
8:30 AM: Durable Goods Orders for March from the Census Bureau. The consensus is for a 0.8% increase in durable goods orders.
10:00 AM: the Q1 2019 Housing Vacancies and Homeownership from the Census Bureau.
8:30 AM: Gross Domestic Product, 1st quarter 2019 (Advance estimate). The consensus is that real GDP increased 2.0% annualized in Q1, down from 2.2% in Q4.
10:00 AM: University of Michigan's Consumer sentiment index (Final for April). The consensus is for a reading of 97.1.
Friday, April 19, 2019
Q1 GDP Forecasts: Around 2%
by Calculated Risk on 4/19/2019 11:57:00 AM
From Merrill Lynch:
Despite various distortions to begin 2019 (Government shutdown, inclement weather), we expect real GDP growth in the first quarter to be a solid 2.4% qoq saar, up slightly from 4Q 2018. [April 19 estimate]From the NY Fed Nowcasting Report
emphasis added
The New York Fed Staff Nowcast stands at 1.4% for 2019:Q1 and 1.9% for 2019:Q2. [Apr 19 estimate].And from the Altanta Fed: GDPNow
The GDPNow model estimate for real GDP growth (seasonally adjusted annual rate) in the first quarter of 2019 is 2.8 percent on April 19, unchanged from April 18 after rounding. After this morning’s new residential construction report from the U.S. Census Bureau, the nowcast of first-quarter real residential investment growth inched down from 4.0 percent to 3.5 percent. [Apr 19 estimate]CR Note: These estimates suggest real GDP growth will be around 2% annualized in Q1.
Comments on February Housing Starts
by Calculated Risk on 4/19/2019 11:31:00 AM
Earlier: Housing Starts Decreased to 1.139 Million Annual Rate in March
Total housing starts in March were below expectations, however starts for January and February, combined, were revised up slightly.
The housing starts report released this morning showed starts were down 0.3% in March compared to February, and starts were down 14.2% year-over-year compared to March 2018.
Single family starts were down 11.0% year-over-year, and multi-family starts were down 21.8%.
This first graph shows the month to month comparison for total starts between 2018 (blue) and 2019 (red).
 Click on graph for larger image.
Starts were down 14.1% in March compared to March 2018.
The year-over-year weakness in March was in both the single family and multi-family sectors.
Last year, in 2018, starts were strong early in the year, and then fell off in the 2nd half - so the early comparisons this year are the most difficult.
My guess is starts will be down slightly year-over-year in 2019 compared to 2018, but nothing like the YoY decline we've seen in February and March.
Below is an update to the graph comparing multi-family starts and completions. Since it usually takes over a year on average to complete a multi-family project, there is a lag between multi-family starts and completions. Completions are important because that is new supply added to the market, and starts are important because that is future new supply (units under construction is also important for employment).
These graphs use a 12 month rolling total for NSA starts and completions.
 The blue line is for multifamily starts and the red line is for multifamily completions.
The rolling 12 month total for starts (blue line) increased steadily for several years following the great recession - but turned down, and has moved sideways recently. Completions (red line) had lagged behind - however completions and starts are at about the same level now.
As I've been noting for a few years, the significant growth in multi-family starts is behind us - multi-family starts peaked in June 2015 (at 510 thousand SAAR).
 The second graph shows single family starts and completions. It usually only takes about 6 months between starting a single family home and completion - so the lines are much closer. The blue line is for single family starts and the red line is for single family completions.
Note the relatively low level of single family starts and completions. The "wide bottom" was what I was forecasting following the recession, and now I expect some further increases in single family starts and completions.
BLS: Unemployment Rates at New Series Lows in North Dakota, Kentucky, Pennsylvania and Vermont
by Calculated Risk on 4/19/2019 10:11:00 AM
From the BLS: Regional and State Employment and Unemployment Summary
Unemployment rates were lower in March in 6 states, higher in 3 states, and stable in 41 states and the District of Columbia, the U.S. Bureau of Labor Statistics reported today.
...
North Dakota and Vermont had the lowest unemployment rates in March, 2.3 percent each. The rates in these two states, as well as those in Kentucky (4.0 percent) and Pennsylvania (3.9 percent), set new series lows. (All state series begin in 1976.) Alaska had the highest jobless rate, 6.5 percent.
emphasis added
 Click on graph for larger image.
This graph shows the number of states (and D.C.) with unemployment rates at or above certain levels since January 1976.
At the worst of the great recession, there were 11 states with an unemployment rate at or above 11% (red).
Currently only one state, Alaska, has an unemployment rate at or above 6% (dark blue). Note that the series low for Alaska is above 6%. Four states and the D.C. have unemployment rates above 5%; Alaska, Arizona, New Mexico and West Virginia.
A total of nine states are at the series low.
Housing Starts Decreased to 1.139 Million Annual Rate in March
by Calculated Risk on 4/19/2019 08:42:00 AM
From the Census Bureau: Permits, Starts and Completions
Housing Starts:
Privately‐owned housing starts in March were at a seasonally adjusted annual rate of 1,139,000. This is 0.3 percent below the revised February estimate of 1,142,000 and is 14.2 percent below the March 2018 rate of 1,327,000. Single‐family housing starts in March were at a rate of 785,000; this is 0.4 percent below the revised February figure of 788,000. The March rate for units in buildings with five units or more was 337,000.
Building Permits:
Privately‐owned housing units authorized by building permits in March were at a seasonally adjusted annual rate of 1,269,000. This is 1.7 percent below the revised February rate of 1,291,000 and is 7.8 percent below the March 2018 rate of 1,377,000. Single‐family authorizations in March were at a rate of 808,000; this is 1.1 percent below the revised February figure of 817,000. Authorizations of units in buildings with five units or more were at a rate of 425,000 in March.
emphasis added
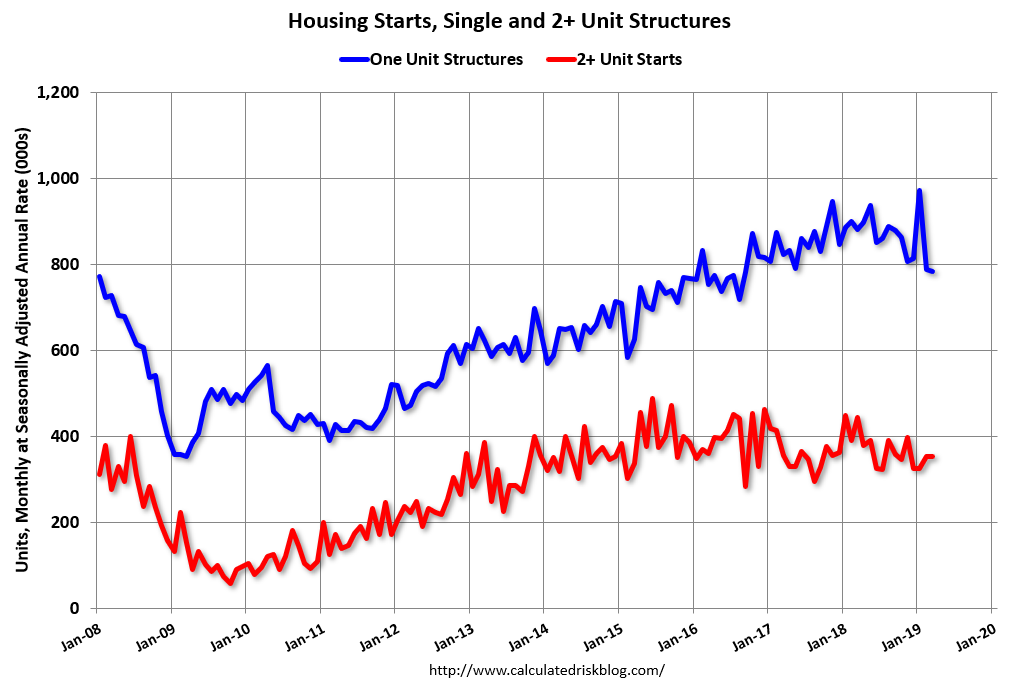 Click on graph for larger image.
The first graph shows single and multi-family housing starts for the last several years.
Multi-family starts (red, 2+ units) were unchanged in March compared to February. Multi-family starts were down 20% year-over-year in March.
Multi-family is volatile month-to-month, and has been mostly moving sideways the last few years.
Single-family starts (blue) decreased in March, and were down 11% year-over-year.
 The second graph shows total and single unit starts since 1968.
 The second graph shows the huge collapse following the housing bubble, and then eventual recovery (but still historically low).
Total housing starts in March were below expectations. Starts for February were revised down, and starts for January were revised up.
I'll have more later …


