by Calculated Risk on 2/14/2019 02:59:00 PM
Thursday, February 14, 2019
Q4 GDP Estimates Revised Down Sharply
Following the weak retail sales report, Q4 GDP estimates have been revised down.
From Goldman Sachs:
The retail sales report indicated a considerably weaker pace of fourth quarter consumption growth than we had previously assumed. Reflecting this and lower-than-expected November business inventories, we lowered our Q4 GDP tracking estimate by five tenths to +2.0% (qoq ar).From Merrill Lynch:
Weak retail sales data and inventory build caused a 0.8pp decline in our 4Q GDP tracking estimate to 1.5% from 2.3%
LA area Port Traffic in January; Imports Up YoY, Exports Down
by Calculated Risk on 2/14/2019 11:39:00 AM
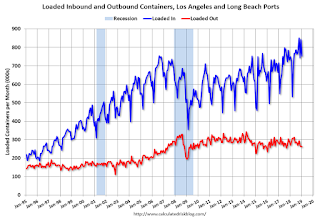
Container traffic gives us an idea about the volume of goods being exported and imported - and usually some hints about the trade report since LA area ports handle about 40% of the nation's container port traffic.
The following graphs are for inbound and outbound traffic at the ports of Los Angeles and Long Beach in TEUs (TEUs: 20-foot equivalent units or 20-foot-long cargo container).
To remove the strong seasonal component for inbound traffic, the first graph shows the rolling 12 month average.

On a rolling 12 month basis, inbound traffic was up 0.1% in January compared to the rolling 12 months ending in December. Outbound traffic was down 0.2% compared to the rolling 12 months ending the previous month.
The 2nd graph is the monthly data (with a strong seasonal pattern for imports).

In general imports have been increasing, and exports have mostly moved sideways over the last 8 years.
Retail Sales decreased 1.2% in December
by Calculated Risk on 2/14/2019 09:37:00 AM
Note: This release is for December (not January). The Census Bureau is working to catch up following the government shutdown.
On a monthly basis, retail sales decreased 1.2 percent from November to December (seasonally adjusted), and sales were up 2.3 percent from December 2017.
From the Census Bureau report:
Advance estimates of U.S. retail and food services sales for December 2018, adjusted for seasonal variation and holiday and trading-day differences, but not for price changes, were $505.8 billion, a decrease of 1.2 percent from the previous month, but 2.3 percent above December 2017.
 Click on graph for larger image.
This graph shows retail sales since 1992. This is monthly retail sales and food service, seasonally adjusted (total and ex-gasoline).
Retail sales ex-gasoline were down 0.9% in December.
The second graph shows the year-over-year change in retail sales and food service (ex-gasoline) since 1993.
 Retail and Food service sales, ex-gasoline, increased by 2.9% on a YoY basis.
The decrease in December was below expectations; sales in October and November were revised down significantly.
Weekly Initial Unemployment Claims increased to 239,000
by Calculated Risk on 2/14/2019 09:24:00 AM
The DOL reported:
In the week ending February 9, the advance figure for seasonally adjusted initial claims was 239,000, an increase of 4,000 from the previous week's revised level. The previous week's level was revised up by 1,000 from 234,000 to 235,000. The 4-week moving average was 231,750, an increase of 6,750 from the previous week's revised average. This is the highest level for this average since January 27, 2018 when it was 234,000. The previous week's average was revised up by 250 from 224,750 to 225,000.The previous week was revised up.
emphasis added
The following graph shows the 4-week moving average of weekly claims since 1971.
 Click on graph for larger image.
The dashed line on the graph is the current 4-week average. The four-week average of weekly unemployment claims increased to 231,750.
This was higher than the consensus forecast.
Wednesday, February 13, 2019
Thursday: Unemployment Claims, Retail Sales, PPI
by Calculated Risk on 2/13/2019 06:44:00 PM
Thursday:
• At 8:30 AM ET, The initial weekly unemployment claims report will be released. The consensus is for 225 thousand initial claims, down from 234 thousand the previous week.
• Also at 8:30 AM, The Producer Price Index for January from the BLS. The consensus is for a 0.2% increase in PPI, and a 0.2% increase in core PPI.
• Also at 8:30 AM: Retail sales for December is scheduled to be released. The consensus is for a 0.1% increase in retail sales.
Houston Real Estate in January: Sales declined 8% YoY, Inventory Up 17%
by Calculated Risk on 2/13/2019 02:24:00 PM
Houston set a record for sales in 2018. However, the year ended soft, and with lower oil prices - in addition to higher mortgage rates - 2019 is off to a slow start.
From the HAR: Houston's Housing Market Cools in January
Fresh on the heels of a record-breaking 2018, home sales across greater Houston began the new year at a dramatically slower pace. Sales volume fell in all pricing segments in January, including the luxury home market, which saw its first decline in 12 months. However, rental activity was strong, and inventory levels continued expanding, providing consumers with more choices in the lead-up to the traditionally busy spring buying season.
According to the latest monthly report from the Houston Association of Realtors® (HAR), 4,100 single-family homes sold in January compared to 4,462 a year earlier. That represents an 8.1 percent decline – the third straight month of falling sales.
...
“January appears to have delivered a perfect economic storm of sorts, with some consumers focused on paying off holiday credit card bills, others concerned about the recent bump in mortgage rates and still others that may have felt the squeeze from the partial government shutdown,” said HAR Chair Shannon Cobb Evans with Heritage Texas Properties. “We are encouraged by the strong performance among rental properties, and I believe that as inventory levels continue to grow, more buyers will return to the market.”
...
Total active listings, or the total number of available properties, climbed 16.8 percent to 38,872.
Inventory registered a 3.7-months supply. That is up from 3.2 months a year earlier ...
emphasis added
Key Measures Show Inflation lower in January than in December on a YoY basis
by Calculated Risk on 2/13/2019 11:17:00 AM
The Cleveland Fed released the median CPI and the trimmed-mean CPI this morning:
According to the Federal Reserve Bank of Cleveland, the median Consumer Price Index rose 0.3% (3.2% annualized rate) in January. The 16% trimmed-mean Consumer Price Index rose 0.2% (2.3% annualized rate) during the month. The median CPI and 16% trimmed-mean CPI are measures of core inflation calculated by the Federal Reserve Bank of Cleveland based on data released in the Bureau of Labor Statistics' (BLS) monthly CPI report.Note: The Cleveland Fed released the median CPI details for January here. Motor fuel was down 49% annualized in January.
Earlier today, the BLS reported that the seasonally adjusted CPI for all urban consumers was unchanged (-0.2% annualized rate) in January. The CPI less food and energy rose 0.2% (2.9% annualized rate) on a seasonally adjusted basis.
 Click on graph for larger image.
This graph shows the year-over-year change for these four key measures of inflation. On a year-over-year basis, the median CPI rose 2.7%, the trimmed-mean CPI rose 2.2%, and the CPI less food and energy rose 2.2%. Core PCE is for November and increased 1.9% year-over-year (note: December PCE has not been released yet due to government shutdown).
On a monthly basis, median CPI was at 3.2% annualized, trimmed-mean CPI was at 2.3% annualized, and core CPI was at 2.9% annualized.
Using these measures, inflation was lower in January than in December on a year-over-year basis. Overall, these measures are at or above the Fed's 2% target (Core PCE is below 2%).
BLS: CPI unchanged in January, Core CPI increased 0.2%
by Calculated Risk on 2/13/2019 08:38:00 AM
The Consumer Price Index for All Urban Consumers (CPI-U) was unchanged in January on a seasonally adjusted basis, the U.S. Bureau of Labor Statistics reported today. Over the last 12 months, the all items index increased 1.6 percent before seasonal adjustment.I'll post a graph later today after the Cleveland Fed releases the median and trimmed-mean CPI.
...
The index for all items less food and energy increased 0.2 percent in January for the fourth consecutive month.
..
The all items index increased 1.6 percent for the 12 months ending January, the smallest increase since the period ending June 2017. The index for all items less food and energy rose 2.2 percent over the last 12 months, the same increase as the 12 months ending November and December 2018.
emphasis added
MBA: Mortgage Applications Decrease in Latest Weekly Survey
by Calculated Risk on 2/13/2019 07:00:00 AM
From the MBA: Mortgage Applications Decrease in Latest MBA Weekly Survey
Mortgage applications decreased 3.7 percent from one week earlier, according to data from the Mortgage Bankers Association’s (MBA) Weekly Mortgage Applications Survey for the week ending February 8, 2019.
... The Refinance Index decreased 0.1 percent from the previous week. The seasonally adjusted Purchase Index decreased 6 percent from one week earlier. The unadjusted Purchase Index decreased 6 percent compared with the previous week and was 5 percent lower than the same week one year ago.
...
“Application activity fell last week – even with rates decreasing – as renewed uncertainty about the domestic and global economy likely held potential homebuyers off the market,” said Joel Kan, MBA’s Associate Vice President of Industry Surveys and Forecasts. “Despite the recent decline in applications, we still expect that the continued strength of the job market and lower rates will support more purchase activity in the coming months.”
Added Kan, “The 30-year fixed-rate mortgage dropped to its lowest level since last March, and was 52 basis points lower than its recent high last November. Government refinances provided a bright spark, picking up over 10 percent, as both FHA and VA refinancing activity saw increases over the week.”
...
The average contract interest rate for 30-year fixed-rate mortgages with conforming loan balances ($484,350 or less) decreased to 4.65 percent from 4.69 percent, with points decreasing to 0.43 from 0.45 (including the origination fee) for 80 percent loan-to-value ratio (LTV) loans.
emphasis added
 Click on graph for larger image.
The first graph shows the refinance index since 1990.
Rates would have to fall further for a significant increase in refinance activity.
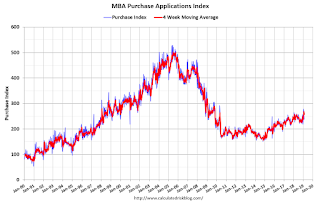
 The second graph shows the MBA mortgage purchase index
According to the MBA, purchase activity is down 5% year-over-year.
Tuesday, February 12, 2019
Wednesday: CPI
by Calculated Risk on 2/12/2019 06:44:00 PM
Wednesday:
• At 7:00 AM ET, The Mortgage Bankers Association (MBA) will release the results for the mortgage purchase applications index.
• At 8:30 AM, The Consumer Price Index for January from the BLS. The consensus is for 0.1% increase in CPI, and a 0.2% increase in core CPI.


