by Calculated Risk on 2/13/2019 02:24:00 PM
Wednesday, February 13, 2019
Houston Real Estate in January: Sales declined 8% YoY, Inventory Up 17%
Houston set a record for sales in 2018. However, the year ended soft, and with lower oil prices - in addition to higher mortgage rates - 2019 is off to a slow start.
From the HAR: Houston's Housing Market Cools in January
Fresh on the heels of a record-breaking 2018, home sales across greater Houston began the new year at a dramatically slower pace. Sales volume fell in all pricing segments in January, including the luxury home market, which saw its first decline in 12 months. However, rental activity was strong, and inventory levels continued expanding, providing consumers with more choices in the lead-up to the traditionally busy spring buying season.
According to the latest monthly report from the Houston Association of Realtors® (HAR), 4,100 single-family homes sold in January compared to 4,462 a year earlier. That represents an 8.1 percent decline – the third straight month of falling sales.
...
“January appears to have delivered a perfect economic storm of sorts, with some consumers focused on paying off holiday credit card bills, others concerned about the recent bump in mortgage rates and still others that may have felt the squeeze from the partial government shutdown,” said HAR Chair Shannon Cobb Evans with Heritage Texas Properties. “We are encouraged by the strong performance among rental properties, and I believe that as inventory levels continue to grow, more buyers will return to the market.”
...
Total active listings, or the total number of available properties, climbed 16.8 percent to 38,872.
Inventory registered a 3.7-months supply. That is up from 3.2 months a year earlier ...
emphasis added
Key Measures Show Inflation lower in January than in December on a YoY basis
by Calculated Risk on 2/13/2019 11:17:00 AM
The Cleveland Fed released the median CPI and the trimmed-mean CPI this morning:
According to the Federal Reserve Bank of Cleveland, the median Consumer Price Index rose 0.3% (3.2% annualized rate) in January. The 16% trimmed-mean Consumer Price Index rose 0.2% (2.3% annualized rate) during the month. The median CPI and 16% trimmed-mean CPI are measures of core inflation calculated by the Federal Reserve Bank of Cleveland based on data released in the Bureau of Labor Statistics' (BLS) monthly CPI report.Note: The Cleveland Fed released the median CPI details for January here. Motor fuel was down 49% annualized in January.
Earlier today, the BLS reported that the seasonally adjusted CPI for all urban consumers was unchanged (-0.2% annualized rate) in January. The CPI less food and energy rose 0.2% (2.9% annualized rate) on a seasonally adjusted basis.
 Click on graph for larger image.
This graph shows the year-over-year change for these four key measures of inflation. On a year-over-year basis, the median CPI rose 2.7%, the trimmed-mean CPI rose 2.2%, and the CPI less food and energy rose 2.2%. Core PCE is for November and increased 1.9% year-over-year (note: December PCE has not been released yet due to government shutdown).
On a monthly basis, median CPI was at 3.2% annualized, trimmed-mean CPI was at 2.3% annualized, and core CPI was at 2.9% annualized.
Using these measures, inflation was lower in January than in December on a year-over-year basis. Overall, these measures are at or above the Fed's 2% target (Core PCE is below 2%).
BLS: CPI unchanged in January, Core CPI increased 0.2%
by Calculated Risk on 2/13/2019 08:38:00 AM
The Consumer Price Index for All Urban Consumers (CPI-U) was unchanged in January on a seasonally adjusted basis, the U.S. Bureau of Labor Statistics reported today. Over the last 12 months, the all items index increased 1.6 percent before seasonal adjustment.I'll post a graph later today after the Cleveland Fed releases the median and trimmed-mean CPI.
...
The index for all items less food and energy increased 0.2 percent in January for the fourth consecutive month.
..
The all items index increased 1.6 percent for the 12 months ending January, the smallest increase since the period ending June 2017. The index for all items less food and energy rose 2.2 percent over the last 12 months, the same increase as the 12 months ending November and December 2018.
emphasis added
MBA: Mortgage Applications Decrease in Latest Weekly Survey
by Calculated Risk on 2/13/2019 07:00:00 AM
From the MBA: Mortgage Applications Decrease in Latest MBA Weekly Survey
Mortgage applications decreased 3.7 percent from one week earlier, according to data from the Mortgage Bankers Association’s (MBA) Weekly Mortgage Applications Survey for the week ending February 8, 2019.
... The Refinance Index decreased 0.1 percent from the previous week. The seasonally adjusted Purchase Index decreased 6 percent from one week earlier. The unadjusted Purchase Index decreased 6 percent compared with the previous week and was 5 percent lower than the same week one year ago.
...
“Application activity fell last week – even with rates decreasing – as renewed uncertainty about the domestic and global economy likely held potential homebuyers off the market,” said Joel Kan, MBA’s Associate Vice President of Industry Surveys and Forecasts. “Despite the recent decline in applications, we still expect that the continued strength of the job market and lower rates will support more purchase activity in the coming months.”
Added Kan, “The 30-year fixed-rate mortgage dropped to its lowest level since last March, and was 52 basis points lower than its recent high last November. Government refinances provided a bright spark, picking up over 10 percent, as both FHA and VA refinancing activity saw increases over the week.”
...
The average contract interest rate for 30-year fixed-rate mortgages with conforming loan balances ($484,350 or less) decreased to 4.65 percent from 4.69 percent, with points decreasing to 0.43 from 0.45 (including the origination fee) for 80 percent loan-to-value ratio (LTV) loans.
emphasis added
 Click on graph for larger image.
The first graph shows the refinance index since 1990.
Rates would have to fall further for a significant increase in refinance activity.
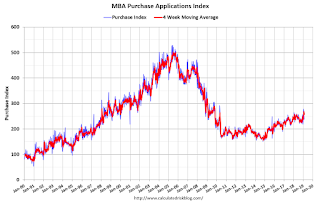
 The second graph shows the MBA mortgage purchase index
According to the MBA, purchase activity is down 5% year-over-year.
Tuesday, February 12, 2019
Wednesday: CPI
by Calculated Risk on 2/12/2019 06:44:00 PM
Wednesday:
• At 7:00 AM ET, The Mortgage Bankers Association (MBA) will release the results for the mortgage purchase applications index.
• At 8:30 AM, The Consumer Price Index for January from the BLS. The consensus is for 0.1% increase in CPI, and a 0.2% increase in core CPI.
NY Fed Q4 Report: "Total Household Debt Rises as 2018 Marks the Ninth Year of Annual Growth in New Auto Loans"
by Calculated Risk on 2/12/2019 12:38:00 PM
From the NY Fed: Total Household Debt Rises as 2018 Marks the Ninth Year of Annual Growth in New Auto Loans
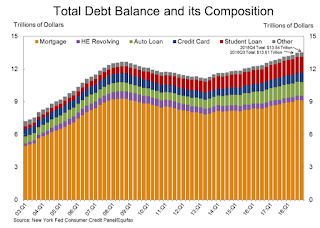
The Federal Reserve Bank of New York’s Center for Microeconomic Data today issued its Quarterly Report on Household Debt and Credit, which shows that total household debt increased by $32 billion (0.2%) to $13.54 trillion in the fourth quarter of 2018. It was the 18th consecutive quarter with an increase and the total is now $869 billion higher than the previous peak of $12.68 trillion in the third quarter of 2008. Furthermore, overall household debt is now 21.4% above the post-financial-crisis trough reached during the second quarter of 2013. The Report is based on data from the New York Fed’s Consumer Credit Panel, a nationally representative sample of individual- and household-level debt and credit records drawn from anonymized Equifax credit data.
...
Mortgage originations declined to $401 billion from $445 billion, the lowest level seen in nearly four years.
Mortgage delinquencies were roughly flat, with 1.1% of mortgage balances 90 or more days delinquent.
emphasis added
 Click on graph for larger image.
Here are two graphs from the report:
The first graph shows aggregate consumer debt increased in Q4. Household debt previously peaked in 2008, and bottomed in Q2 2013.
From the NY Fed:
Aggregate household debt balances ticked up in the fourth quarter of 2018 for the 18th consecutive quarter, and are now $869 billion (6.9%) higher than the previous (2008Q3) peak of $12.68 trillion. As of December 31, 2018, total household indebtedness was $13.54 trillion, a $32 billion (0.2%) increase from the third quarter of 2018. Overall household debt is now 21.4% above the 2013Q2 trough.
Mortgage balances shown on consumer credit reports on December 31 stood at $9.1 trillion, essentially unchanged from the third quarter of 2018. Balances on home equity lines of credit (HELOC) continued their declining trend from 2009 with a drop of $10 billion in the fourth quarter and are now at $412 billion, the lowest level seen in 14 years. Non-housing balances increased by $58 billion in the fourth quarter, with auto loans increasing by $9 billion, credit card balances going up by $26 billion, and student loan balances by $15 billion. The increase in credit card balances is consistent with seasonal patterns but marks the first time credit card balances re-touched the 2008 peak; card balances now stand at $870 billion.
 The second graph shows the percent of debt in delinquency. There is still a larger than normal percent of debt 90+ days delinquent (Yellow, orange and red).
The overall delinquency rate decreased slightly in Q4. From the NY Fed:
Aggregate delinquency rates remained steady in the fourth quarter of 2018. As of December 31, 4.7% of outstanding debt was in some stage of delinquency, unchanged from the third quarter. Of the $630 billion of debt that is delinquent, $416 billion is seriously delinquent (at least 90 days late or “severely derogatory”). The flow into 90+ day delinquency for credit card balances has been rising since 2017, while the flow into 90+ day delinquency for auto loan balances has been slowly trending upward since 2012.There is much more in the report.
About 195,000 consumers had a bankruptcy notation added to their credit reports in 2018Q4, five thousand fewer than the 200,000 individuals who filed in the 4th quarter of 2017. New bankruptcy notations have been at historically low levels since 2016.
BLS: Job Openings Increased to Series High 7.3 Million in December
by Calculated Risk on 2/12/2019 10:05:00 AM
Notes: In December there were 7.335 million job openings, and, according to the December Employment report, there were 6.294 million unemployed. So, for the ninth consecutive month, there were more job openings than people unemployed. Also note that the number of job openings has exceeded the number of hires since January 2015 (almost 4 years).
From the BLS: Job Openings and Labor Turnover Summary
The number of job openings reached a series high of 7.3 million on the last business day of December, the U.S. Bureau of Labor Statistics reported today. Over the month, hires and separations were little changed at 5.9 million and 5.5 million, respectively. Within separations, the quits rate was unchanged at 2.3 percent and the layoffs and discharges rate was little changed at 1.1 percent. ...The following graph shows job openings (yellow line), hires (dark blue), Layoff, Discharges and other (red column), and Quits (light blue column) from the JOLTS.
The number of quits was little changed in December at 3.5 million. The quits rate was 2.3 percent. The quits level was little changed for total private but decreased for government (-18,000).
emphasis added
This series started in December 2000.
Note: The difference between JOLTS hires and separations is similar to the CES (payroll survey) net jobs headline numbers. This report is for December, the most recent employment report was for January.
 Click on graph for larger image.
Note that hires (dark blue) and total separations (red and light blue columns stacked) are pretty close each month. This is a measure of labor market turnover. When the blue line is above the two stacked columns, the economy is adding net jobs - when it is below the columns, the economy is losing jobs.
Jobs openings increased in December to 7.335 million from 7.166 million in November.
The number of job openings (yellow) are up 29% year-over-year.
Quits are up 4% year-over-year. These are voluntary separations. (see light blue columns at bottom of graph for trend for "quits").
Job openings remain at a high level, and quits are still increasing year-over-year. This was a solid report.
Small Business Optimism Index decreased in January
by Calculated Risk on 2/12/2019 09:17:00 AM
CR Note: Most of this survey is noise, but there is some information, especially on the labor market and the "Single Most Important Problem".
From the National Federation of Independent Business (NFIB): January 2019 Report: Small Business Optimism Index
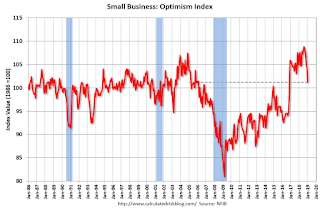
The NFIB Small Business Optimism Index slipped 3.2 points in January, as owners continued hiring and investing, but expressed rising concern about future economic growth. The 101.2 reading, the lowest since the weeks leading up to the 2016 elections, remains well above the historical average of 98, but indicates uncertainty among small business owners due to the 35-day government shutdown and financial market instability. The NFIB Uncertainty Index rose seven points to 86, the fifth highest reading in the survey’s 45-year history.
..
As reported in January’s NFIB Jobs Report, reports of higher worker compensation rose to the second highest level in the survey’s history to a net 36 percent of all firms. In 2018, nationwide wages increased 3.2 percent. Small business owners continue to hire at record levels, with 56 percent of owners reported hiring or trying to hire. However, 88 percent of those owners reported few or no qualified applicants for the positions.
Twenty-three percent of small business owners reported the availability of qualified labor as their top business problem
emphasis added
 Click on graph for larger image.
This graph shows the small business optimism index since 1986.
The index decreased to 101.2 in January.
Note: Usually small business owners complain about taxes and regulations (currently 2nd and 3rd on the "Single Most Important Problem" list). However, during the recession, "poor sales" was the top problem. Now the difficulty of finding qualified workers is the top problem.
Monday, February 11, 2019
Tuesday: Job Openings, Q4 Quarterly Report on Household Debt and Credit
by Calculated Risk on 2/11/2019 04:49:00 PM
From Matthew Graham at Mortgage News Daily: Low Rates Unfazed by a Bit of Market Weakness
Mortgage rates held their ground fairly well today, despite the fact that underlying bond markets were weaker.Tuesday:
...
All of the nuts and bolts above notwithstanding, the average lender remains in line with the lowest rates in a year. Only January 31st saw anything better, and it wasn't much better! [30YR FIXED 4.375 - 4.5%]
emphasis added
• At 6:00 AM ET, NFIB Small Business Optimism Index for January.
• At 10:00 AM, Job Openings and Labor Turnover Survey for December from the BLS. Jobs openings decreased in November to 6.888 million from 7.131 million in October.
• At 11:00 AM, NY Fed: Q4 Quarterly Report on Household Debt and Credit
• At 12:45 PM, Speech by Fed Chair Jerome Powell, Economic Development in High Poverty Rural Communities, At the Hope Enterprise Corporation Rural Policy Forum, Itta Bena, Miss.
"As more older Americans 'age in place,' millennials struggle to find homes"
by Calculated Risk on 2/11/2019 02:55:00 PM
Diana Olick at CNBC has an interesting article: As more older Americans 'age in place,' millennials struggle to find homes
With more seniors than ever aging in place and choosing not to sell the family home, an estimated 1.6 million fewer properties are now available in a market already experiencing a critical shortage, according to Freddie Mac.CR Note: If the Boomer's follow the behavior of the previous generations, many will stay in their homes ("age in place") until they are in their '80s (some until they pass away). Since the leading edge of the Boomer generation is only about 75 right now, it will still be a number of years before a large number of older people will move to retirement communities.
…
"We believe the additional demand for homeownership from seniors aging in place will increase the relative price of owning versus renting, making renting more attractive to younger generations," said Sam Khater, chief economist at Freddie Mac, who estimates that the current market needs about 2.5 million more homes to meet demand.
And, even when people move to retirement communities, many will not sell their homes. They will rent them instead - especially in the higher priced areas with significant capital gains - since they have to pay capital gains if they sell (above $250K exclusion for single, $500K for married), but the property steps up in value when they pass away. So they can leave the property to their kids with no taxes.
This could be fixed with policy changes. Either eliminate "step up" basis (take away the incentive to hold), or give older homeowners a one time unlimited exclusion (so they can sell while they are alive).
Aging in place is great for the senior, but what frequently happens, is a four bedroom house is occupied by just one person (inefficient). This is another area where zoning changes could help - let the senior sell her larger family home without tax consequences, and move to a smaller home in the same community (so they can keep their local ties).


