 RSS Feed
 by Calculated Risk on 10/31/2018 07:44:00 PM
Wednesday, October 31, 2018
Thursday: Unemployment Claims, ISM Mfg, Construction Spending
Thursday:
• At All day: Light vehicle sales for October. The consensus is for 17.0 million SAAR in October, down from the BEA estimate of 17.36 million SAAR in September 2018 (Seasonally Adjusted Annual Rate).
• At 8:30 AM: The initial weekly unemployment claims report will be released. The consensus is for 212 thousand initial claims, down from 215 thousand the previous week.
• At 10:00 AM: ISM Manufacturing Index for October. The consensus is for 59.1%, down from 59.8%. The PMI was at 59.8% in September, the employment index was at 58.8%, and the new orders index was at 61.8%.
• At 10:00 AM: Construction Spending for September. The consensus is for 0.3% increase in spending
Fannie Mae: Mortgage Serious Delinquency rate Unchanged in September
by Calculated Risk on 10/31/2018 04:15:00 PM
Fannie Mae reported that the Single-Family Serious Delinquency rate was unchanged at 0.82% in September, from 0.82% in August. The serious delinquency rate is down from 1.01% in September 2017.
These are mortgage loans that are "three monthly payments or more past due or in foreclosure".
The Fannie Mae serious delinquency rate peaked in February 2010 at 5.59%.
This ties last month as the lowest serious delinquency for Fannie Mae since September 2007.
 Click on graph for larger image
By vintage, for loans made in 2004 or earlier (3% of portfolio), 2.77% are seriously delinquent. For loans made in 2005 through 2008 (5% of portfolio), 4.90% are seriously delinquent, For recent loans, originated in 2009 through 2018 (92% of portfolio), only 0.34% are seriously delinquent. So Fannie is still working through poor performing loans from the bubble years.
The increase late last year in the delinquency rate was due to the hurricanes - there were no worries about the overall market.
I expect the serious delinquency rate will probably decline to 0.5 to 0.7 percent or so to a cycle bottom.
Note: Freddie Mac reported earlier.
Zillow Case-Shiller Forecast: Slower House Price Gains in September
by Calculated Risk on 10/31/2018 01:08:00 PM
The Case-Shiller house price indexes for August were released yesterday. Zillow forecasts Case-Shiller a month early, and I like to check the Zillow forecasts since they have been pretty close.
From Skylar Olsen at Zillow: August Case-Shiller Results and September Forecast: A Slowdown in Home Prices
The Case-Shiller home price index climbed 5.8 percent in August from a year earlier, marking the first time in 12 months that home price gains have dropped below 6 percent.The Zillow forecast is for the year-over-year change for the Case-Shiller National index to be smaller in September than in August as house price growth slows.
It’s more welcome news for would-be home buyers, who must be breathing a collective sigh of relief that home price growth finally has slowed. Softening appreciation after the rapid growth of just a few months earlier is a sign that fierce competition is dying down. Potential buyers who were intimidated during the heat of the market may find the breathing space now to make a calm, considered decision about whether to lock in a mortgage before rates rise further.
Zillow forecasts an even slower 5.5 percent annual gain for September.

Chicago PMI Decreased in October
by Calculated Risk on 10/31/2018 10:30:00 AM
From the Chicago PMI: Chicago Business Barometer Declines to to 58.4 in October
The MNI Chicago Business Barometer declined to 58.4 in October, the lowest reading since April, down 2.0 points from 60.4 in September.This was below the consensus forecast of 60.0, but still a decent reading.
Business activity continued to expand at a healthy rate this month, despite the pace of activity decelerating for the third month in a row. A decline in order book growth and unfinished orders more than offset a rise in output, delivery times and employment, sending the Barometer to its lowest reading in six months. On the year, the Barometer was down 10.7%, the biggest year-over-year fall since December 2015.
...
Hiring activity intensified this month, with the Employment indicator up for the first time since July. Firms continued to report ongoing difficulties recruiting both skilled and unskilled workers, while others prioritized retention of their existing workforce.
…
“The MNI Chicago Business Barometer continued to revert back towards trend-levels in October, cooling off after a hot and unsustainable run last year,” said Jamie Satchi, Economist at MNI Indicators.
“Production continues to be restrained by issues between firms and their suppliers, reflected by Supplier Deliveries at a 14-year high, while the latest raft of tariffs on Chinese goods appears to be exacerbating uncertainty across firms,” he added.
emphasis added
ADP: Private Employment increased 227,000 in October
by Calculated Risk on 10/31/2018 08:19:00 AM
Private sector employment increased by 227,000 jobs from September to October according to the October ADP National Employment Report®. ... The report, which is derived from ADP’s actual payroll data, measures the change in total nonfarm private employment each month on a seasonally-adjusted basis.This was above the consensus forecast for 180,000 private sector jobs added in the ADP report.
...
“Despite a significant shortage in skilled talent, the labor market continues to grow,” said Ahu Yildirmaz, vice president and co-head of the ADP Research Institute.”We saw significant gains across all industries with trade and leisure and hospitality leading the way. We continue to see larger employers benefit in this environment as they are more apt to provide the competitive wages and strong benefits employees desire.”
Mark Zandi, chief economist of Moody’s Analytics, said, “The job market bounced back strongly last month despite being hit by back-to-back hurricanes. Testimonial to the robust employment picture is the broad-based gains in jobs across industries. The only blemish is the struggles small businesses are having filling open job positions.”
The BLS report for October will be released Friday, and the consensus is for 190,000 non-farm payroll jobs added in October.
MBA: Mortgage Applications Decreased in Latest Weekly Survey
by Calculated Risk on 10/31/2018 07:00:00 AM
From the MBA: Mortgage Applications Decrease in Latest MBA Weekly Survey
Mortgage applications decreased 2.5 percent from one week earlier, according to data from the Mortgage Bankers Association’s (MBA) Weekly Mortgage Applications Survey for the week ending October 26, 2018.
... The Refinance Index decreased 4 percent from the previous week. The seasonally adjusted Purchase Index decreased 2 percent from one week earlier. The unadjusted Purchase Index decreased 2 percent compared with the previous week and was 0.4 percent lower than the same week one year ago. ...
The average contract interest rate for 30-year fixed-rate mortgages with conforming loan balances ($453,100 or less) remained unchanged at 5.11 percent, with points decreasing to 0.50 from 0.52 (including the origination fee) for 80 percent loan-to-value ratio (LTV) loans.
emphasis added
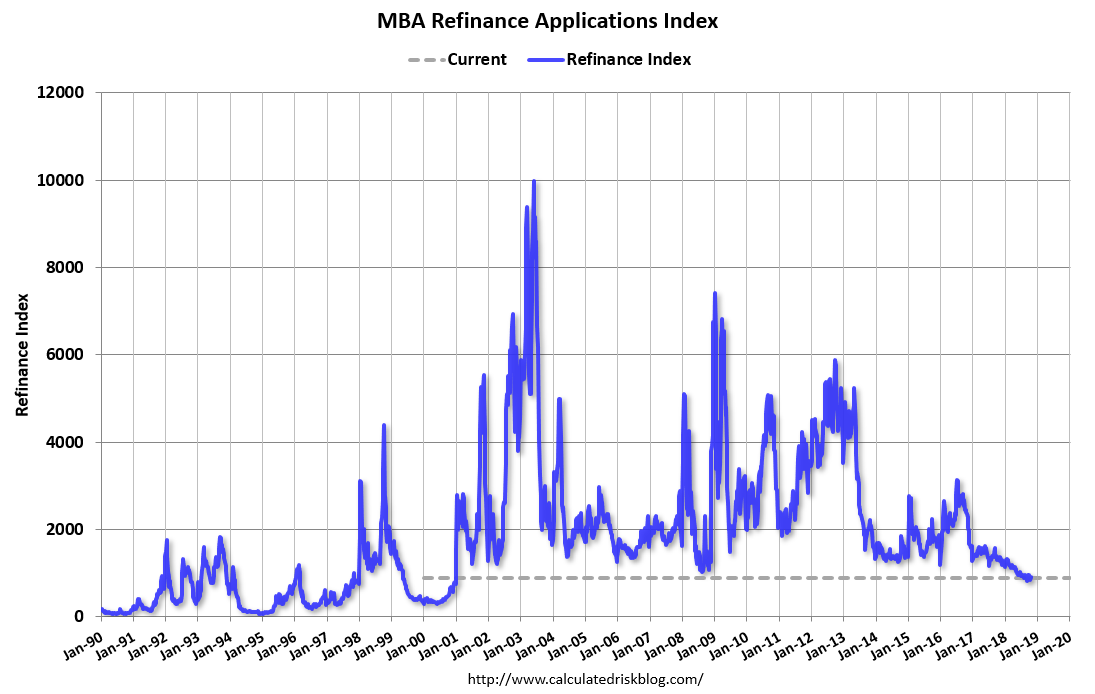 Click on graph for larger image.
The first graph shows the refinance index since 1990.
Refinance activity will not pick up significantly unless mortgage rates fall 50 bps or more from the recent level.
 The second graph shows the MBA mortgage purchase index
 According to the MBA, purchase activity is down 0.4% year-over-year.
Tuesday, October 30, 2018
Wednesday: ADP Employment, Chicago PMI
by Calculated Risk on 10/30/2018 07:44:00 PM
Wednesday:
• At 7:00 AM ET, The Mortgage Bankers Association (MBA) will release the results for the mortgage purchase applications index.
• At 8:15 AM, The ADP Employment Report for October. This report is for private payrolls only (no government). The consensus is for 180,000 jobs added, down from 230,000 in September.
• At 9:45 AM, Chicago Purchasing Managers Index for October. The consensus is for a reading of 60.0, down from 60.4 in September.
Real House Prices and Price-to-Rent Ratio in August
by Calculated Risk on 10/30/2018 04:35:00 PM
Here is the earlier post on Case-Shiller: Case-Shiller: National House Price Index increased 5.8% year-over-year in August
It has been over eleven years since the bubble peak. In the Case-Shiller release this morning, the seasonally adjusted National Index (SA), was reported as being 10.4% above the previous bubble peak. However, in real terms, the National index (SA) is still about 8.9% below the bubble peak (and historically there has been an upward slope to real house prices). The composite 20, in real terms, is still 12.4% below the bubble peak.
The year-over-year increase in prices is mostly moving sideways around 6%, although the YoY increase has been slowing recently - and will probably slow more as inventory picks up.
In August, the index was up 5.8% YoY.
Usually people graph nominal house prices, but it is also important to look at prices in real terms (inflation adjusted). Case-Shiller and others report nominal house prices. As an example, if a house price was $200,000 in January 2000, the price would be close to $285,000 today adjusted for inflation (42%). That is why the second graph below is important - this shows "real" prices (adjusted for inflation).
Nominal House Prices
 The first graph shows the monthly Case-Shiller National Index SA, and the monthly Case-Shiller Composite 20 SA (through August) in nominal terms as reported.
In nominal terms, the Case-Shiller National index (SA)and the Case-Shiller Composite 20 Index (SA) are both at new all times highs (above the bubble peak).
Real House Prices
 The second graph shows the same two indexes in real terms (adjusted for inflation using CPI less Shelter). Note: some people use other inflation measures to adjust for real prices.
In real terms, the National index is back to December 2004 levels, and the Composite 20 index is back to June 2004.
In real terms, house prices are at 2004 levels.
Price-to-Rent
In October 2004, Fed economist John Krainer and researcher Chishen Wei wrote a Fed letter on price to rent ratios: House Prices and Fundamental Value. Kainer and Wei presented a price-to-rent ratio using the OFHEO house price index and the Owners' Equivalent Rent (OER) from the BLS.
 Here is a similar graph using the Case-Shiller National and Composite 20 House Price Indexes.
This graph shows the price to rent ratio (January 2000 = 1.0).
On a price-to-rent basis, the Case-Shiller National index is back to February 2004 levels, and the Composite 20 index is back to November 2003 levels.
In real terms, prices are back to mid 2004 levels, and the price-to-rent ratio is back to late 2003, early 2004.
California Bay Area Home Sales Decline 20% YoY in September, Inventory up 14% YoY
by Calculated Risk on 10/30/2018 03:05:00 PM
Here are some Bay Area stats from Pacific Union chief economist Selma Hepp: Bay Area Housing Markets Got Spooked in September
• Bay Area home sales declined by 20 percent year over year in September, with all counties posting drops, led by Sonoma and Contra Costa. In 2018, the region’s housing market activity is trending 4 percent lower year to date.
• Bay Area inventory increased by 14 percent year over year in September — about 2,000 more homes — with Santa Clara County contributing more than 50 percent to the total increase.
• While appreciation has slowed from its spring peaks, Bay Area home prices are still up by 10 percent on an annual basis. San Mateo County maintained the strongest price growth at 19 percent.
• The rebalancing between buyers and sellers is driven by affordability constrains and buyer fatigue, with the biggest change seen in relatively affordable and previously fiercely competitive markets.
Update: A few comments on the Seasonal Pattern for House Prices
by Calculated Risk on 10/30/2018 12:09:00 PM
CR Note: This is a repeat of earlier posts with updated graphs.
A few key points:
1) There is a clear seasonal pattern for house prices.
2) The surge in distressed sales during the housing bust distorted the seasonal pattern.
3) Even though distressed sales are down significantly, the seasonal factor is based on several years of data - and the factor is now overstating the seasonal change (second graph below).
4) Still the seasonal index is probably a better indicator of actual price movements than the Not Seasonally Adjusted (NSA) index.
For in depth description of these issues, see former Trulia chief economist Jed Kolko's article "Let’s Improve, Not Ignore, Seasonal Adjustment of Housing Data"
Note: I was one of several people to question the change in the seasonal factor (here is a post in 2009) - and this led to S&P Case-Shiller questioning the seasonal factor too (from April 2010). I still use the seasonal factor (I think it is better than using the NSA data).
 Click on graph for larger image.
This graph shows the month-to-month change in the NSA Case-Shiller National index since 1987 (through August 2018). The seasonal pattern was smaller back in the '90s and early '00s, and increased once the bubble burst.
The seasonal swings have declined since the bubble.
 The second graph shows the seasonal factors for the Case-Shiller National index since 1987. The factors started to change near the peak of the bubble, and really increased during the bust.
The swings in the seasonal factors has started to decrease, and I expect that over the next several years - as recent history is included in the factors - the seasonal factors will move back towards more normal levels.
However, as Kolko noted, there will be a lag with the seasonal factor since it is based on several years of recent data.


