 RSS Feed
 by Calculated Risk on 5/15/2018 07:34:00 PM
Tuesday, May 15, 2018
Wednesday: Housing Starts, Industrial Production
Wednesday:
• At 7:00 AM ET, The Mortgage Bankers Association (MBA) will release the results for the mortgage purchase applications index.
• At 8:30 AM, Housing Starts for April. The consensus is for 1.325 million SAAR, up from 1.319 million SAAR in March.
• At 9:15 AM, The Fed will release Industrial Production and Capacity Utilization for April. The consensus is for a 0.6% increase in Industrial Production, and for Capacity Utilization to decrease to 78.4%.
"Mortgage Rates Jump to 7-Year Highs"
by Calculated Risk on 5/15/2018 04:29:00 PM
From Matthew Graham at Mortgage News Daily: Mortgage Rates Jump to 7-Year Highs
Mortgage rates spiked in a big way today, bringing some lenders to the highest levels in nearly 7 years (you'd need to go back to July 2011 to see worse). That heavy-hitting headline is largely due to the fact that rates were already fairly close to 7-year highs, although today did cover quite a bit more distance than other recent "bad days." [30YR FIXED - 4.75-4.875%]Here is a table from Mortgage News Daily:
emphasis added
Phoenix Real Estate in April: Sales down 9%, Inventory down 26% YoY
by Calculated Risk on 5/15/2018 03:29:00 PM
This is a key housing market to follow since Phoenix saw a large bubble / bust followed by strong investor buying.
The Arizona Regional Multiple Listing Service (ARMLS) reports (table below):
1) Overall sales in April were down 9.3% year-over-year (including homes, condos and manufactured homes).
2) Active inventory is now down 25.7% year-over-year. In some cities, it appears the inventory decline might be ending, but not in Phoenix!
This is the eighteenth consecutive month with a YoY decrease in inventory.
| April Residential Sales and Inventory, Greater Phoenix Area, ARMLS | ||||||
|---|---|---|---|---|---|---|
| Sales | YoY Change Sales | Cash | Percent Cash | Inventory | YoY Change | |
| Apr-08 | 4,8751 | --- | 986 | 20.2% | 55,7261 | --- |
| Apr-09 | 8,564 | 75.7% | 3,464 | 40.4% | 44,165 | -20.7% |
| Apr-10 | 9,261 | 8.1% | 3,641 | 39.3% | 41,756 | -5.5% |
| Apr-11 | 9,328 | 0.7% | 4,489 | 48.1% | 34,515 | -17.3% |
| Apr-12 | 8,438 | -9.5% | 4,013 | 47.6% | 21,125 | -38.8% |
| Apr-13 | 8,744 | 3.6% | 3,670 | 42.0% | 20,083 | -4.9% |
| Apr-14 | 7,656 | -12.4% | 2,469 | 32.2% | 29,889 | 48.8% |
| Apr-15 | 8,368 | 9.3% | 2,120 | 25.3% | 25,950 | -13.2% |
| Apr-16 | 8,437 | 0.8% | 2,008 | 23.8% | 27,232 | 4.9% |
| Apr-17 | 8,819 | 4.5% | 1,980 | 22.5% | 24,230 | -11.0% |
| Apr-18 | 8,002 | -9.3% | 1,836 | 22.9% | 18,007 | -25.7% |
| 1 April 2008 does not include manufactured homes, ~100 more | ||||||
Earlier from the NY Fed: Manufacturing "Business activity grew strongly in New York State"
by Calculated Risk on 5/15/2018 01:02:00 PM
Earlier for the NY Fed: Empire State Manufacturing Survey
Business activity grew strongly in New York State, according to firms responding to the May 2018 Empire State Manufacturing Survey. The headline general business conditions index climbed four points to 20.1, indicating a faster pace of growth than in April. The new orders index rose seven points to 16.0 and the shipments index was little changed at 19.1, suggesting ongoing growth in orders and shipments. ... Labor market indicators pointed to a modest increase in employment and longer workweeks.This was above the consensus forecast, and another solid reading.
emphasis added
NAHB: Builder Confidence Increases to 70 in May
by Calculated Risk on 5/15/2018 10:05:00 AM
The National Association of Home Builders (NAHB) reported the housing market index (HMI) was at 70 in May, up from 68 in April. Any number above 50 indicates that more builders view sales conditions as good than poor.
From NAHB: Builder Confidence Climbs to 70 in May
Builder confidence in the market for newly-built single-family homes rose two points to a level of 70 in May after a downwardly revised April reading on the National Association of Home Builders/Wells Fargo Housing Market Index (HMI). This is the fourth time the HMI has reached 70 or higher this year.
“The solid May report shows that builders are buoyed by growing consumer demand for single-family homes,” said NAHB Chairman Randy Noel, a custom home builder from LaPlace, La. “However, the record-high cost of lumber is hurting builders’ bottom lines and making it more difficult to produce competitively priced houses for newcomers to the market.”
“Tight housing inventory, employment gains and demographic tailwinds should continue to boost demand for newly-built single-family homes,” said NAHB Chief Economist Robert Dietz. “With these fundamentals in place, the housing market should improve at a steady, gradual pace in the months ahead.”
...
The HMI chart gauging current sales conditions increased two points to 76 in May while the indexes measuring buyer traffic and expectations in the next six months remained unchanged at 51 and 77, respectively.
Looking at the three-month moving averages for regional HMI scores, the West and Northeast held steady at 76 and 55, respectively. Meanwhile, the South and Midwest each edged down one point to respective levels of 72 and 65.
emphasis added
 Click on graph for larger image.
This graph show the NAHB index since Jan 1985.
This was at the consensus forecast, and another solid reading.
Retail Sales increased 0.3% in April
by Calculated Risk on 5/15/2018 08:42:00 AM
On a monthly basis, retail sales increased 0.3 percent from March to April (seasonally adjusted), and sales were up 4.7 percent from March 2017.
From the Census Bureau report:
Advance estimates of U.S. retail and food services sales for April 2018, adjusted for seasonal variation and holiday and trading-day differences, but not for price changes, were $497.6 billion, an increase of 0.3 percent from the previous month, and 4.7 percent above April 2017. ... The February 2018 to March 2018 percent change was revised from up 0.6 percent to up 0.8 percent
 Click on graph for larger image.
This graph shows retail sales since 1992. This is monthly retail sales and food service, seasonally adjusted (total and ex-gasoline).
Retail sales ex-gasoline were up 0.3% in April.
The second graph shows the year-over-year change in retail sales and food service (ex-gasoline) since 1993.
 Retail and Food service sales, ex-gasoline, increased by 4.0% on a YoY basis.
The increase in April was at expectations, and sales in February and March were revised up.
Monday, May 14, 2018
Tuesday: Retail Sales, NY Fed Mfg, Homebuilder Survey
by Calculated Risk on 5/14/2018 06:55:00 PM
From Matthew Graham at Mortgage News Daily: Mortgage Rates Sideways But Market Says They Shouldn't Be
Mortgage rates were sideways to slightly higher today, and that's actually a strong showing considering what transpired in underlying bond markets. In fact, I'd wager tomorrow morning's rate sheets will be noticeably weaker if bonds are anywhere near their current levels. [30YR FIXED - 4.625%-4.75%]Tuesday:
emphasis added
• At 8:30 AM ET, Retail sales for April will be released. The consensus is for a 0.3% increase in retail sales.
• At 8:30 AM, The New York Fed Empire State manufacturing survey for May. The consensus is for a reading of 15.5, down from 15.8.
• At 10:00 AM, The May NAHB homebuilder survey. The consensus is for a reading of 70, up from 69 in April. Any number above 50 indicates that more builders view sales conditions as good than poor.
LA area Port Traffic Increases YoY in April
by Calculated Risk on 5/14/2018 03:16:00 PM
Container traffic gives us an idea about the volume of goods being exported and imported - and usually some hints about the trade report since LA area ports handle about 40% of the nation's container port traffic.
The following graphs are for inbound and outbound traffic at the ports of Los Angeles and Long Beach in TEUs (TEUs: 20-foot equivalent units or 20-foot-long cargo container).
To remove the strong seasonal component for inbound traffic, the first graph shows the rolling 12 month average.
 Click on graph for larger image.
On a rolling 12 month basis, inbound traffic was up 0.2% compared to the rolling 12 months ending in March. Outbound traffic was up 1.0% compared to the rolling 12 months ending in March.
The 2nd graph is the monthly data (with a strong seasonal pattern for imports).
 Usually imports peak in the July to October period as retailers import goods for the Christmas holiday, and then decline sharply and bottom in February or March depending on the timing of the Chinese New Year.
In general imports have been increasing, and exports are mostly moving sideways recently.
Payroll Employment and Seasonal Factors
by Calculated Risk on 5/14/2018 11:26:00 AM
This might be a good time to review the seasonal pattern for employment.
Even in the best of years there are a significant number of jobs lost in the months of January and July. In 1994, when the economy added almost 3.9 million jobs, there were 2.25 million lost in January 1994 (not seasonally adjusted, NSA), and almost 1 million payroll jobs lost in July of that year.
This year, in January 2018, 3.1 million total jobs were lost (NSA). And in April 2018 (last month), almost 1 million jobs were added (NSA). On a seasonally adjusted basis, the BLS reported 176 thousand jobs (SA) added in January, and 164 thousand added in April.
A clear example of the a seasonal pattern is that teachers leave the workforce every year in July. And then those teachers return to the payrolls in September and early October. Since this happens every year, the BLS applies a seasonal adjustment before reporting the headline number.
For the private sector, there are always a large number of jobs lost in January (retailers and others cutting jobs) and in September (summer hires let go).
 Click on graph for larger image.
This graph shows the seasonal pattern since 2002 for both total nonfarm jobs and private sector only payroll jobs. Notice the large spike down every January.
Also notice the spike down in July (red) that is related to teachers leaving the labor force.
The key point is this is a series that NEEDS a seasonal adjustment. There is significant, but predictable, seasonal variation in employment.
Employment: April Diffusion Indexes
by Calculated Risk on 5/14/2018 09:03:00 AM
I haven't posted this in a few months.
The BLS diffusion index for total private employment was at 57.6 in April, down from 64.1 in March.
For manufacturing, the diffusion index was at 53.9, down from 64.5 in March.
Think of this as a measure of how widespread job gains are across industries. The further from 50 (above or below), the more widespread the job losses or gains reported by the BLS. Above 60 is very good. From the BLS:
Figures are the percent of industries with employment increasing plus one-half of the industries with unchanged employment, where 50 percent indicates an equal balance between industries with increasing and decreasing employment.
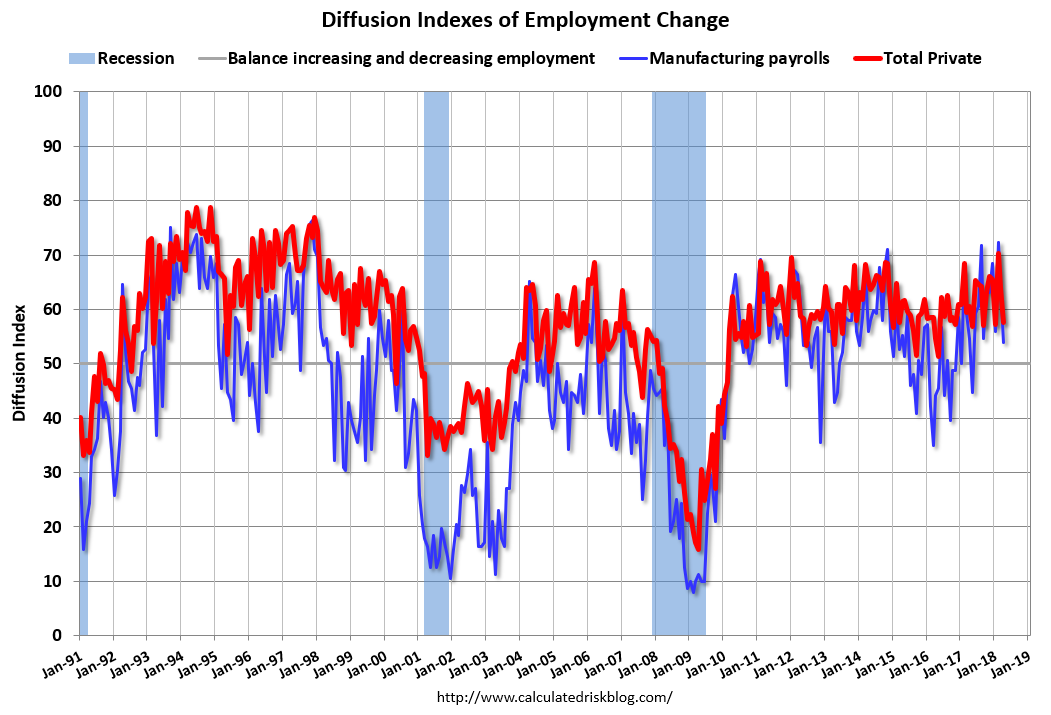 Overall both total private and manufacturing job growth was less widespread in April compared to the previous two months.


