 RSS Feed
 by Calculated Risk on 4/30/2018 07:52:00 PM
Monday, April 30, 2018
Tuesday: ISM Manufacturing, Construction Spending, Auto Sales
From Matthew Graham at Mortgage News Daily: Mortgage Rates Mostly Sideways to Begin Busy Week
Mortgage rates didn't move much today, which keeps them right in line with last week's lowest levels. That sounds pretty good! Unfortunately, any time prior to last week, those "lowest levels" would have been the highest in more than 4 years. [30YR FIXED - 4.625%-4.75%]Tuesday:
emphasis added
• At 10:00 AM ET, ISM Manufacturing Index for April. The consensus is for the ISM to be at 58.7, down from 59.3 in March. The PMI was at 59.3% in March, the employment index was at 57.3%, and the new orders index was at 61.9%.
• Also at 10:00 AM, Construction Spending for March. The consensus is for a 0.5% increase in construction spending.
• All day, Light vehicle sales for April. The consensus is for light vehicle sales to be 17.2 million SAAR in March, down from 17.4 million in March (Seasonally Adjusted Annual Rate).
Fannie Mae: Mortgage Serious Delinquency rate decreased in March
by Calculated Risk on 4/30/2018 04:21:00 PM
Fannie Mae reported that the Single-Family Serious Delinquency rate decreased to 1.16% in March, down from 1.22% in January. The serious delinquency rate is up from 1.12% in March 2017.
These are mortgage loans that are "three monthly payments or more past due or in foreclosure".
The Fannie Mae serious delinquency rate peaked in February 2010 at 5.59%.
 Click on graph for larger image
By vintage, for loans made in 2004 or earlier (3% of portfolio), 3.24% are seriously delinquent. For loans made in 2005 through 2008 (6% of portfolio), 6.22% are seriously delinquent, For recent loans, originated in 2009 through 2018 (91% of portfolio), only 0.51% are seriously delinquent. So Fannie is still working through poor performing loans from the bubble years.
The recent increase in the delinquency rate was due to the hurricanes - no worries about the overall market (These are serious delinquencies, so it took three months late to be counted).
After the hurricane bump, the rate will probably decline to 0.5 to 0.7 percent or so to a cycle bottom.
Note: Freddie Mac reported earlier.
Energy expenditures as a percentage of PCE
by Calculated Risk on 4/30/2018 02:09:00 PM
Note: Back in early 2016, I noted that energy expenditures as a percentage of PCE had hit an all time low. Here is an update through the March 2018 PCE report released this morning.
Below is a graph of expenditures on energy goods and services as a percent of total personal consumption expenditures through March 2018.
This is one of the measures that Professor Hamilton at Econbrowser looks at to evaluate any drag on GDP from energy prices.

Click on graph for larger image.
Data source: BEA Table 2.3.5U.
The huge spikes in energy prices during the oil crisis of 1973 and 1979 are obvious. As is the increase in energy prices during the 2001 through 2008 period.
In March 2018, energy expenditures as a percentage of PCE increased to 4.05% of PCE, up from the all time low two years ago of 3.6%.
Historically this is still a low percentage of PCE for energy expenditures, even though oil prices are up sharply over the last two years (WTI was at $37.55 per barrel in March 2016 and has risen to almost $69 per barrel today).
Earlier: Chicago PMI Increased Slightly in April
by Calculated Risk on 4/30/2018 01:10:00 PM
From the Chicago PMI: Chicago Business Barometer Rises to 57.6 in April
The MNI Chicago Business Barometer rose 0.2 points to 57.6 in April, up from 57.4 in March, snapping a three-month downward trend.This was slightly below the consensus forecast of 57.8, but still a decent reading.
Business activity continued to rise at a solid pace in April, with growth in firms’ operations up for the first time this year, albeit marginally. Three of the five Barometer components fell on the month, with only Production and Supplier Deliveries finding room to grow.
...
“While the MNI Chicago Business Barometer ended a threemonth falling streak in April, supply constraints faced by firms intensified and continue to weigh on activity. Longer delivery times are proving attritive, while dearer materials bite further into margins” said Jamie Satchi, Economist at MNI Indicators.
“Uncertainty among suppliers appears to be assisting the upward march in prices, but the majority of firms were optimistic any negative impact stemming directly from recently implemented tariffs would be minimal,” he added.
emphasis added
Dallas Fed: "Growth in Texas Manufacturing Rebounds Strongly"
by Calculated Risk on 4/30/2018 10:37:00 AM
From the Dallas Fed: Growth in Texas Manufacturing Rebounds Strongly
Texas factory activity rose markedly in April after posting slower growth in March, according to business executives responding to the Texas Manufacturing Outlook Survey. The production index, a key measure of state manufacturing conditions, increased 11 points to 25.3.This was the last of the regional Fed surveys for April.
Other indexes of manufacturing activity also rose sharply in April. The new orders and growth rate of orders indexes jumped to their highest readings this year, 27.9 and 18.9, respectively. The capacity utilization index climbed eight points to 18.7, and the shipments index rose nine points to 19.3.
Perceptions of broader business conditions remained highly positive on net in April. The general business activity index was largely unchanged at 21.8, and the company outlook index edged up four points to 23.6. Both indexes remained far above their average levels.
Labor market measures suggested stronger growth in employment and work hours in April. The employment index came in at 17.8, up six points from March. Twenty-four percent of firms noted net hiring, compared with 6 percent noting net layoffs. The hours worked index moved up four points to 14.3.
emphasis added
Here is a graph comparing the regional Fed surveys and the ISM manufacturing index:
 Click on graph for larger image.
The New York and Philly Fed surveys are averaged together (yellow, through April), and five Fed surveys are averaged (blue, through April) including New York, Philly, Richmond, Dallas and Kansas City. The Institute for Supply Management (ISM) PMI (red) is through March (right axis).
Based on these regional surveys, it seems likely the ISM manufacturing index will be solid again in April, but probably lower than in March (to be released tomorrow, Tuesday, May 1st).
NAR: Pending Home Sales Index Increased 0.4% in March, Down 3.0% Year-over-year
by Calculated Risk on 4/30/2018 10:05:00 AM
From the NAR: Pending Home Sales Move Up 0.4 Percent in March
Pending home sales inched higher for the second consecutive month in March, but unrelenting inventory constraints once again kept overall activity below year ago levels, according to the National Association of Realtors®.This was below expectations of a 1.0% increase for this index. Note: Contract signings usually lead sales by about 45 to 60 days, so this would usually be for closed sales in April and May.
The Pending Home Sales Index, a forward-looking indicator based on contract signings, inched up 0.4 percent to 107.6 in March from a downwardly revised 107.2 in February. Even with last month's increase in activity, the index declined on an annualized basis (3.0 percent) for the third straight month.
...
The PHSI in the Northeast fell 5.6 percent to 90.6 in March, and is now 8.1 percent below a year ago. In the Midwest the index rose 2.4 percent to 101.3 in March, but is 6.0 percent lower than March 2017. Pending home sales in the South climbed 2.5 percent to an index of 128.6 in March, and are 0.3 percent higher than last March. The index in the West declined 1.1 percent in March to 94.7, and is 2.2 percent below a year ago.
emphasis added
Personal Income increased 0.3% in March, Spending increased 0.4%
by Calculated Risk on 4/30/2018 08:36:00 AM
The BEA released the Personal Income and Outlays report for March:
Personal income increased $47.8 billion (0.3 percent) in March according to estimates released today by the Bureau of Economic Analysis. Disposable personal income (DPI) increased $39.8 billion (0.3 percent) and personal consumption expenditures (PCE) increased $61.7 billion (0.4 percent).The March PCE price index increased 2.0 percent year-over-year and the March PCE price index, excluding food and energy, increased 1.9 percent year-over-year.
...
Real PCE increased 0.4 percent. The PCE price index increased less than 0.1 percent. Excluding food and energy, the PCE price index increased 0.2 percent.
The following graph shows real Personal Consumption Expenditures (PCE) through March 2018 (2009 dollars). Note that the y-axis doesn't start at zero to better show the change.
 Click on graph for larger image.
The dashed red lines are the quarterly levels for real PCE.
The increase in personal income was slightly below expectations, and the increase in PCE was at expectations.
PCE growth was weak in Q1, however inflation is now near the Fed's target.
Sunday, April 29, 2018
Monday: Personal Income, Chicago PMI, Pending Home Sales
by Calculated Risk on 4/29/2018 10:01:00 PM
Weekend:
• Schedule for Week of Apr 29, 2018
Monday:
• At 8:30 AM ET, Personal Income and Outlays for March. The consensus is for a 0.4% increase in personal income, and for a 0.4% increase in personal spending. And for the Core PCE price index to increase 0.2%.
• At 9:45 AM, Chicago Purchasing Managers Index for April. The consensus is for a reading of 57.8, up from 57.4 in March.
• At 10:00 AM, Pending Home Sales Index for March. The consensus is for a 1.0% increase in the index.
• At 10:30 AM, Dallas Fed Survey of Manufacturing Activity for April. This is the last of the regional Fed surveys for April.
From CNBC: Pre-Market Data and Bloomberg futures: S&P 500 are up 7, and DOW futures are up 50 (fair value).
Oil prices were mixed over the last week with WTI futures at $67.93 per barrel and Brent at $74.22 per barrel. A year ago, WTI was at $49, and Brent was at $50 - so oil prices are up about 40% year-over-year.
Here is a graph from Gasbuddy.com for nationwide gasoline prices. Nationally prices are at $2.81 per gallon. A year ago prices were at $2.39 per gallon - so gasoline prices are up 42 cents per gallon year-over-year.
April 2018: Unofficial Problem Bank list declines to 94 Institutions
by Calculated Risk on 4/29/2018 08:31:00 AM
Note: Surferdude808 compiles an unofficial list of Problem Banks compiled only from public sources.
Here is the unofficial problem bank list for April 2018.
Here are the monthly changes and a few comments from surferdude808:
Update on the Unofficial Problem Bank List for April 2018. The list had a decline of four insured institutions to 94 banks. Aggregate assets declined during the month by $956 million to $18.9 billion. A year ago, the list held 148 institutions with assets of $36.1 billion.CR Note: When the unofficial weekly was list was first published on August 7, 2009 it had 389 institutions. The list peaked at just over 1,000 institutions in 2011. Now there are only 94 banks on the unofficial list (the FDIC reported 95 banks on the official problem bank list at the end of 2017).
Actions were terminated against American Bank of the North, Nashwauk, MN ($550 million); Affinity Bank, Atlanta, GA ($260 million); Allied First Bank, SB, Oswego, IL ($94 million); and South Carolina Community Bank, Columbia, SC ($53 million).
The FDIC's official problem bank list is comprised of banks with a CAMELS rating of 4 or 5, and the list is not made public (just the number of banks and assets every quarter). Note: Bank CAMELS ratings are also not made public.
CAMELS is the FDIC rating system, and stands for Capital adequacy, Asset quality, Management, Earnings, Liquidity and Sensitivity to market risk. The scale is from 1 to 5, with 1 being the strongest.
As a substitute for the CAMELS ratings, surferdude808 is using publicly announced formal enforcement actions, and also media reports and company announcements that suggest to us an enforcement action is likely, to compile a list of possible problem banks in the public interest.
Saturday, April 28, 2018
Schedule for Week of Apr 29, 2018
by Calculated Risk on 4/28/2018 08:11:00 AM
The key report this week is the April employment report on Friday.
Other key indicators include the March Personal Income and Outlays report, March Trade deficit, April ISM manufacturing and non-manufacturing indexes, April auto sales, and the April ADP employment report.
The FOMC meets on Tuesday and Wednesday, and no change to policy is expected.
8:30 AM: Personal Income and Outlays for March. The consensus is for a 0.4% increase in personal income, and for a 0.4% increase in personal spending. And for the Core PCE price index to increase 0.2%.
9:45 AM: Chicago Purchasing Managers Index for April. The consensus is for a reading of 57.8, up from 57.4 in March.
10:00 AM: Pending Home Sales Index for March. The consensus is for a 1.0% increase in the index.
10:30 AM: Dallas Fed Survey of Manufacturing Activity for April. This is the last of the regional Fed surveys for April.
 10:00 AM: ISM Manufacturing Index for April. The consensus is for the ISM to be at 58.7, down from 59.3 in March.
Here is a long term graph of the ISM manufacturing index.
The PMI was at 59.3% in March, the employment index was at 57.3%, and the new orders index was at 61.9%.
10:00 AM: Construction Spending for March. The consensus is for a 0.5% increase in construction spending.
 All day: Light vehicle sales for April. The consensus is for light vehicle sales to be 17.2 million SAAR in March, down from 17.4 million in March (Seasonally Adjusted Annual Rate).
This graph shows light vehicle sales since the BEA started keeping data in 1967. The dashed line is the March sales rate.
7:00 AM ET: The Mortgage Bankers Association (MBA) will release the results for the mortgage purchase applications index.
8:15 AM: The ADP Employment Report for April. This report is for private payrolls only (no government). The consensus is for 193,000 payroll jobs added in April, down from 241,000 added in March.
2:00 PM: FOMC Meeting Announcement. The FOMC is expected to announce no change to policy at this meeting.
8:30 AM ET: The initial weekly unemployment claims report will be released. The consensus is for 220 thousand initial claims, up from 209 thousand the previous week.
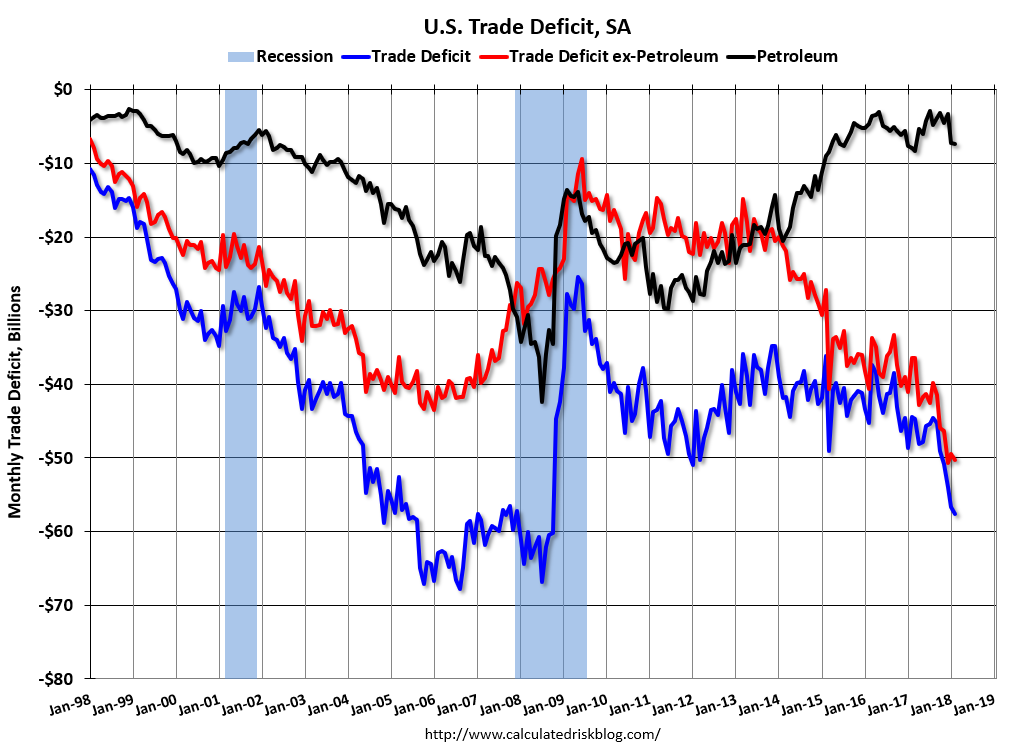 8:30 AM: Trade Balance report for March from the Census Bureau.
 This graph shows the U.S. trade deficit, with and without petroleum, through February. The blue line is the total deficit, and the black line is the petroleum deficit, and the red line is the trade deficit ex-petroleum products.
The consensus is for the U.S. trade deficit to be at $50.0 billion in March from $57.6 billion in February.
10:00 AM: the ISM non-Manufacturing Index for April. The consensus is for index to decrease to 58.5 from 58.8 in March.
8:30 AM: Employment Report for April. The consensus is for an increase of 190,000 non-farm payroll jobs added in April, up from the 103,000 non-farm payroll jobs added in March.
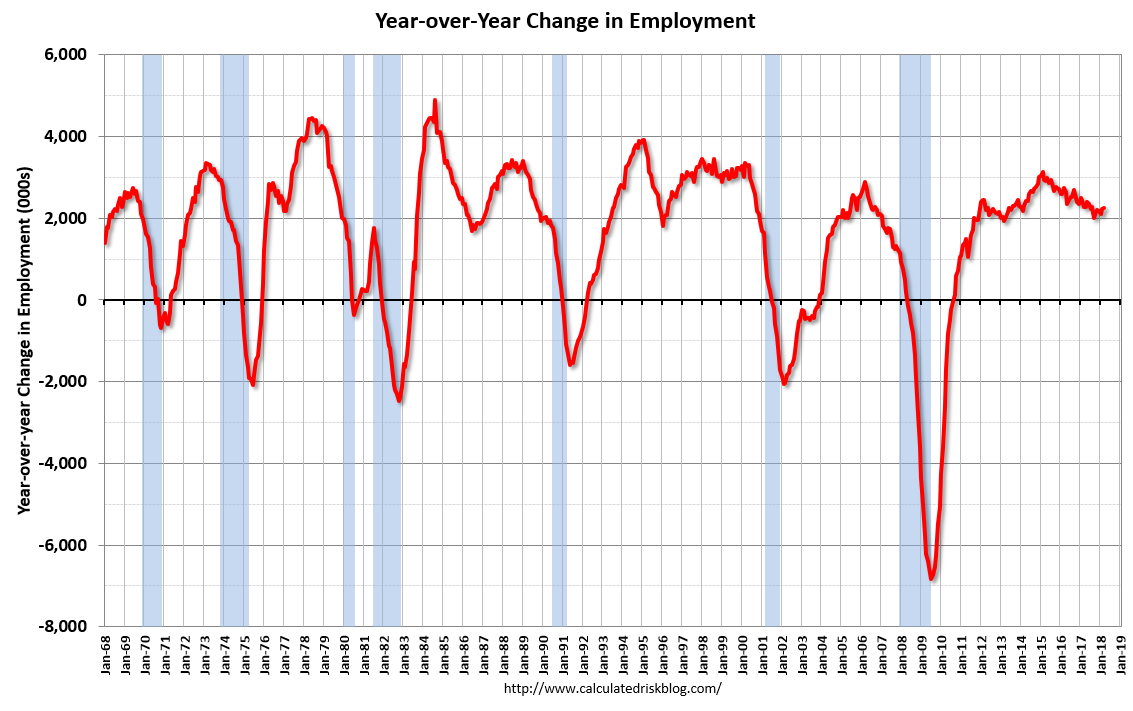 The consensus is for the unemployment rate to decrease to 4.0%.
This graph shows the year-over-year change in total non-farm employment since 1968.
In March the year-over-year change was 2.261 million jobs.
A key will be the change in wages.


