by Calculated Risk on 2/14/2018 08:41:00 AM
Wednesday, February 14, 2018
Retail Sales decreased 0.3% in January
On a monthly basis, retail sales decreased 0.3 percent from December to January (seasonally adjusted), and sales were up 3.6 percent from January 2017.
From the Census Bureau report:
Advance estimates of U.S. retail and food services sales for January 2018, adjusted for seasonal variation and holiday and trading-day differences, but not for price changes, were $492.0 billion, a decrease of 0.3 percent from the previous month, but 3.6 percent above January 2017. ... The November 2017 to December 2017 percent change was revised from up 0.4 percent to virtually unchanged.
 Click on graph for larger image.
This graph shows retail sales since 1992. This is monthly retail sales and food service, seasonally adjusted (total and ex-gasoline).
Retail sales ex-gasoline were down 0.4% in January.
The second graph shows the year-over-year change in retail sales and food service (ex-gasoline) since 1993.
 Retail and Food service sales, ex-gasoline, increased by 3.5% on a YoY basis.
The increase in January was well below expectations, and sales in November and December were revised down sharply. A disappointing report.
MBA: Mortgage Applications Decrease in Latest Weekly Survey
by Calculated Risk on 2/14/2018 07:00:00 AM
From the MBA: Mortgage Applications Decrease in Latest MBA Weekly Survey
Mortgage applications decreased 4.1 percent from one week earlier, according to data from the Mortgage Bankers Association’s (MBA) Weekly Mortgage Applications Survey for the week ending February 9, 2018.
... The Refinance Index decreased 2 percent from the previous week. The seasonally adjusted Purchase Index decreased 6 percent from one week earlier. The unadjusted Purchase Index decreased 3 percent compared with the previous week and was 4 percent higher than the same week one year ago. ...
The average contract interest rate for 30-year fixed-rate mortgages with conforming loan balances ($453,100 or less) increased to its highest rate since January 2014, 4.57 percent, from 4.50 percent, with points increasing to 0.59 from 0.57 (including the origination fee) for 80 percent loan-to-value ratio (LTV) loans.
emphasis added
 Click on graph for larger image.
The first graph shows the refinance index since 1990.
Refinance activity will not pick up significantly unless mortgage rates fall well below 4%.
 The second graph shows the MBA mortgage purchase index
 According to the MBA, purchase activity is up 4% year-over-year.
Tuesday, February 13, 2018
Wednesday: CPI, Retail Sales
by Calculated Risk on 2/13/2018 08:56:00 PM
Wednesday:
• At 7:00 AM ET,The Mortgage Bankers Association (MBA) will release the results for the mortgage purchase applications index.
• At 8:30 AM, Retail sales for January will be released. The consensus is for a 0.3% increase in retail sales.
• Also at 8:30 AM, The Consumer Price Index for January from the BLS. The consensus is for a 0.3% increase in CPI, and a 0.2% increase in core CPI.
• At 10:00 AM, Manufacturing and Trade: Inventories and Sales (business inventories) report for December. The consensus is for a 0.2% increase in inventories.
NY Fed Q4 Report: "Household Debt Increased, Fifth Consecutive Year Of Positive Annual Growth"
by Calculated Risk on 2/13/2018 03:11:00 PM
From the NY Fed: Household Debt Jumps as 2017 Marks the Fifth Consecutive Year Of Positive Annual Growth Since Post-Recession Deleveraging
The Federal Reserve Bank of New York’s Center for Microeconomic Data today issued its Quarterly Report on Household Debt and Credit,which reported that total household debt increased by $193 billion (1.5%) to $13.15 trillion in the fourth quarter of 2017. This report marks the fifth consecutive year of positive annual household debt growth. There were increases in mortgage, student, auto, and credit card debt (increasing by 1.6%, 1.5%, 0.7% and 3.2% respectively) and another modest decline in home equity line of credit (HELOC) balances (decreasing by 0.9%). The Report is based on data from the New York Fed's Consumer Credit Panel, a nationally representative sample of individual- and household-level debt and credit records drawn from anonymized Equifax credit data.
Mortgages are the largest form of household debt and their increase of $139 billion was the most substantial increase seen in several quarters. Unlike overall debt balances, which last year surpassed their previous peak reached in the third quarter of 2008, mortgage balances remain 4.4% below it. The New York Fed issued an accompanying blog post to examine the regional differences in mortgage debt growth since the previous peak.
...
Bankruptcy notations decreased for the second consecutive quarter. ... Foreclosure notations remained essentially unchanged at the lowest levels observed in the New York Fed’s data.
emphasis added
 Click on graph for larger image.
Here are two graphs from the report:
The first graph shows aggregate consumer debt increased in Q4. Household debt previously peaked in 2008, and bottomed in Q2 2013.
From the NY Fed:
Mortgage balances, the largest component of household debt, increased substantially during the fourth quarter. Mortgage balances shown on consumer credit reports on December 31 stood at $8.88 trillion, an increase of $139 billion from the third quarter of 2017. Balances on home equity lines of credit (HELOC) declined again, by $4 billion and now stand at $444 billion. Non-housing balances, which have been increasing steadily for nearly 6 years overall, saw a $58 billion increase in the fourth quarter. Auto loans grew by $8 billion and credit card balances increased by $26 billion, while student loans saw a $21 billion increase.
 The second graph shows the percent of debt in delinquency. There is still a larger than normal percent of debt 90+ days delinquent (Yellow, orange and red).
The overall delinquency rate decreased in Q4. From the NY Fed:
Aggregate delinquency rates improved in the fourth quarter of 2017. As of December 31, 4.7% of outstanding debt was in some stage of delinquency. Of the $619 billion of debt that is delinquent, $406 billion is seriously delinquent (at least 90 days late or “severely derogatory”). The flow into 90+ days delinquency for credit card balances has been increasing notably from the last year and the flow into 90+ days delinquency for auto loan balances has been slowly increasing since 2012.There is much more in the report.
Demographics and GDP: 2% is the new 4%
by Calculated Risk on 2/13/2018 12:19:00 PM
Three years ago, I wrote Demographics and GDP: 2% is the new 4%. In that post I pointed out that due to demographics, slower GDP growth should have been expected over the last decade (contrary to political nonsense).
Yesterday, Greg Ip at the WSJ noted: Mulvaney: "People thought we were crazy" to forecast 2.3% 2017 growth. "We blew that out of the water." (Referring to John "Mick" Mulvaney, Director of the Office of Management and Budget).
What was real GDP growth in 2017? 2.3% according to the BEA. Too funny. (Maybe he meant Q4 over Q4, but that was only 2.5% - not exactly blown "out of the water".
This give me an excuse to update my graphs from my post three years ago. Overall, we should have been expecting slower growth this decade due to demographics - even without the housing bubble-bust and financial crisis.
One simple way to look at the change in GDP is as the change in the labor force, times the change in productivity. If the labor force is growing quickly, GDP will be higher with the same gains in productivity. And the opposite is true.
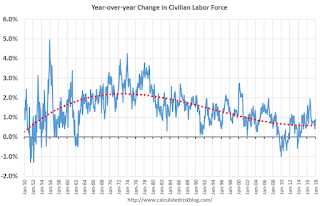
So here is a graph of the year-over-year change in the labor force since 1950 (data from the BLS).

The data is noisy - because of changes in population controls and the business cycle - but the pattern is clear as indicated by the dashed red trend line. The labor force has been growing slowly after declining for some time.
We could also look at just the prime working age population - I've pointed out before the that prime working age population has started growing again.
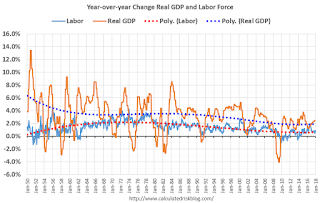
Now here is a look at GDP for the same period.

GDP was high in the early 50s - and early-to-mid 60s because of government spending (Korean and Vietnam wars). As in example, in 1951, national defense added added 6.5 percentage points to GDP. Of course we don't want another war ...
Now lets put the two graphs together.

The good news is that the working age population will be growing faster going forward. The bad news is the political hacks will continue to ignore demographics.
However, due to demographics, 2% GDP growth is the new 4%. (Note: with improving demographics, maybe 2.5% is the new 4% now)
Goldman: "The 2018 Inflation Rebound"
by Calculated Risk on 2/13/2018 10:58:00 AM
A few brief excerpts from a note by Goldman Sachs economist Daan Struyven: The 2018 Inflation Rebound
Using our top-down and bottom-up core PCE models, we project that both macroeconomic fundamentals as well as sector-specific factors are likely to push core inflation meaningfully higher this year.CR Note: The central tendency for core inflation in the December FOMC projections was 1.7% to 1.9%. So this is in line with current FOMC projections, and still below the Fed target of 2%.
...
We highlight three key drivers of the core PCE acceleration to 1.8% by end-2018 in our forecast: a 0.15pp boost from the pass-through from higher energy prices and a weaker dollar, a 0.1-0.15pp lift from a tighter labor market, and a 0.1pp jump from the Verizon effect dropping out.
...
We ... now see the risks to our core PCE forecast of 1.8% by end-2018 as moderately tilted to the upside.
emphasis added
Small Business Optimism Index Increased in January, "Difficulty of finding qualified workers" is Top Problem
by Calculated Risk on 2/13/2018 08:57:00 AM
From the National Federation of Independent Business (NFIB): Record Number of Small Business Owners Say ‘Now is Good Time to Expand’
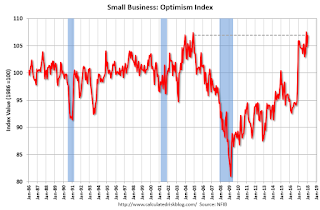
The Index of Small Business Optimism gained 2.0 points in January, rising to 106.9, again one of the strongest readings in the 45-year history of the NFIB surveys. The highest reading of 108.0 was reached in July 1983 and the lowest reading of 79.7 occurred in April 1980.
Job creation was solid in the small-business sector as owners reported a seasonally adjusted average employment change per firm of 0.23 workers, a strong showing. The lack of “qualified” workers is impeding growth in employment. ... Twenty-two percent of owners cited the difficulty of finding qualified workers as their Single Most Important Business Problem (up 3 points), exceeding the percentage citing taxes or the cost of regulation as their top business problem.
emphasis added
 Click on graph for larger image.
This graph shows the small business optimism index since 1986.
The index increased to 106.9 in December.
Note: Usually small business owners complain about taxes and regulations. However, during the recession, "poor sales" was the top problem.
Now the difficulty of finding qualified workers is the top problem.
Monday, February 12, 2018
"Mortgage Rates Steady at 4-Year Highs Despite Warning Shots"
by Calculated Risk on 2/12/2018 07:14:00 PM
From Matthew Graham at Mortgage News Daily: Mortgage Rates Steady at 4-Year Highs Despite Warning Shots
Mortgage rates were generally in line with Friday's latest levels today. Unfortunately, those happened to be the highest in more than 4 years.Tuesday:
...
Although bond markets received another warning shot with respect to increased supply today due to the unveiling of Trumps's new budget, market participants didn't do much with that information. Bonds were mostly unchanged as they wait for bigger, more important news like Wednesday morning's Consumer Price Index (inflation data). [30YR FIXED - 4.5%]
emphasis added
• At 6:00 AM ET, NFIB Small Business Optimism Index for January.
AIA Forecast: 4% increase in Nonresidential Construction in 2018
by Calculated Risk on 2/12/2018 04:21:00 PM
Note: This does not include spending for oil and gas.
From the AIA: Pace of construction activity projected to accelerate through 2019
Despite labor shortages and rising material costs that continue to impact the construction sector, construction spending for nonresidential buildings is projected to increase 4% this year and continue at that pace of growth through 2019. The American Institute of Architects (AIA) semi-annual Consensus Construction Forecast indicates the commercial construction sectors will generate much of the expected gains this year, and by 2019 the industrial and institutional sectors will dominate the projected construction growth.
“Rebuilding after the record-breaking losses from natural disasters last year, the recently enacted tax reform bill, and the prospects of an infrastructure package are expected to provide opportunities for even more robust levels of activity within the industry,” said AIA Chief Economist, Kermit Baker, PhD, Hon. AIA. “The Architecture Billings Index (ABI) and other major leading indicators for the industry also point to an upturn in construction activity over the coming year.”
Port of Long Beach: Record Port Traffic in January 2018
by Calculated Risk on 2/12/2018 01:12:00 PM
From the Port of Long Beach: Year Begins With Records in Long Beach
The new year brought a raft of records to the Port of Long Beach, where January container volumes reached an all-time high for the month.CR Notes: The timing of the Chinese New Year always impacts traffic I'll have more on the LA area port traffic once Los Angeles releases their January statistics.
Workers moved 657,830 twenty-foot equivalent units (TEUs) through the harbor in January, 12.9 percent more than the same month last year. The total marks the first time Long Beach has surpassed 600,000 containers in the month of January. The quick start to 2018 comes after officials recently announced that 2017 was the busiest year in the Port’s 107-year history, reaching 7.54 million TEUs.
“The pre-Lunar New Year surge is definitely here,” said Port of Long Beach Executive Director Mario Cordero, taking note of the upcoming two-week holiday period in Asia, the Port’s primary trading partner. “Since this year’s holiday begins Feb. 16, we anticipated a busy January and February, as cargo owners seek to get goods shipped ahead of the festivities.”


