by Calculated Risk on 1/25/2018 11:00:00 AM
Thursday, January 25, 2018
Kansas City Fed: Regional Manufacturing Activity "Growth Strengthened Further" in January
From the Kansas City Fed: Tenth District Manufacturing Growth Strengthened Further
The Federal Reserve Bank of Kansas City released the January Manufacturing Survey today. According to Chad Wilkerson, vice president and economist at the Federal Reserve Bank of Kansas City, the survey revealed that growth in Tenth District manufacturing activity strengthened further, and expectations for future activity increased.So far all of the regional Fed surveys have been solid in January, although only the Kansas City index has been above the December levels (most indexes suggest slower growth in January than in December).
“We saw faster growth this month despite some firms noting negative effects from extremely cold weather, and several price indexes rose considerably,” said Wilkerson.
...
The month-over-month composite index was 16 in January, higher than 13 in December and 15 in November. The composite index is an average of the production, new orders, employment, supplier delivery time, and raw materials inventory indexes. Growth in factory activity improved at both durable and non-durable goods plants, particularly for machinery, aircraft, chemicals, and plastics. Most month-over-month indexes also increased. The shipments, new orders, and order backlog indexes all rose moderately. The employment index inched higher from 16 to 18, while the production index was unchanged. The raw materials inventory index climbed from 7 to 15, and the finished goods inventory index moved into positive territory.
emphasis added
New Home Sales decrease to 625,000 Annual Rate in December
by Calculated Risk on 1/25/2018 10:19:00 AM
The Census Bureau reports New Home Sales in December were at a seasonally adjusted annual rate (SAAR) of 625 thousand.
The previous three months combined were revised down significantly.
"Sales of new single-family houses in December 2017 were at a seasonally adjusted annual rate of 625,000, according to estimates released jointly today by the U.S. Census Bureau and the Department of Housing and Urban Development. This is 9.3 percent below the revised November rate of 689,000, but is 14.1 percent above the December 2016 estimate of 548,000.
An estimated 608,000 new homes were sold in 2017. This is 8.3 percent above the 2016 figure of 561,000.
emphasis added
 Click on graph for larger image.
The first graph shows New Home Sales vs. recessions since 1963. The dashed line is the current sales rate.
Even with the increase in sales over the last several years, new home sales are still somewhat low historically.
The second graph shows New Home Months of Supply.
 The months of supply increased in December to 5.7 months from 4.9 months in November.
 The all time record was 12.1 months of supply in January 2009.
This is in the normal range (less than 6 months supply is normal).
"The seasonally-adjusted estimate of new houses for sale at the end of December was 295,000. This represents a supply of 5.7 months at the current sales rate."
 On inventory, according to the Census Bureau:
 "A house is considered for sale when a permit to build has been issued in permit-issuing places or work has begun on the footings or foundation in nonpermit areas and a sales contract has not been signed nor a deposit accepted."Starting in 1973 the Census Bureau broke this down into three categories: Not Started, Under Construction, and Completed.
The third graph shows the three categories of inventory starting in 1973.
The inventory of completed homes for sale is still low, and the combined total of completed and under construction is also low.
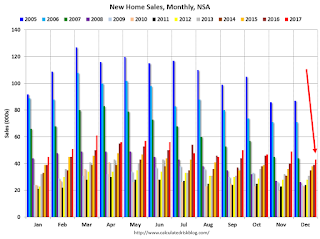 The last graph shows sales NSA (monthly sales, not seasonally adjusted annual rate).
In December 2017 (red column), 43 thousand new homes were sold (NSA). Last year, 39 thousand homes were sold in December.
The all time high for December was 87 thousand in 2005, and the all time low for December was 23 thousand in 1966 and 2010.
This was well below expectations of 683,000 sales SAAR, and the previous months combined were revised down significantly. I'll have more later today.
Weekly Initial Unemployment Claims increase to 233,000
by Calculated Risk on 1/25/2018 08:34:00 AM
The DOL reported:
In the week ending January 20, the advance figure for seasonally adjusted initial claims was 233,000, an increase of 17,000 from the previous week's revised level. The previous week's level was revised down by 4,000 from 220,000 to 216,000. The 4-week moving average was 240,000, a decrease of 3,500 from the previous week's revised average. The previous week's average was revised down by 1,000 from 244,500 to 243,500.The previous week was revised down.
The claims taking procedures in Puerto Rico and in the Virgin Islands have still not returned to normal
emphasis added
The following graph shows the 4-week moving average of weekly claims since 1971.
 Click on graph for larger image.
The dashed line on the graph is the current 4-week average. The four-week average of weekly unemployment claims decreased to 240,000.
This was much lower than the consensus forecast. The low level of claims suggest relatively few layoffs.
Wednesday, January 24, 2018
Thursday: New Home Sales, Unemployment Claims
by Calculated Risk on 1/24/2018 07:22:00 PM
Thursday:
• At 8:30 AM ET, The initial weekly unemployment claims report will be released. The consensus is for 240 thousand initial claims, up from 220 thousand the previous week.
• At 10:00 AM, New Home Sales for December from the Census Bureau. The consensus is for 683 thousand SAAR, down from 733 thousand in November.
• At 11:00 AM, the Kansas City Fed manufacturing survey for December.
Review: Here are the Ten Economic Questions for 2018 and a few predictions:
• Question #1 for 2018: How much will the economy grow in 2018?
• Question #2 for 2018: Will job creation slow further in 2018?
• Question #3 for 2018: What will the unemployment rate be in December 2018?
• Question #4 for 2018: Will the core inflation rate rise in 2018? Will too much inflation be a concern in 2018?
• Question #5 for 2018: Will the Fed raise rates in 2018, and if so, by how much?
• Question #6 for 2018: How much will wages increase in 2018?
• Question #7 for 2018: How much will Residential Investment increase?
• Question #8 for 2018: What will happen with house prices in 2018?
• Question #9 for 2018: Will housing inventory increase or decrease in 2018?
• Question #10 for 2018: Will the New Tax Law impact Home Sales, Inventory, and Price Growth in Certain States?
LA area Port Traffic Increases in December
by Calculated Risk on 1/24/2018 03:40:00 PM
Container traffic gives us an idea about the volume of goods being exported and imported - and usually some hints about the trade report since LA area ports handle about 40% of the nation's container port traffic.
From the Port of Long Beach: State of the Port Celebrates Cargo Record
The Port of Long Beach roared back from unprecedented challenges to notch its busiest year ever in 2017, moving 7.54 million twenty-foot equivalent units, an increase of more than 11 percent ...The following graphs are for inbound and outbound traffic at the ports of Los Angeles and Long Beach in TEUs (TEUs: 20-foot equivalent units or 20-foot-long cargo container).
To remove the strong seasonal component for inbound traffic, the first graph shows the rolling 12 month average.
 Click on graph for larger image.
On a rolling 12 month basis, inbound traffic was up 0.8% compared to the rolling 12 months ending in November. Outbound traffic was up 0.1% compared to the rolling 12 months ending in November.
The 2nd graph is the monthly data (with a strong seasonal pattern for imports).
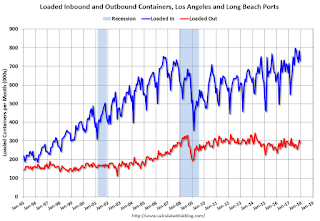 Usually imports peak in the July to October period as retailers import goods for the Christmas holiday, and then decline sharply and bottom in February or March depending on the timing of the Chinese New Year.
 Trade has been strong - especially inbound - and setting record volumes most months recently.
In general imports have been increasing, and exports are mostly moving sideways to slightly down recently.
A Few Comments on December Existing Home Sales
by Calculated Risk on 1/24/2018 11:24:00 AM
Earlier: NAR: "Existing-Home Sales Fade in December; 2017 Sales Up 1.1 Percent"
A few key points:
1) As usual, housing economist Tom Lawler's forecast was closer to the NAR report than the consensus. See: Lawler: Early Read on Existing Home Sales in December. The consensus was for sales of 5.75 million SAAR in December. Lawler estimated 5.66 million, and the NAR reported 5.57 million.
"Based on publicly-available state and local realtor/MLS reports from across the country released through today, I predict that US existing home sales as estimated by the National Association of Realtors ran at a seasonally adjusted annual rate of 5.66 million in December, down 2.6% from November’s preliminary pace"2) Inventory is still very low and falling year-over-year (down 10.3% year-over-year in December). More inventory would probably mean smaller price increases, and less inventory somewhat larger price increases. This was the 31st consecutive month with a year-over-year decline in inventory.
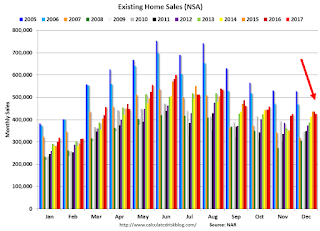
The following graph shows existing home sales Not Seasonally Adjusted (NSA).
 Click on graph for larger image.
Sales NSA in December (427,000, red column) were below sales in December 2016 (437,000, NSA) and also below sales in December 2015 (436,000, NSA).
This is the lowest sales NSA since December 2014.
Sales NSA will be lower through February.
We will probably have to wait until March - at the earliest - to draw any conclusions about the impact of the new tax law on home sales.
NAR: "Existing-Home Sales Fade in December; 2017 Sales Up 1.1 Percent"
by Calculated Risk on 1/24/2018 10:14:00 AM
From the NAR: Existing-Home Sales Fade in December; 2017 Sales Up 1.1 Percent
xisting-home sales subsided in most of the country in December, but 2017 as a whole edged up 1.1 percent and ended up being the best year for sales in 11 years, according to the National Association of Realtors®.
Total existing-home sales, which are completed transactions that include single-family homes, townhomes, condominiums and co-ops, increased 1.1 percent in 2017 to a 5.51 million sales pace and surpassed 2016 (5.45 million) as the highest since 2006 (6.48 million).
In December, existing-home sales slipped 3.6 percent to a seasonally adjusted annual rate of 5.57 million from a downwardly revised 5.78 million in November. After last month’s decline, sales are still 1.1 percent above a year ago.
...
Total housing inventory at the end of December dropped 11.4 percent to 1.48 million existing homes available for sale, and is now 10.3 percent lower than a year ago (1.65 million) and has fallen year-over-year for 31 consecutive months. Unsold inventory is at a 3.2-month supply at the current sales pace, which is down from 3.6 months a year ago and is the lowest level since NAR began tracking in 1999.
emphasis added
 Click on graph for larger image.
This graph shows existing home sales, on a Seasonally Adjusted Annual Rate (SAAR) basis since 1993.
Sales in December (5.57 million SAAR) were 3.6% higher than last month, and were 1.1% above the December 2016 rate.
The second graph shows nationwide inventory for existing homes.
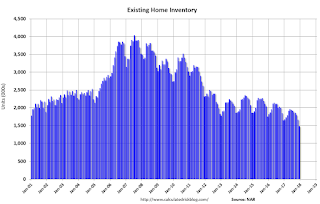 According to the NAR, inventory decreased to 1.48 million in December from 1.67 million in November. Headline inventory is not seasonally adjusted, and inventory usually decreases to the seasonal lows in December and January, and peaks in mid-to-late summer.
The last graph shows the year-over-year (YoY) change in reported existing home inventory and months-of-supply. Since inventory is not seasonally adjusted, it really helps to look at the YoY change. Note: Months-of-supply is based on the seasonally adjusted sales and not seasonally adjusted inventory.
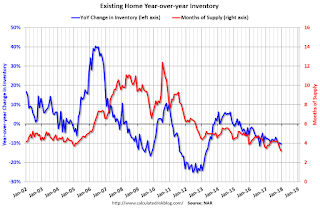 Inventory decreased 10.3% year-over-year in December compared to December 2016.
 Months of supply was at 3.2 months in December.
As expected by CR readers, sales were below the consensus view. For existing home sales, a key number is inventory - and inventory is still low. I'll have more later ...
AIA: "Architecture billings end year on positive note"
by Calculated Risk on 1/24/2018 09:19:00 AM
Note: This index is a leading indicator primarily for new Commercial Real Estate (CRE) investment.
From the AIA: Architecture billings end year on positive note
The Architecture Billings Index (ABI) concluded the year in positive terrain, with the December reading capping off three straight months of growth in design billings. The American Institute of Architects (AIA) reported the December ABI score was 52.9, down from a score of 55.0 in the previous month. This score still reflects an increase in design services provided by U.S. architecture firms (any score above 50 indicates an increase in billings). The new projects inquiry index was 61.9, up from a reading of 61.1 the previous month, while the new design contracts index decreased slightly from 53.2 to 52.7.
“Overall, 2017 turned out to be a strong year for architecture firms. All but two months saw ABI scores in positive territory,” said AIA Chief Economist, Kermit Baker, Hon. AIA, PhD. “Additionally, the overall strength of the fourth quarter lays a good foundation for healthy growth in construction activity in 2018.”
...
• Regional averages: South (56.3), West (53.0), Midwest (52.9), Northeast (49.4)
• Sector index breakdown: multi-family residential (55.4), commercial / industrial (54.8), institutional (51.2), mixed practice (50.4)
emphasis added
 Click on graph for larger image.
This graph shows the Architecture Billings Index since 1996. The index was at 52.9 in December, down from 55.0 in November. Anything above 50 indicates expansion in demand for architects' services.
Note: This includes commercial and industrial facilities like hotels and office buildings, multi-family residential, as well as schools, hospitals and other institutions.
According to the AIA, there is an "approximate nine to twelve month lag time between architecture billings and construction spending" on non-residential construction. This index was positive in 10 of the last 12 months, suggesting a further increase in CRE investment into 2018.
MBA: Mortgage Applications Increase in Latest Weekly Survey
by Calculated Risk on 1/24/2018 07:00:00 AM
From the MBA: Mortgage Applications Increase in Latest MBA Weekly Survey
Mortgage applications increased 4.5 percent from one week earlier, according to data from the Mortgage Bankers Association’s (MBA) Weekly Mortgage Applications Survey for the week ending January 19, 2018. This week’s results included an adjustment for the MLK Day holiday.
... The Refinance Index increased 1 percent from the previous week. The seasonally adjusted Purchase Index increased 6 percent from one week earlier to its highest level since April 2010. The unadjusted Purchase Index increased 2 percent compared with the previous week and was 7 percent higher than the same week one year ago. ...
The average contract interest rate for 30-year fixed-rate mortgages with conforming loan balances ($453,100 or less) increased to its highest level since March 2017, 4.36 percent, from 4.33 percent, with points remaining unchanged at 0.54 (including the origination fee) for 80 percent loan-to-value ratio (LTV) loans.
emphasis added
 Click on graph for larger image.
The first graph shows the refinance index since 1990.
Refinance activity will not pick up significantly unless mortgage rates fall well below 4%.
 The second graph shows the MBA mortgage purchase index.
 The weekly index is at the highest level since April 2010 (The 4-week average is still below the peak of last year).
According to the MBA, purchase activity is up 7% year-over-year.
Tuesday, January 23, 2018
Wednesday: Existing Home Sales
by Calculated Risk on 1/23/2018 07:09:00 PM
From Matthew Graham at Mortgage News Daily: Small Reprieve For Recent Rate Spike
Mortgage rates finally managed to move lower in a small but meaningful way today--something they haven't done in more than 2 weeks! ... While it is indeed bigger than recent examples, many prospective borrowers will find it underwhelming. In isolated cases, it may get a loan quote down to the next .125% of a percent lower, but most quotes will simply have slightly lower upfront costs (while the rate itself remains unchanged). Looked at another way, we could say apart from yesterday, today's rates are the highest in more than 9 months. [30YR FIXED - 4.25%]Wednesday:
emphasis added
• At 7:00 AM ET, The Mortgage Bankers Association (MBA) will release the results for the mortgage purchase applications index.
• At 9:00 AM, FHFA House Price Index for November 2017. This was originally a GSE only repeat sales, however there is also an expanded index.
• At 10:00 AM, Existing Home Sales for December from the National Association of Realtors (NAR). The consensus is for 5.75 million SAAR, down from 5.81 million in November. Housing economist Tom Lawler expects the NAR to report sales of 5.66 million SAAR for December.
• During the day, The AIA's Architecture Billings Index for December (a leading indicator for commercial real estate).


